Diagnosing Latent Tuberculosis in Immunocompromised
Patients Measuring Blood IP-10 Production Capacity:
An Analysis of Chronic Renal Failure Patients
Gulsah Gunluoglu
1, Ekrem Cengiz Seyhan
2, Rumeyza Kazancioglu
3, Zeki Gunluoglu
4,
Nurdan Sımsek Veske
1, Esra Ertan Yazar
1and Sedat Altin
1Abstract
Objective Patients undergoing haemodialysis for chronic renal failure-hemodialysis (CRF-HD) are at risk of latent tuberculosis infection (LTBI). The effectiveness of using blood IP-10 production capacity to diagnose LTBI in CRF-HD patients was analysed.
Methods The study enrolled 50 CRF-HD patients. Interferon-γ release assay (IGRA) was done using QuantiFERON-TB Gold In Tube (QFG-IT) system. Blood IP-10 production capacity was measured using the QFG-IT system tubes. Tuberculin skin testing (TST) was performed on the same day and the test results were compared.
Results TST turned out to be positive in 36.4% of the patients and QFG-IT in 54% of them. After stimula-tion with specific tuberculosis antigens, blood IP-10 levels increased noticeably. The antigen-stimulated blood IP-10 level was significantly higher in patients who were either TST or QFG-IT positive than in patients whose tests were negative (p=0.0001). Using 4.02 pg/mL as the threshold for stimulated blood log-transformed IP-10 level, good agreement was observed between IP-10 and QFG-IT results (κ=1).
Conclusion Blood IP-10 level, which can be measured simply, provides results equivalent to IGRAs for the diagnosis of LTBI in CRF-HD patients.
Key words: latent tuberculosis infection, chronic renal failure, IP-10, IGRA, TST (Intern Med 54: 465-472, 2015)
(DOI: 10.2169/internalmedicine.54.3245)
Introduction
According to the World Health Organisation, one-third of the global population is infected with Mycobacterium
tuber-culosis (Mtb) (1). Fortunately, in most people, the infection
is kept under control by immune defence and does not gen-erate active disease (latent tuberculosis infection, LTBI).
The classical method used to diagnose LTBI is tuberculin skin testing (TST). This test has various disadvantages. Menzies conducted a meta-analysis and found that the re-ported sensitivity of TST in diagnosing LTBI is 71%, and that the specificity of TST in diagnosing LTBI is very low
(56%) among individuals who have had the Bacillus Calmette-Guérin (BCG) vaccination (2).
One of the major developments in the diagnosis of TB in the last decade is the introduction of new-generation tests known as interferon-γ release assays (IGRAs). These meas-ure the in-vitro T cell response to Mtb-specific antigens (3). However, its results are more specific than those of TST, be-cause the testing uses two Mtb-specific antigens: Early Se-creted Antigenic Target (ESAT)-6 and Culture Filtrate Pro-tein (CFP)-10 plus TB7.7. These antigens are not present in BCG and most non-tuberculous mycobacteria, and are used instead of purified protein derivative (PPD) using in TST (4, 5). In Menzies’ meta-analysis, the specificity of the
1Department of Chest Diseases, Yedikule Teaching Hospital for Chest Diseases and Thoracic Surgery, Turkey,2Department of Chest Diseases,
Medipol University Faculty of Medicine, Turkey,3Department of Nephrology, Bezmialem Vakif University Faculty of Medicine, Turkey and 4Department of Thoracic Surgery, Faculty of Medicine, Medipol University, Turkey
Received for publication May 8, 2014; Accepted for publication July 21, 2014 Correspondence to Dr. Gulsah Gunluoglu, [email protected]
QuantiFERON test (QFT), which is one of two commercial IGRAs, for detecting LTBI was 96% among those with the BCG vaccination and 100% among those without vaccina-tion (2). However, IGRAs do not achieve a significant im-provement in sensitivity for TB diagnosis compared to TST.
Antigen-presenting cells (APCs) secrete a 10-kDa inter-feron (IFN)-γ inducible protein (IP-10) upon stimulation with IFN-γ and various cytokines (6). IFN-γ is the 10th member of the CXC chemokine family. IFN-γ, which is se-creted by Th1 lymphocytes that encounter the antigen on the surface of APCs, activates T cells and macrophages, while inducing the expression of 10 by APCs (7, 8). Then, IP-10 interacts with CXC chemokine receptor-3 (CXCR-3) trig-gering the chemotaxis of activated T lymphocytes and macrophages (9, 10). This small (2.5 times smaller than IFN-γ) molecule (11), which is essentially a chemokine, is the major inducer of pro-inflammatory immune re-sponses (12). Therefore, it can be used as an indicator of the cell-mediated immune response (8). In 2006, Ruhwald found that the IP-10 level was very high in QFT test tube superna-tants from TB patients and low in those from healthy indi-viduals (13). Consequently, the IP-10 production capacity is thought to be another way of assessing cellular immunity in TB patients (14). Studies have demonstrated that IP-10 can be induced by specific antigens in TB patients (11). A few limited case-control studies revealed that IP-10 is a potential biomarker in the diagnosis of TB (15, 16-19). The blood IP-10 production capacity is reportedly as effective as QFT in the diagnosis of LTBI (17, 20, 21). Moreover, because it is secreted in greater amounts, it might be easier to measure than IFN-γ.
The risk of LTBI activation is high in immunocom-promised persons, so it is recommended that they be screened for LTBI (22). The sensitivity of TST in the diag-nosis of TB is lower in immunocompromised individuals than in the normal population (23). IGRAs are known to be superior to TST for detecting TB or LTBI in this popula-tion (24). However, the sensitivity of IGRAs is also inade-quate (11, 25), perhaps because the level of IFN-γ expressed is even lower in immunocompromised persons and cannot be detected (26). Therefore, a marker that is expressed at a higher level might be more sensitive for diagnosis, particu-larly among this population (2, 20).
At least 50% of chronic renal failure patients under haemodialysis therapy chronic renal failure-hemodialysis (CRF-HD) patients who have active TB may have anergy to TST due to their weakened immune system (27, 28). There-fore, TST is not sufficiently reliable to rule out the possibil-ity of active TB or LTBI. Among CRF-HD patients at risk for LTBI, many more are IGRA positive than TST posi-tive (29). Nevertheless, the sensitivity of IGRAs is still ap-proximately 70% at most (30). Hence, IGRAs are far from being perfect for LTBI screening of CRF-HD patients.
As IP-10 is produced in greater amounts than IFN-γ, it might be more useful in the diagnosis of TB or LTBI in pa-tients with limited immune functions (11). This study
ana-lysed the blood IP-10 production capacity in CRF-HD pa-tients as an immunocompromised patient group to test the effectiveness of using IP-10 level to diagnose LTBI in im-munocompromised patients.
Materials and Methods
Recruitment
The study was performed in accordance with the princi-ples of the Declaration of Helsinki and approved by the eth-ics committee of Yedikule Chest Diseases and Thoracic Sur-gery Training and Research Hospital. Written informed con-sent was obtained from each enrolled participant.
The study group included CRF patients who underwent regular haemodialysis between September 2011 and Novem-ber 2011. The 50 patients who agreed were included in the study. Blood was drawn from these patients to determine their IFN-γ and IP-10 levels. All of the patients also under-went TST on the same day.
Study population
The patients included 22 females and 28 males with a mean age of 62.2 years. They had undergone thrice weekly haemodialysis for an average of 54.9 months. Fifteen pa-tients were diabetics. None of the papa-tients had human im-munodeficiency virus (HIV) infection. None of the patients exhibited any active TB symptomatology or had radiological findings of active disease.
Assessing previous exposure and risk factors
Information about other illnesses, history of TB infection, and known exposure to TB patients was collected via inter-views. Chest X-rays were reviewed routinely by the private dialysis centre. BCG vaccination status was ascertained from a self-reported vaccination history or the detection of a BCG vaccination scar on visual inspection. Twenty-one patients had a BCG scar or vaccination history.
LTBI risk factors
Fourteen of the patients had one or more LTBI risk fac-tors. Seven patients had previously recovered from TB. Four patients had a history of exposure to a TB patient. In three patients who had not had TB and had no history of expo-sure to a TB patient, the chest X-rays showed radiological changes that could be associated with previous TB (dense pulmonary nodules with or without visible calcification in the hilar area or upper lobes or pleural scarring).
Tuberculin skin testing
Tuberculin skin testing was performed using the Mantoux method intradermally on the volar surface of the forearm contralateral to the arteriovenous shunt with 0.1 mL (5 TU) of PPD (Intervax Biologicals, Markham, Canada). Re-sponses were read on the patient’s next regularly scheduled HD day, 48-72 hours after TST. As suggested by the
Cen-Table 1. Relationship between BCG Vaccination and TST or QFG-IT Results
BCG vaccinated patients, n (%)
BCG not vaccinated patients, n (%) TST result Negative 17 (68) 11 (57.9) Positive 8 (32) 8 (42.1) QFG-IT result Negative 13 (44.8) 10 (47.6) Positive 16 (55.2) 11 (52.4)
tres for Disease Control and Prevention (CDC) for CRF pa-tients (31), induration !10 mm was considered positive for the CRF patients.
Whole blood stimulation
For the test, 1 mL of whole blood was drawn in each of three Vacutainer tubes provided with the QuantiFERON-TB Gold In-tube (QFG-IT) system (Cellestis, Carnegie, Austra-lia), a new-generation QFT test. These tubes are already pre-coated with saline (negative control), the ESAT-6 and CFP10 peptides and TB 7.7 antigen (antigen stimulated), and phytohaemagglutinin (positive mitogen control). The tubes were mixed and incubated at 37°C for 20-24 hours, when the plasma was harvested and frozen until further analysis. This plasma provided the unstimulated, antigen-stimulated, and mitogen-stimulated supernatant samples. IFN-γ quantification
IFN-γ was measured by an enzyme-linked immunosorbent assay (ELISA) using the QFG-IT test, according to the manufacturer’s instructions (32). A result of !0.35 IU/mL IFN-γ in the TB antigen tube minus the negative control tube was considered a positive result. If the level was less than this and the mitogen control was positive (!0.5 IU/ mL), a negative result was recorded. If the level in both the TB antigen and mitogen tubes was less than the threshold for positive, or the level in the nil tube was >8.0 IU/mL, then an indeterminate result was recorded.
IP-10 quantification
The RayBio Human IP-10 ELISA kit (RayBiotech, Nor-cross, USA) was used to quantify IP-10 (33). This kit has a microplate with 96 wells pre-coated with a specific mono-clonal antibody for human IP-10. IP-10 supernatant levels were measured using a sandwich ELISA performed accord-ing to the manufacturer’s instructions (http://www.raybiotech. com/files/manual/ELISA/ELHIP10-001.pdf). Samples were diluted 1:2. First, 50-μL samples were taken from each of the three QFG-IT test tubes and placed in the wells, which were covered and incubated for 2.5 hours at room tempera-ture. After washing four times, 50 μL of prepared biotin antibody were added to each well and incubated for 1 hour at room temperature. The washing procedure was repeated. Then, 100 μL of streptavidin were added to the wells and incubated for 45 minutes at room temperature. After the
washing procedure, 50 μL of TMB One-Step Substrate Re-agent were added to each well and incubated for 30 minutes at room temperature in the dark. Finally, 100 μL of Stop Solution were added to each well and read immediately at 450 nm in an ELISA reader.
IP-10 measurement values are very high (up to 60,000 pg/ mL). To improve interpretability, the results were trans-formed logarithmically (common logarithm).
Statistical analyses
All statistical analyses were performed using Statistical Package for the Social Sciences (SPSS) for Windows (ver. 11.0, SPSS, Chicago, USA). Variables are presented as the medians. Kappa statistic was used to define agreement be-tween two measurements for categorical variables (scaled between 0 and 1). Mann-Whitney U test was used to com-pare median values and the chi-square or Fisher’s exact test was used to compare frequencies. Wilks’ lambda test was used to find the significance of the differences between re-peated measures. All tests were two-tailed, and p<0.05 was considered significant.
Results
TST Results
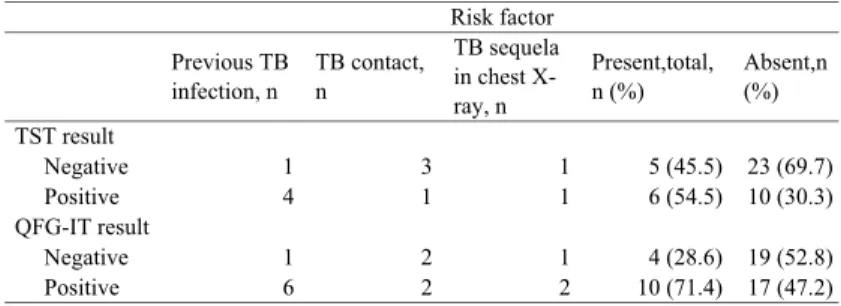
Tuberculin skin testing was performed in 44 patients who agreed to it. The induration diameter averaged 13.5 (range 10-20) mm. The test was positive in 16 of the patients (36.4%) and negative in 28 (63.6%). No differences were observed in the prevalence of diabetes between the patients with positive and negative test results (p=0.31). TST was positive in 32% of those who had the BCG vaccine, but no differences appeared in the prevalence of BCG vaccination between the patients with positive and negative test results (Table 1) (p=0.54). TST was positive in 54.5% of those who had risk factors for LTBI, but the relationship between the test result and LTBI risk (κ=0.21) was not significant (p= 0.15) (Table 2).
QFG-IT results
The QFG-IT test was administered to all of the patients: it was positive in 27 (54%), negative in 23 (46%), and inde-terminate in none (0%). No differences were observed in the prevalence of diabetes between the patients with positive and negative test results (p=1). The test was positive in 55.2% of those vaccinated with BCG, but no differences ap-peared in the prevalence of BCG vaccination between the patients with positive and negative test results (p=1) (Ta-ble 1). The test was positive in 71.4% of those who had risk factors for LTBI, but the relationship between the test result and LTBI risk factors was at the κ=0.19 level and was not significant (p=0.12) (Table 2).
Table 3 compares the results of the 44 patients who un-derwent both TST and the QFG-IT. While 18.8% of the pa-tients whose TST was positive had a negative QFG-IT
re-Table 2. Relationship between LTBI Risk Factors and TST or QFG-IT Results Risk factor Previous TB infection, n TB contact, n TB sequela in chest X-ray, n Present,total, n (%) Absent,n (%) TST result Negative 1 3 1 5 (45.5) 23 (69.7) Positive 4 1 1 6 (54.5) 10 (30.3) QFG-IT result Negative 1 2 1 4 (28.6) 19 (52.8) Positive 6 2 2 10 (71.4) 17 (47.2) TB: pulmonary tuberculosis
Table 3. Comparison of TST and QFG-IT Test Results
QFG-IT positive QFG-IT negative TST positive 13 (81.2%) 3 (18.8%) TST negative 9 (32.1%) 19 (67.9%)
sult, 32.1% of the patients whose TST was negative had a positive QFG-IT result. For TST/QFG-IT agreement κ=0.46 (p=0.002).
IP-10 measurements
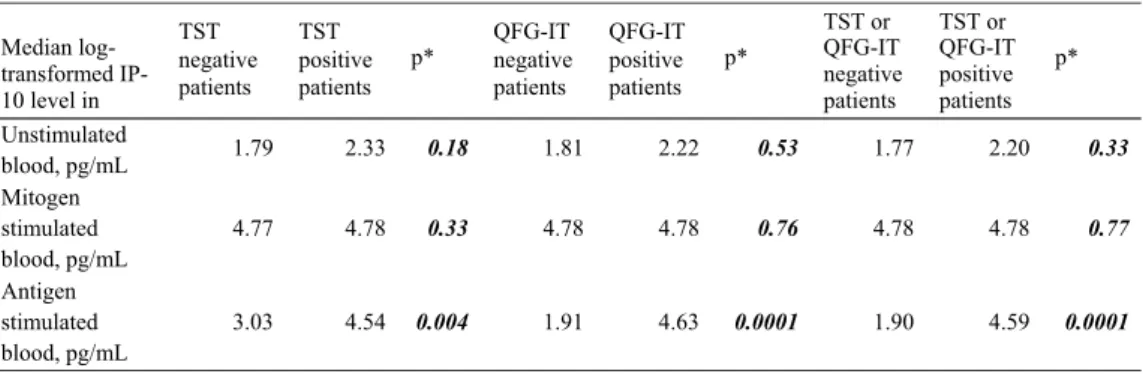
Due to the non-Gaussian distribution, median values are presented. Table 4 lists the median log-transformed IP-10 levels of unstimulated (baseline), antigen-stimulated, and stimulated blood. The unstimulated and mitogen-stimulated blood log-transformed IP-10 levels of the patients that were positive for either TST or QFG-IT did not differ from those of the patients with negative results (Mann-Whitney U-test, Table 4). All of the patients responded to mitogen. The post-mitogen IP-10 levels of five patients were lower than their antigen-stimulated blood IP-10 levels.
When stimulated with specific TB antigens, blood IP-10 levels rose markedly compared to before stimulation (Wilks’ lambda, p=0.0001). The increase was significant in all pa-tients who were TST negative (p=0.002), TST positive (p= 0.0001), or QFG-IT negative (p=0.021) or positive (p= 0.0001). While the median log transformed IP-10 level in stimulated blood of patients with no risk factors for LTBI was 3.96 pg/mL, it was 4.64 pg/mL for patients with risk factors (p=0.039, Mann-Whitney U-test). The antigen-stimulated blood IP-10 level was significantly higher in tients who were either TST or QFG-IT positive than in pa-tients whose tests were negative (p=0.0001, Mann-Whitney
U-test, Table 4).
Because there is no gold standard for diagnosing LTBI, a cut-off value for the IP-10 level in diagnosing LTBI could not been analysed. However, the maximum antigen-stimulated blood log transformed IP-10 level was 4.02 pg/ mL in patients with a negative QFG-IT test, whereas the minimum level was 4.14 pg/mL in patients with a positive QFG-IT test (Fig. 1). Taking a log transformed IP-10 level in stimulated blood of 4.02 pg/mL as the threshold for the
IP-10 test result, good agreement (κ=1) was reached be-tween the QFG-IT and IP-10 tests; all of the patients whose stimulated blood log transformed IP-10 level exceeded 4.02 pg/mL had a positive QFG-IT test. In comparison, TST was negative in nine patients with stimulated blood log trans-formed IP-10 levels higher than 4.02 pg/mL, three of whom had either risk factor for LTBI or BCG vaccination. While the QFG-IT results of all of the patients with a stimulated blood log transformed IP-10 level less than 4.02 pg/mL were negative, TST gave positive results in three of these patients. Two of these had no risk factors for LTBI, but had been vaccinated with BCG; the other patient had not been vaccinated with BCG, but had active TB (Fig. 2). When 4.02 pg/mL in stimulated blood was used as the threshold value for the IP-10 test, a moderate relationship (κ=0.46, p= 0.002) appeared between the TST and 10 results. The IP-10 levels of the patients who had positive and negative TST results intersected markedly on the intersection graph (Fig. 3).
Discussion
Blood IP-10 levels are high in individuals with household TB contact (17, 34). Additionally, blood IP-10 levels in indi-viduals with LTBI increase with stimulation (17, 35). Con-sequently, blood IP-10 level might be valuable for diagnos-ing LTBI. In this study, good agreement was found between the QFG-IT and IP-10 results in CRF patients. Therefore, the QFG-IT test or stimulated blood IP-10 level could be used to diagnose LTBI in immunocompromised individuals with CRF. Although it is impossible to state that these tests are more accurate than TST because there is no gold stan-dard for detecting LTBI, the larger number of positive CRF patients using the QFG-IT test or IP-10 level in stimulated blood makes these tests seem more precise than TST.
According to the government sources, the estimated prevalence of LTBI among healthy population in our coun-try is 25% (36). The rate of LTBI can be as high as 70% in CRF patients (37). In our series, however, LTBI was de-tected in 36.4% of the CRF patients based on TST. This rate is only slightly higher than the LTBI rate expected in the healthy population. Therefore, the LTBI rate found in CRF patients with TST is likely lower than the actual rate. One
Figure 1. Intersection graph shows patients’ QFG-IT results according to IP-10 level in stimulated blood.
Table 4. Results of Blood Log-transformed IP-10 Level Measurements
Median log-transformed IP-10 level in TST negative patients TST positive patients p* QFG-IT negative patients QFG-IT positive patients p* TST or QFG-IT negative patients TST or QFG-IT positive patients p* Unstimulated blood, pg/mL 1.79 2.33 0.18 1.81 2.22 0.53 1.77 2.20 0.33 Mitogen stimulated blood, pg/mL 4.77 4.78 0.33 4.78 4.78 0.76 4.78 4.78 0.77 Antigen stimulated blood, pg/mL 3.03 4.54 0.004 1.91 4.63 0.0001 1.90 4.59 0.0001 *Mann-Whitney U test
possible reason for this is that the anergy rate is higher in CRF patients. The reported rate of anergy to TST can ex-ceed 50% in CRF patients with active TB (27, 28); this may be caused by the immunosuppression that occurs in CRF pa-tients. We found more positive patients (54%) using the QFG-IT test or stimulated blood IP-10 level than with TST. If the results of these tests are correct, this rate suggests a high LTBI risk in CRF patients.
One of the disadvantages of TST in the diagnosis of TB or LTBI is the false positive results caused by BCG vaccina-tion (4, 5, 38, 39). In our series, we found less positivity with TST than with QFG-IT, even among individuals vacci-nated with BCG. This finding may be related to the anergy or immunosuppression expected in CRF patients. Anergy disguises not only true positivity, but also false positivity, which might explain why more positivity in immunocom-promised people has been reported with IGRAs than with TST (40).
Some studies have shown that IGRAs are better correlated with LTBI risk factors than TST (30). The same result has been obtained in CRF patients (41, 42). Passalent et al. re-ported that IGRA was positive in more than 70% of CRF patients with risk factors for LTBI, while TST gave positive
results in roughly 20% (29). We found more positivity with QFG-IT testing (or the IP-10 level in stimulated blood) than with TST in CRF patients who had LTBI risk factors (71.4% vs. 54.5%). This finding suggests that the QFG-IT (or IP-10) test is affected less by immunosuppression. How-ever, because the rate of positive results with the QFG-IT (or IP-10) test was also high among those who did not have any risk factors for LTBI (47.2% vs. 30.3%), good agree-ment was not obtained between the presence of LTBI risk factors and the test results. The IGRA-TST agreement in the diagnosis of LTBI is reportedly generally moderate (42, 43), and our findings support this.
In our series, the increase in blood IP-10 levels after stimulation with specific TB antigens was high. A limited rise in IP-10 levels after stimulation can be observed in the blood of healthy people, probably due to non-specific effects of the antigens (13, 16). However, blood IP-10 levels rise distinctly after stimulation with specific antigens in active TB patients compared with healthy people (13, 35). Blood IP-10 levels also rise with stimulation in individuals with LTBI (17, 35). We observed a good blood IP-10 response upon stimulation with specific TB antigens in CRF-HD pa-tients. Therefore, blood IP-10 level is not affected by im-munosuppression. Consequently, blood IP-10 measurement might useful in the diagnosis of LTBI in immunocom-promised people.
Because the IP-10 and QFG-IT results were the same when the threshold value of 4.02 pg/mL for the log trans-formed IP-10 level in stimulated blood was used, the rela-tionship between IP-10 level and LTBI risk factors is the same as the relationship between QFG-IT and the risk fac-tors. The presence of patients who have LTBI risk factors and a negative TST result, but a positive IP-10 or QFG-IT test result, suggests the superiority of the QFG-IT or IP-10 test over TST. Because two-thirds of the patients who were IP-10 or QFG-IT negative and TST positive had been vacci-nated with BCG, this suggests that the TST result is inaccu-rate and the QFG-IT or IP-10 result is more accuinaccu-rate.
The reported rate of positive results in healthy people is 2% for IP-10 and 0% for IGRA tests (6, 21). In contrast, with regard to LTBI, IP-10 was reportedly positive in 35% of the patients suspected of LTBI due to risk factors and
Figure 2. Relationship between IP-10 levels in stimulated blood and QFG-IT and TST results
Figure 3. Intersection graph shows patients’ TST results ac-cording to IP-10 levels in stimulated blood.
QFT was positive in 27% of them in a European multicentre study (p<0.05) (6). In the diagnosis of LTBI, more individu-als have positive results with IP-10 measurements than IGRAs. This higher rate might be because the blood IP-10 level is higher than the IFN-γ level (6), making it more eas-ily detected, and meaning that its sensitivity is greater than that of IGRA.
Conversely, in immunocompromised individuals, the rate of increase in the blood IFN-γ level is not as great, even af-ter stimulation (19), whereas IP-10 is generated in greaaf-ter amounts than IFN-γ. The blood IP-10 level was 29.1 times higher than the IFN-γ level in those with TB (6). Therefore, it can be more useful for diagnosing TB among patients with limited immune functions (11). In fact, immunocom-promised individuals have high blood IP-10 levels (44). In HIV patients, the blood IFN-γ response declines noticeably,
while the IP-10 response is affected less (20), resulting in a high IP-10 response to QFT antigens (14). The reason for this might be that IP-10 is secreted by macrophages rather than CD4 (12). No relationship has been found between the blood IP-10 level and amount of CD4 (19). In other words, the IP-10 level is not affected by decreases in the amount of CD4 (11).
However, we did not find that the IP-10 results were more useful among CRF patients, when compared with QFG-IT. Due to the very good correlation between the QFG-IT and IP-10 results, both methods seem to be equally accurate when diagnosing LTBI in CRF patients. Using IP-10 in place of IGRA for these patients might have various operational advantages for the following reasons:
1. Because IP-10 is highly expressed, a. It is easier to detect;
b. A small sample is sufficient as IP-10 mRNA can be obtained from a capillary blood sample taken from the fin-gertip (45); and
c. It can be measured using simple technology (lateral flow platform as in HIV and pregnancy tests) (6),
2. There is no need for a cold chain to transport it; it re-mains stable in dry blood or plasma (6), and can even be transported on filter paper.
Some problems with the IP-10 analysis remain unsolved. First, the analysis method (dilution) could not be standard-ised (15). Therefore, the variance (range 1,402-19,350) in the reported median IP-10 levels is large (16-23, 46). To date, no accepted threshold value has been determined for positive or indeterminate results. The log-transformed level of 4.02 pg/mL found in this study for a 1:2 dilution can serve a guideline for future research.
Conclusion
Measurement of blood IP-10 levels after stimulation with specific TB antigens might be reliable for diagnosing LTBI in CRF-HD patients. Compared with IGRA, IP-10 measure-ment is equally successful among these patients.
The authors state that they have no Conflict of Interest (COI).
Acknowledgement
We want to thank Dr. Orhan Kaya Koksalan for his help in analyzing the blood samples.
References
1. WHO. Global tuberculosis control: surveillance, planning,
financ-ing. WHO Report 2005. WHO, Geneva, Switzerland, 2005: 1-247.
2. Menzies D, Pai M, Comstock G. Meta-analysis: new tests in the
diagnosis of latent tuberculosis infection: areas of uncertainty and recommendations for research. Ann Intern Med 146: 340-354, 2007.
3. Andersen P, Munk ME, Pollock JM, Doherty TM. Specific
immune-based diagnosis of tuberculosis. Lancet 356: 1099-1104, 2000.
4. Diel R, Goletti D, Ferrara G, et al. Interferon-γ release assays for
the diagnosis of latent Mycobacterium tuberculosis infection: a systematic review and meta-analysis. Eur Respir J 37: 88-99, 2011.
5. Pai M, Zwerling A, Menzies D. Systematic review: T-cell-based
assays for the diagnosis of latent tuberculosis infection: an up-date. Ann Intern Med 149: 177-184, 2008.
6. Ruhwald M, Dominguez J, Latorre I, et al; TBNET. A multicentre
evaluation of the accuracy and performance of IP-10 for the diag-nosis of infection with M. tuberculosis. Tuberculosis 91: 260-267, 2011.
7. Groom JR, Luster AD. CXCR3 ligands: redundant, collaborative
and antagonistic functions. Immunol Cell Biol 89: 207-215, 2011.
8. Chen J, Liu X. The role of interferon g in regulation of CD4+
T-cells and its clinical implications. Cell Immunol 254: 85-90, 2009.
9. Farber JM. Mig and IP-10: CXC chemokines that target
lympho-cytes. J Leukoc Biol 61: 246-257, 1997.
10. Ferrero E, Biswas P, Vettoretto K, et al. Macrophages exposed to
Mycobacterium tuberculosisrelease chemokines able to re-cruit se-lected leukocytes subpopulations: focus on gammadelta cells. Im-munology 108: 365-374, 2003.
11. Ruhwald M, Aabye MG, Ravn P. IP-10 release assays in the
diag-nosis of tuberculosis infection: current status and future directions. Expert Rev Mol Diagn 12: 175-187, 2012.
12. Moser B, Loetscher P. Lymphocyte traffic control by chemokines.
Nat Immunol 2: 123-128, 2001.
13. Ruhwald M, Bjerregaard-Andersen M, Rabna P, Kofoed K,
Eugen-Olsen J, Ravn P. IP-10/CXCL10 release is induced by in-cubation of whole blood from tuberculosis patients with ESAT-6, CFP10 and TB7.7. Microbes Infect 9: 806-812, 2007.
14. Kabeer BS, Sikhamani R, Raja A. Comparison of interferon
gamma-inducible protein-10 and interferon gamma-based Quanti-FERON TB Gold assays with tuberculin skin test in HIV-infected subjects. Diagn Microbiol Infect Dis 71: 236-243, 2011.
15. Lighter J, Rigaud M, Huie M, Peng CH, Pollack H. Chemokine
IP-10: an adjunct marker for latent tuberculosis infection in chil-dren. Int J Tuberc Lung Dis 13: 731-736, 2009.
16. Whittaker E, Gordon A, Kampmann B. Is IP-10 a better
bio-marker for active and latent tuberculosis in children than IFN
gamma? PLoS One 3: e3901, 2008.
17. Ruhwald M, Petersen J, Kofoed K, et al. Improving T-cell assays
for the diagnosis of latent TB infection: potential of a diagnostic test based on IP-10. PLoS One 3: e2858, 2008.
18. Dheda K, van Zyl Smit R, Badri M, Pai M. T-cell
interferon-gamma release assays for the rapid immunodiagnosis of tuberculo-sis: clinical utility in high-burden vs. low-burden settings. Curr Opin Pulm Med 15: 188-200, 2009.
19. Goletti D, Raja A, Syed Ahamed Kabeer B, et al. Is IP-10 an
ac-curate marker for detecting M. tuberculosis-specific response in HIV-infected persons? PLoS One 5: e12577, 2010.
20. Aabye MG, Ruhwald M, Praygod G. Potential of interferon-
γ-inducible protein 10 in improving tuberculosis diagnosis in HIV-infected patients. Eur Respir J 36: 1488-1490, 2010.
21. Ruhwald M, Bodmer T, Maier C, et al. Evaluating the potential of
IP-10 and MCP-2 as biomarkers for the diagnosis of TB. Eur Respir J 32: 1607-1615, 2008.
22. Canadian Tuberculosis Committee (CTC). Updated
recommenda-tions on interferon gamma release assays for latent tuberculosis in-fection. An Advisory Committee Statement (ACS). Can Commun Dis Rep 34 (ACS-6): 1-13, 2008.
23. American Thoracic Society. Targeted tuberculin testing and
treat-ment of latent tuberculosis infection. MMWR Recomm Rep 49: 1-51, 2000.
24. Lalvani A, Pareek M. A 100 year update on diagnosis of
tubercu-losis infection. Br Med Bull 93: 69-84, 2010.
25. Raby E, Moyo M, Devendra A, et al. The effects of HIV on the
sensitivity of a whole blood IFN-gamma release assay in Zambian adults with active tuberculosis. PLoS ONE 3: e2489, 2008.
26. Ruhwald M, Ravn P. Immune reconstitution syndrome in
tubercu-losis and HIV-co-infected patients: Th1 explosion or cytokine storm? AIDS 21: 882-884, 2007.
27. Shankar MS, Aravindan AN, Sohal PM, et al. The prevalence of
tuberculin sensitivity and anergy in chronic renal failure in an en-demic area: Tuberculin test and the risk of post-transplant tubercu-losis. Nephrol Dial Transplant 20: 2720-2724, 2005.
28. Abdelrahman M, Sinha AK, Karkar A. Tuberculosis in end-stage
renal disease patients on hemodialysis. Hemodial Int 10: 360-364, 2006.
29. Passalent L, Khan K, Richardson R, Wang J, Dedier H, Gardam
M. Detecting latent tuberculosis infection in hemodialysis patients: A head-to-head comparison of the T-SPOT.TB test, and an expert physician panel. Clin J Am Soc Nephrol 2: 68-73, 2007.
30. Hoffmann M, Tsinalis D, Vernazza P, Fierz W, Binet I.
Assess-ment of an interferon-gamma release assay for the diagnosis of la-tent tuberculosis infection in haemodialysis patients. Swiss Med Wkly 140: 286-292, 2010.
31. Targeted tuberculin testing and treatment of latent tuberculosis
in-fection. American Thoracic Society. MMWR Recomm Rep 49: 1-51, 2000.
32. Cellestis. QuantiFERON s-TB Gold package insert. [Internet].
[cited 2013 Dec 20]. Available from: http://www.cellestis.com/IR M/content/PI/QFT/2PK/AU.pdf
33. RayBiotech. RayBio Human IP-10 ELISA Kit User Manual.
[In-ternet]. [cited 2014 May 15]. Available from: http://www.raybiotec h.com/files/manual/ELISA/ELH-IP10-001.pdf
34. Azzurri A, Sow OY, Amedei A, et al. IFN-gamma-inducible
pro-tein 10 and pentraxin 3 plasma levels are tools for monitoring flammation and disease activity in Mycobacterium tuberculosis in-fection. Microbes Infect 7: 1-8, 2005.
35. Ruhwald M, Bjerregaard-Andersen M, Rabna P, Kofoed K,
Eugen-Olsen J, Ravn P. CXCL10/IP-10 release is induced by in-cubation of whole blood from tuberculosis patients with ESAT-6, CFP10 and TB7.7. Microbes Infect 9: 806-812, 2007.
36. Turkish Ministry of Health Department of Tuberculosis Control.
The Book of Tuberculosis Control in Turkey. Ankara, 2003: 10 (in Turkish).
37. Segall L, Covic A. Diagnosis of tuberculosis in dialysis patients:
current strategy. Clin J Am Soc Nephrol 5: 1114-1122, 2010.
38. Wang L, Turner MO, Elwood RK, Schulzer M, FitzGerald JM. A
meta-analysis of the effect of Bacille Calmette Guerin vaccination on tuberculin skin test measurements. Thorax 57: 804-809, 2002.
39. Nahid P, Pai M, Hopewell PC. Advances in the diagnosis and
treatment of tuberculosis. Proc Am Thorac Soc 3: 103-110, 2006.
40. Richeldi L, Losi M, D’Amico R, et al. Performance of tests for
la-tent tuberculosis in different groups of immunocompromised pa-tients. Chest 136: 198-204, 2009.
41. Winthrop KL, Nyendak M, Calvet H, et al. Inter-feron-gamma
re-lease assays for diagnosing mycobacterium tuberculosis infection in renal dialysis patients. Clin J Am Soc Nephrol 3: 1357-1363, 2008.
42. Seyhan EC, Sökücü S, Altin S, et al. Comparison of the
Quanti-FERON-TB Gold In-Tube test with the tuberculin skin test for
de-tecting latent tuberculosis infection in hemodialysis patients. Transpl Infect Dis 12: 98-105, 2010.
43. Pai M, Kalantri S, Dheda K. New tools and emerging
technolo-gies for the diagnosis of tuberculosis: part I. Latent tuberculosis. Expert Rev Mol Diagn 6: 413-422, 2006.
44. Frahm M, Goswami ND, Owzar K, et al. Discriminating between
latent and active tuberculosis with multiple biomarker responses. Tuberculosis 91: 250-256, 2011.
45. Chakera A, Bennett SC, Cornall RJ. A whole blood
monokine-based reporter assay provides a sensitive and robust measurement of the antigen-specific T cell response. J Translat Med 9: 143, 2011.
46. Petrucci R, Abu Amer N, Gurgel RQ, et al. Interferon gamma,
interferon-gamma-induced-protein 10, and tuberculin responses of children at high risk of tuberculosis infection. Pediatr Infect Dis J
27: 1073-1077, 2008.
Ⓒ 2015 The Japanese Society of Internal Medicine http://www.naika.or.jp/imonline/index.html