THE RISE IN THE LABOR FORCE PARTICIPATION AND THE
DECLINE IN EMPLOYMENT OF MALES ARE THE DRIVING FORCES
BEHIND THE INCREASE IN THE UNEMPLOYMENT RATE
Seyfettin Gürsel*, Gökçe Uysal-Kolaşin** and Mehmet Alper Dinçer***
Executive Summary
Unemployment is sharply increasing due to the global economic crisis and due to the macroeconomic conditions in Turkey. Higher female labor force participation is an important factor behind the sharp increase in the number of unemployed. However, labor market figures also show that some of the women who enter the labor market are successful in finding jobs. Between December 2007 and December 2008, female labor force and employment have risen by 500 and 250 thousand, respectively. On the other hand, male labor force has increased by 528 thousand, whereas male employment has decreased by 160 thousand.
Employment for females is increasing irrespective of their education level, implying that the upward trend in the female labor force participation is not the sole determinant of rising unemployment. Employment of males with a high school degree or less is declining dramatically. The decreasing employment and increasing unemployment of males with low educational levels is striking.
Female labor force has gone up by 14 % during the past year
Unemployment is sharply increasing due to the global economic crisis and due to the macroeconomic conditions in Turkey.1 There is an ongoing discussion on whether the added worker effect plays a
prominent role in the soaring unemployment rates.
During an economic downturn, some household members lose their jobs. Many new entrants to the labor market fail to find a job. Individuals who are currently employed face a higher risk of
unemployment. This is why some members of the household who were not participating in the labor market before the downturn; decide to participate in order to compensate for the actual or possible decline in their total household income. This increase in the labor force is called the added worker effect.
In Turkey, the added worker effect is more likely to be observed among females because the female labor force participation in Turkey is particularly low (26.1% in 2007). Females who do not participate in the labor market constitute an immense “potential labor force” and are behind the added worker effect in periods of crisis. As expected, a rapid increase in female labor force participation is observed at this crisis as well.
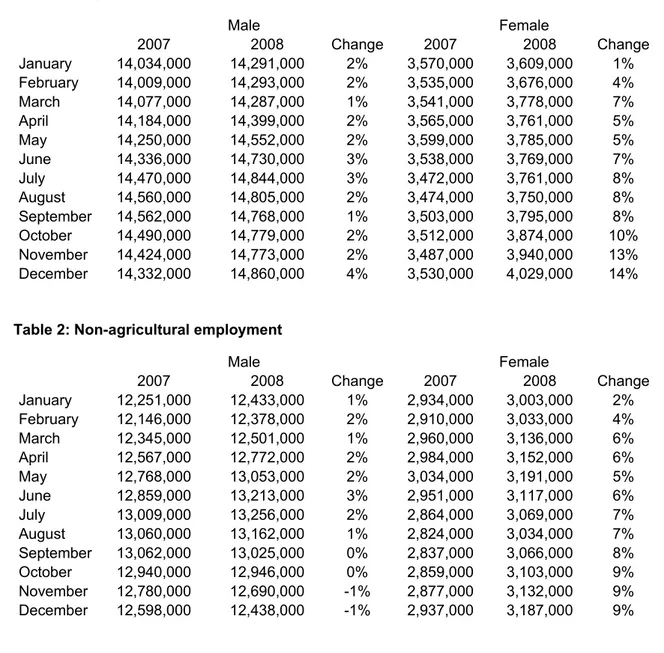
However, the rise in the number of unemployed and in the unemployment rate can only partially be explained by the added worker effect. Table 1 presents the monthly non-agricultural labor force and the annual percentage change for 2007 and 2008. Even though the male labor force has increased by
Research Brief 09/31
528 thousand, the percentage change does not display a significant change between 2008 January and 2008 December. However, female labor force participation is rapidly increasing during the same period. During the twelve months between December 2007 and December 2008, the female non-agricultural labor force has increased by 499 thousand (14%).
Essential factors to take into account while analyzing labor market figures:
Labor force participants can be divided in two groups: Employed and unemployed. Given that young population forms a substantial part of population in Turkey, the labor force is constantly growing. In markets where the labor force is growing, an increase in employment may be observed concurrently with an increase in the unemployment rate. As seen in the second equation below, an increase in the number of employed causes an increase in the denominator. However, when the number of
unemployed increases as well, both the nominator and denominator change and the resulting unemployment rate may be higher despite the increase in the number of employed.
Labor force = Employed + Unemployed
Unemployment rate = Unemployed / (Employed + Unemployed)
Table 1: Non-agricultural labor force
Male Female 2007 2008 Change ( 2007 2008 Change January 14,034,000 14,291,000 2% 3,570,000 3,609,000 1% February 14,009,000 14,293,000 2% 3,535,000 3,676,000 4% March 14,077,000 14,287,000 1% 3,541,000 3,778,000 7% April 14,184,000 14,399,000 2% 3,565,000 3,761,000 5% May 14,250,000 14,552,000 2% 3,599,000 3,785,000 5% June 14,336,000 14,730,000 3% 3,538,000 3,769,000 7% July 14,470,000 14,844,000 3% 3,472,000 3,761,000 8% August 14,560,000 14,805,000 2% 3,474,000 3,750,000 8% September 14,562,000 14,768,000 1% 3,503,000 3,795,000 8% October 14,490,000 14,779,000 2% 3,512,000 3,874,000 10% November 14,424,000 14,773,000 2% 3,487,000 3,940,000 13% December 14,332,000 14,860,000 4% 3,530,000 4,029,000 14% Table 2: Non-agricultural employment
Male Female 2007 2008 Change 2007 2008 Change January 12,251,000 12,433,000 1% 2,934,000 3,003,000 2% February 12,146,000 12,378,000 2% 2,910,000 3,033,000 4% March 12,345,000 12,501,000 1% 2,960,000 3,136,000 6% April 12,567,000 12,772,000 2% 2,984,000 3,152,000 6% May 12,768,000 13,053,000 2% 3,034,000 3,191,000 5% June 12,859,000 13,213,000 3% 2,951,000 3,117,000 6% July 13,009,000 13,256,000 2% 2,864,000 3,069,000 7% August 13,060,000 13,162,000 1% 2,824,000 3,034,000 7% September 13,062,000 13,025,000 0% 2,837,000 3,066,000 8% October 12,940,000 12,946,000 0% 2,859,000 3,103,000 9% November 12,780,000 12,690,000 -1% 2,877,000 3,132,000 9% December 12,598,000 12,438,000 -1% 2,937,000 3,187,000 9%
are able to find jobs. Table 2 presents monthly non-agricultural employment levels and their annual percentage changes for 2007 and 2008. The number of employed females is rising since January 2007 (Graph 1).
The non-agricultural male employment has been slowing down since August 2008 despite the
negative annual growth rate of industrial production at that time. Afterwards, the non-agricultural male employment starts to stagnate and finally drops (Table 2). In stark contrast, the number of employed females in the non-agriculture sector has been increasing especially after July 2008. As of December 2008 the annual growth of non-agricultural female employment has reached 9%. Such a growth rate is extraordinary during a period of crisis. Between December 2007 and December 2008, the
non-agricultural male employment has dropped by 160 thousand while non-non-agricultural female employment has augmented by 250 thousand.
In sum, between December 2007 and December 2008 a rise of 528 thousand in male labor force has been accompanied with a decline of 160 thousand in male employment, whereas the female labor force has increased by 500 thousand and female employment by 250 thousand. During the past year, the total increase of 937 thousand in the number of unemployed has come from 688 thousand in male and 249 thousand in female unemployment.
The Decrease in Employment for the Males with Low Education Levels
It is interesting to see how employment and unemployment numbers change across different education levels. The following graphs (Graph 3 - 6) present the annual changes in the male and female employment and unemployment levels for each month (for example December 2008 stands for the difference between December 2008 and December 2007).
We observe a decrease in the urban employment of males with high school degree or less. As for the urban female employment, an increase is observed for every educational level. Clearly, the university graduates have been the least affected by the adverse impact of the crisis.
These figures show that the unskilled male employment suffers severely during the crisis period. Given that informality is a widespread phenomenon among the unskilled labor force, it is not surprising that the employment collapse concentrates on this segment where the firing costs are close to null. Consequently, the rising unemployment rate cannot be explained solely by the recent increase in female labor force participation, which has also been accompanied by an increase in the female employment. On the other hand, the rising unemployment and decreasing employment among males with at most a high school degree constitute the driving force behind the deterioration in the labor market indicators. As a matter of fact, while the total number of unemployed in urban areas has risen by 581 thousand annually, the number of unemployed among the less educated males has risen by 362 thousand in the same period (62% of total increase).
Female Labor Force Participation Should Be Encouraged
Although the female labor force participation rate has increased via the added worker effect, this rate (26.1%) is the lowest among European countries. According to Table 3, even in Italy, where female labor force participation is the lowest among EU member countries, 50.7% of females in the working age population are participating in the labor force. Instead of pointing at the female labor force participation when explaining rising unemployment rates, the policy makers should focus on the policies aimed at increasing female labor force participation in the medium and in the long run.
Table 3: Labor force participation rates (2007) Male Female Sweden 81.4 76.8 Denmark 83.9 76.4 Norway 81.6 75.9 Finland 77.2 73.8 Netherlands 84.6 72.2 Germany 81.8 70.1 UK 82.2 69 Portugal 79.4 68.8 Austria 81.7 67.8 Slovenia 75.8 66.6 France 74.9 65.6 Ireland 81.4 63.3 Bulgaria 70.6 62.1 Czech Republic 78.1 61.5 Spain 81.4 61.4 Belgium 73.6 60.4 Poland 70 56.5 Croatia 70.4 56.4 Romania 70.1 56 Hungary 69 55.1 Greece 79.1 54.9 Italy 74.4 50.7 Turkey 74.4 26.1 Source: Eurostat 81.4 76.8