WEAK GROWTH IN THE FIRST QUARTER
Zümrüt İmamoğlu* and Barış Soybilgen†
Executive Summary
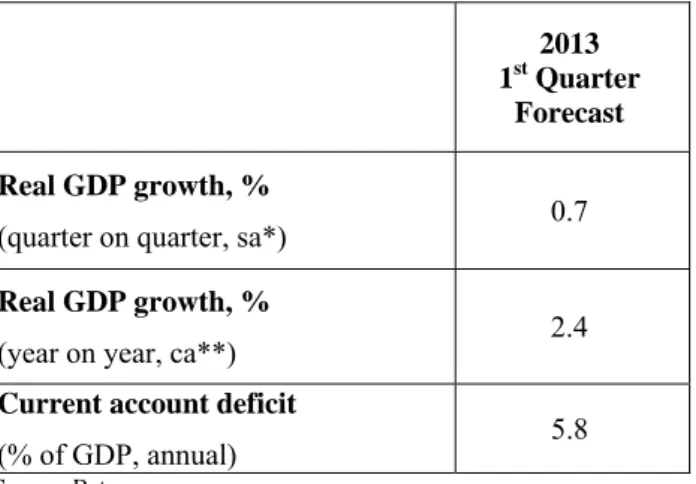
In March, the Industrial Production Index (IPI) decreased by 0.9 percent from February. Export volume index and import volume index decreased by 2.5 and 1.5 percent, respectively. Even though declines in indices lowered the spirits, the economy continues to recover. In fact, increases in consumer goods production and imports imply that consumption is reviving. Betam keeps its quarter on quarter (QoQ) forecast for the first quarter at 0.7 percent and the corresponding year on year (YoY) growth rate forecast is 2.4 percent.
Due to the increase in tourism income, the current account deficit (CAD), which had increased by $1 billion in February, declined again in March. As a result, the 12-month CAD fell down to $47.1 billion in March. The CAD was $48 billion in February. Betam expects the current account deficit to GDP ratio, which was 6 percent at the end of 2012 to decline to 5.8 percent at the end of the first quarter.
* Dr. Zümrüt İmamoğlu, Betam, Research Associate. [email protected]
† Barış Soybilgen, Betam, Research Assistant,
Table 1: Betam’s quarterly and annual growth rate forecasts
Source: Betam.
*sa: seasonally and calendar day adjusted **ca: calendar day adjusted
Revival is weak in the first quarter In the first quarter, the IPI increased by 2.5 percent from the same quarter of the previous year (calendar day adjusted), and it increased by 1 percent QoQ (seasonal and calendar day adjusted). In the last quarter of 2012, these numbers were 0.9 and 0.8 percent, respectively. We observe that the IPI continued to increase in the first quarter but the increase is not large enough to push the growth rate to 4 percent.
On the other hand, there is a significant revival in imports. Both consumer and investment goods imports surged compared to the previous quarter. However, export performance is below expectations due to weak foreign demand. Gold
2013 1st Quarter
Forecast Real GDP growth, %
(quarter on quarter, sa*) 0.7
Real GDP growth, %
(year on year, ca**) 2.4
Current account deficit
(% of GDP, annual) 5.8
Economic Outlook and Forecasts:
May 2013
excluded exports increased only slightly QoQ. We believe that net exports will contribute negatively to real GDP growth in the first quarter.
Consumer and investment goods imports and production increased showing signs that investment and consumption expenditures increased in the first quarter. Even though durable goods production, which is an important indicator for consumption, surged in March, it declined in the first quarter from the previous quarter. Consumer confidence index was above the level of the previous quarter, but real sector confidence index fell slightly in the same period.
We are still receiving mixed signals from economic indicators. We think that declines in both foreign trade indicators and industrial production index in March was caused by monthly fluctuations and the economy continues to recover overall. Our QoQ forecast for the first quarter remains at 0.7 percent. The corresponding YoY growth rate is 2.4 percent. The decline in imports in March reduced our current account deficit forecast slightly. Betam expects the current account deficit to GDP ratio to decline to 5.8 percent at the end of the first quarter from 6 percent at year end in 2012.
Expansionary monetary policy continued
The Central Bank of the Republic of Turkey (CBRT) cut the policy interest rate from 5.5 percent to 5 percent last month and further reduced to 4,5 percent in May. CBRT also announced that interest rate corridor will not be used as a policy instrument anymore; instead CBRT stated that the
Reserve Options Mechanism (ROM) will be used to preserve financial stability. We believe that abandoning the interest rate corridor will decrease the uncertainty on interest rates and ease the communication by CBRT.
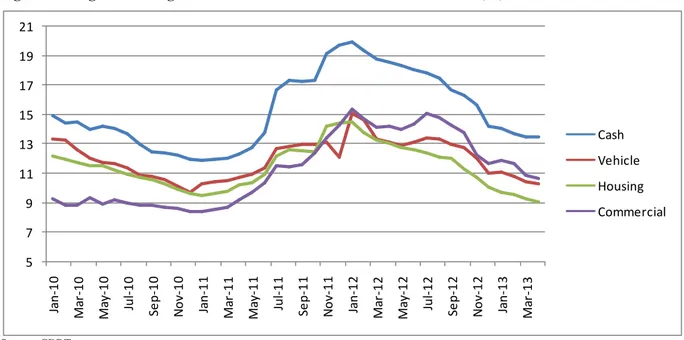
The interest rate cut has pushed the market interest rate below 5 percent. The cuts since last year has also been pushing credit loan rates down. In January 2012, average interest rate for housing and commercial loans reached their highest point of 15 percent (Figure 4). Since the CBRT started loosening monetary policy to foster growth, rates has been declining. In April, average interest on housing loans was 9.1 percent, close to all time low level, whereas the average rate on commercial loans was 10.7 percent, above the all time low of
8.5 percent.1 Policy makers want to decrease the
interest rates on commercial loans further to encourage investment. However, one should keep in mind that monetary policy affects the economy with a lag and taking hasty decisions before observing the impact of outstanding interest rate cuts might encourage risky behavior.
Private consumption is the driving force in the first quarter
Consumer and non-durable goods imports increased by 4.4 and 2.1 percent, respectively, in the first quarter from the previous quarter. However, durable goods production decreased by 0.7 percent in the same period. Consumer confidence index in the first quarter was not
1 Following the decision of the monetary policy committee at
the last week of April, interest rates on commercial loans fell back to 8.84 percent.
promising due to decreases in February and March, but overall it increased 2.9 percent over the last quarter. Similarly, special consumption tax revenue was higher than that of the previous quarter, although it declined both in February and March. Overall we expect private consumption expenditure to increase and be the main driving force behind GDP growth in the first quarter of.
Recovery in private investment expenditure
The intermediate and investment goods imports increased 1.9 and 7.5 percent, respectively, in the first quarter from the previous quarter. In line with imports, the intermediate and investment goods production also increased 0.6 and 2.5 percent, respectively, in the same period. Industrial production index, overall, increased by 1 percent
in the first quarter. Moreover, passenger cars
declined by 2.3 percent, whereas commercial vehicles increased by 13.8 percent. On the other hand, real sector confidence index fell by 0.7 percent in spite of
increases in production and imports. We believe that
increases in investment goods production and imports imply a revival in investment demand and we expect an increase in investment expenditures in the first quarter.
Contribution of net exports could be negative in the 1st quarter
Figure 2 shows monthly changes of seasonally adjusted import and export volume indices. In the first quarter, export volume index decreased by 2.4 percent, whereas the import volume index increased by 4.2 percent. In March, both export volume index and export volume index declined
by 2.5 percent and 1.5 percent. As seen in Figure 2, the divergence between export and import volume indices is getting larger. Therefore, we expect net exports to subtract from GDP growth in the first quarter.
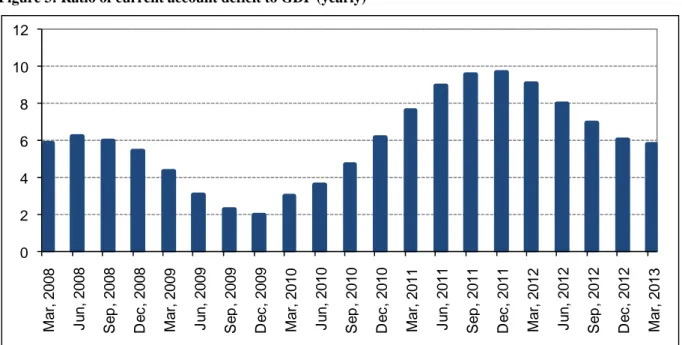
The current account rebounds
In March, the trade deficit decreased slightly, $0.9 billion, over the same month of the previous year and fell to $5.4 billion. The decrease was due to the decline in imports and the increase in tourism income. Gold trade also contributed to the current account deficit by $0.6 billion. Consequently, the 12-month total current account deficit declined from $48 billion to $47.1 billion at the end of March. Betam expects the current account deficit to GDP ratio which was 6 percent at the end of 2012 to decline to 5.8 percent at the end of the first quarter.
On the other hand, capital inflow in March was high, $9.3 billion but only $0.4 billion of this inflow was foreign direct investment. The increase in the financial account was mainly caused by the increase in credits and deposits. Strong capital inflows which were higher than the current account deficit increased CBRT reserves by $2.4 billion. The monetary easing by Japanese Central Bank caused capital inflows to accelerate and in spite of CBRT’s interest cuts, strong capital inflows prevented real exchange rate to drop below 120 until FED chair Ben Bernanke’s warning of a FED pullback started the recent emerging market sell-off.
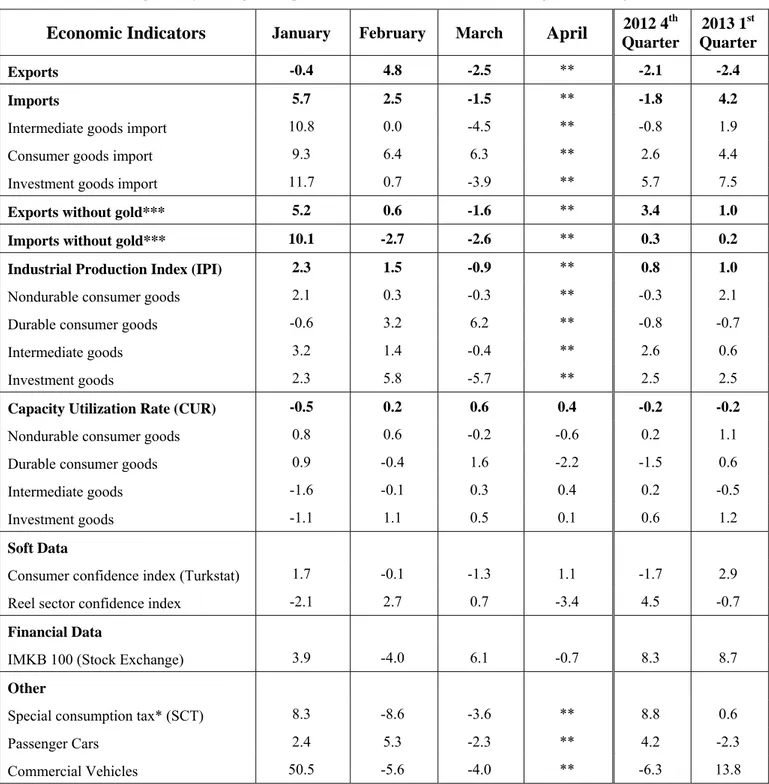
Table 2: Monthly and quarterly changes of Betam’s selected indicators (real and sa)
Economic Indicators
January February MarchApril
2012 4th Quarter 2013 1st Quarter Exports -0.4 4.8 -2.5 ** -2.1 -2.4 Imports 5.7 2.5 -1.5 ** -1.8 4.2
Intermediate goods import 10.8 0.0 -4.5 ** -0.8 1.9
Consumer goods import 9.3 6.4 6.3 ** 2.6 4.4
Investment goods import 11.7 0.7 -3.9 ** 5.7 7.5
Exports without gold*** 5.2 0.6 -1.6 ** 3.4 1.0
Imports without gold*** 10.1 -2.7 -2.6 ** 0.3 0.2
Industrial Production Index (IPI) 2.3 1.5 -0.9 ** 0.8 1.0
Nondurable consumer goods 2.1 0.3 -0.3 ** -0.3 2.1
Durable consumer goods -0.6 3.2 6.2 ** -0.8 -0.7
Intermediate goods 3.2 1.4 -0.4 ** 2.6 0.6
Investment goods 2.3 5.8 -5.7 ** 2.5 2.5
Capacity Utilization Rate (CUR) -0.5 0.2 0.6 0.4 -0.2 -0.2
Nondurable consumer goods 0.8 0.6 -0.2 -0.6 0.2 1.1
Durable consumer goods 0.9 -0.4 1.6 -2.2 -1.5 0.6
Intermediate goods -1.6 -0.1 0.3 0.4 0.2 -0.5
Investment goods -1.1 1.1 0.5 0.1 0.6 1.2
Soft Data
Consumer confidence index (Turkstat) 1.7 -0.1 -1.3 1.1 -1.7 2.9
Reel sector confidence index -2.1 2.7 0.7 -3.4 4.5 -0.7
Financial Data
IMKB 100 (Stock Exchange) 3.9 -4.0 6.1 -0.7 8.3 8.7
Other
Special consumption tax* (SCT) 8.3 -8.6 -3.6 ** 8.8 0.6
Passenger Cars 2.4 5.3 -2.3 ** 4.2 -2.3
Commercial Vehicles 50.5 -5.6 -4.0 ** -6.3 13.8
Source: TurkStat, CBRT, Treasury, ISE, Betam. All series are real (or inflation adjusted) wherever necessary and seasonally adjusted. *This tax is collected on sales of goods such as gas, fuel oils, alcohol, tobacco products and automobiles.
**Data not yet released.
Figure 1: Capacity utilization rate and industrial production index (sa. left axis for CUR and right axis for IPI)
Source: TurkStat. Betam.
Figure 2: Volume indices of exports and imports (sa)
Source: Turkstat, Betam.
Figure 3: Ratio of current account deficit to GDP (yearly)
Source: CBRT. TurkStat. Betam.
75 80 85 90 95 100 105 110 115 120 55 60 65 70 75 80 85 Ja n -0 7 Ma y -0 7 Se p -0 7 Ja n -0 8 May -08 Se p -0 8 Ja n -0 9 May -09 Se p -0 9 Ja n -1 0 May -10 Se p -1 0 Ja n -1 1 Ma y -1 1 Se p -1 1 Ja n -1 2 Ma y -1 2 Se p -1 2 Ja n -1 3 CUR IPI 70 80 90 100 110 120 130 140 Jan -0 7 May-07 Se p -0 7 Jan -0 8 May-08 Se p -0 8 Jan -0 9 May-09 Se p -0 9 Jan -1 0 May-10 Se p -1 0 Jan -1 1 May-11 Se p -1 1 Jan -1 2 May-12 Se p -1 2 Jan -1 3 Export Import 0 2 4 6 8 10 12 M a r, 20 08 J u n, 20 0 8 Se p , 20 08 D e c , 20 08 M a r, 20 09 J u n, 20 0 9 Se p, 20 09 D e c , 20 09 Ma r, 20 10 J u n, 20 1 0 Se p, 20 10 D e c , 20 10 Ma r, 20 11 J u n, 20 1 1 Se p, 20 11 D e c , 20 11 M a r, 20 12 J u n, 20 1 2 Se p , 20 12 De c , 20 12 M a r, 20 13
Figure 4: Weighted Average Interest Rates for Turkish Lira Banks' Loans (%)
Source: CBRT.
Figure 5: YoY increase in IPI in 2012 and 2013 (calendar day adjusted)
. Source: Turkstat. 5 7 9 11 13 15 17 19 21 Jan ‐10 Ma r‐ 10 Ma y‐ 10 Ju l‐ 10 Se p ‐10 No v‐ 10 Jan ‐11 Ma r‐ 11 Ma y‐ 11 Ju l‐ 11 Se p ‐11 No v‐ 11 Jan ‐12 Ma r‐ 12 Ma y‐ 12 Ju l‐ 12 Se p ‐12 No v‐ 12 Jan ‐13 Ma r‐ 13 Cash Vehicle Housing Commercial ‐3 ‐2 ‐1 0 1 2 3 4 5 6 7 2012 2013