Labor Market Outcomes of Child Workers in Turkey:
Employment Status, Wages, and Informality
Melike K¨okkızıl
3
Istanbul Bilgi University
This thesis is submitted to the Graduate School of Social Sciences with
unanimous approval for the degree of Master of Science in Economics
4
Melike K¨
okkızıl @ 2015
ABSTRACT
The effects of having worked as a child on adult labor market outcomes are one of the recent strands in child labor literature. The dataset pooling the Survey for Income and Living Conditions of the years between 2006 to 2013 indicates that 22.2 percent of people in Turkey had started to work at their regular jobs in the ages between 8 and 15 years. In this study, three models are applied in order to examine the effects of child labor on adult labor market outcomes. The results indicate that working in the past as a child significantly decreases hourly real wages. Another finding is that there is no statistical relationship between working informally and working as a child in the past. It means that child workers do not feed informality in Turkey. The last estimation results also show that males who having worked as a child are significantly more likely to work as employer and unpaid family worker relative to those who had never worked in the labor market as a child.
¨
OZET
C¸ ocuk i¸s¸cili˘gi yazınında, son zamanların inceleme konularından biri de ge¸cmi¸ste ¸cocuk i¸s¸ci olarak ¸calı¸smı¸s olmanın, yeti¸skin i¸sg¨uc¨u piyasası ¸cıktılarına etkileridir. Gelir ve Ya¸sam Ko¸sulları Anketi’nin 2006-2013 yılı mikro kesit verilerinin birle¸stirilmesi ile elde edilen veriye g¨ore, T¨urkiye’deki bireylerin y¨uzde 22,2’si ilk d¨uzenli i¸slerine 8 ile 15 ya¸slarındayken ba¸slamı¸stır. Bu ¸calı¸smada, ¸cocuk i¸s¸cili˘ginin yeti¸skin i¸sg¨uc¨u piyasası ¸cıktılarına etkilerini in-celemek amacıyla ¨u¸c model uygulanmı¸stır. Modellerin sonu¸clarına g¨ore, ¸cocukken ¸calı¸smı¸s olmak bireylerin yeti¸skin olduklarında aldıkları haftalık reel ¨ucretlerini istatistiksel olarak anlamlı bir bi¸cimde d¨u¸s¨urmektedir. Di˘ger bir bulgu ise, ¸cocukken ¸calı¸smı¸s olanlar ile ¸su anda kayıt-dı¸sı ¸calı¸sıyor olmak arasında istatistiksel olarak anlamlı bir ili¸ski bulu-namamasıdır. Dolayısıyla ¸cocuk i¸s¸cili˘ginin T¨urkiye’deki kayıt-dı¸sı istihdam problemini besledi˘gini s¨oyleyemeyiz. C¸ alı¸smanın son bulgusu ise; ¸cocukken ¸calı¸smı¸s olan erkek-lerin, ¸calı¸smamı¸s erkeklere kıyasla ¨ucretsiz aile i¸s¸cisi olarak ve i¸sveren stat¨us¨unde ¸calı¸sma olasılıkları artmaktadır.
ACKNOWLEDGMENTS
I am thankful for each individual who contributed to my thesis. First of all, my advisor G¨ok¸ce Uysal, paid substantial effort for my thesis. Her advices, knowledge and guidance make this thesis possible. Also, I am thankful to my jury members Cem Ba¸slevent and Selin Serda ¨Ozt¨urk for their valuable comments.
In addition, I am extremely thankful to all members of Bah¸ce¸sehir University Center for Economic and Social Research (Betam). They provided the data for this study and they always encouraged me during my writing process.
On the other hand, I want to thank all members of my family for their support. They always did all they could do. I am grateful to my dad and mom for always refreshing tea in my study table. Although she wasn´t physically near of me, I want to thank my sister for her invaluable encouragements.
In addition, I want to thank my classmates, Bahadıir and Laila. I am grateful to ¨Ozg¨ur and Hande for doing their best. I am thankful to all my friends for their kind attitude during my stressful period. All these people kindly helped me to manage this process.
In sum, I am grateful to my all professors at Istanbul Bilgi University and Bah¸ce¸sehir University. They both directly and indirectly contributed to my knowledge and passion that are crucial for this study.
CONTENTS
1. Introduction . . . 10
2. Literature Review . . . 14
2.1 Adult Outcomes of Child Labor . . . 14
2.2 Child Labor Studies in Turkey . . . 16
3. Methodology . . . 18
3.1 Wage Differences . . . 18
3.2 Informality . . . 19
3.3 Employment Status . . . 21
4. Data . . . 22
4.1 Restrictions in the Data Set . . . 22
4.2 Descriptive Statistics . . . 23 5. Estimation Results . . . 30 5.1 Wage differences . . . 30 5.2 Informality . . . 36 5.3 Employment Status . . . 40 6. Concluding Remarks . . . 44 Appendix 49
LIST OF TABLES
1.1 Distribution of age for the first regular job in Turkey, 2006-2013 . . . 12
4.1 Descriptives . . . 25
4.2 Descriptives (Continued) . . . 26
4.3 Descriptives (Continued) . . . 27
4.4 Descriptives (Continued) . . . 28
5.1 Regression Results for Wage Estimation . . . 33
5.2 Regression Results for Informality . . . 39
5.3 Regression Results for Employment Status . . . 42
.1 Descriptives . . . 50
.2 Descriptives (Continued) . . . 51
.3 Descriptives (Continued) . . . 52
1. INTRODUCTION
Child labor is a serious problem mostly in the underdeveloped and developing countries. Worldwide estimations held in 2012 show that 168 million of children (11 percent of the child population as a whole) are working. Regional distribution indicate that Sub-Saharan Africa (21% of child labor), Latin America and the Caribbean (8.8% of child labor), and the Middle East and North Africa (8.4% of child labor) are the regions which have the highest shares child labor in the world.1 Some of the countries in these regions have been
implementing many policies against child labor, particularly ILO’s legal sanctions, and Turkey is one of them.
The issue of eliminating child labor plays an important role for ending abuse of child rights. In addition, eliminating child labor is vital for countries to progress on their fight against poverty. Hence, Turkey has exhibited remarkable improvement in order to eliminate child labor since 1998.
In 1998, Turkey has legislated a regulation about minimum working age which is set at 15 years of age. Beside this, Turkey has revised some regulations about the working conditions of child laborers focusing on the physical and moral health of children: Turkey allows the children in the ages between 13 and 15 to work if the jobs at which children work are not harmful to the physical and moral health of children. In addition to this restriction, Turkey is determined not to allow children below of the ages 18 years to work in any job which can be expressed as the worst forms of child labor to the children who haven’t turned 18.
The regulations which are mentioned above and other supportive policies such as raising the compulsory education age resulted in impressive progresses against child labor in Turkey. Child labor ratio in the population aged between 6 and 14 years was 8.8 percent in 1994 and child labor ratio declined to 2.6 percent in 2006 2. In the years between
2006 and 2012, child labor ratio over the child population did not decrease. On the other hand, we don’t have a reliable data about child labor in Turkey before the year of 1994 but it is reasonable to assume that child labor in Turkey was more extensive than today. Consequently, child labor is still an alarming problem for Turkey.
1. Introduction 11
of child labor, there exist limited studies interested in the effects of working as a child examining at the micro-level base. Moreover, there is no such a work done for Turkey.
In this study, I am examining the effects of working as a child on adult labor market outcomes. Therefore, the aim is to find out whether there is a significant difference in the labor market outcomes for those who worked as children.
Survey for Income and Living Conditions (SILC) enables to identify the age that the individuals started to their first regular job. I used repeated cross-sectional data of the survey which is conducted in the households during the years between 2006 and 2013. According to the dataset, the age for starting the first job is low in Turkish economy relative to the legal criteria. Overall, 22.2 percent of the individuals in Turkey started to their first regular job before the ages of 15 years (See Table 1.1). Furthermore, 39.3 percent of the individuals had started to their first regular job between the ages of 15 and 18 years. In detail, the first job which is mentioned above does not include temporary jobs or part-time jobs in which individuals worked during the pupillage.
When we consider average educational levels in Turkey, the situation is not much surprising. Indeed, previous findings suggest that there is a negative association between child labor and schooling. Nonetheless, it is important to find out what are the effects of working as a child on adult outcomes. In this way, we can understand the long-term effects of child labor to productivity of individuals in the economy and their welfare.
The studies on the countries where child labor stands a serious problem for the econ-omy are mostly focused on the determinants of child labor. In addition to this subject, some of the researchers interested in child labor investigated long-term effects of working as a child. As we know that working as a child stands as a serious problem in many countries, examining the adult outcomes of having worked as a child laborer is crucial for understanding structural problems in the labor markets. However, there is no such work done in Turkey on this issue.
The labor market outcomes of the adults, which I am interested in this study, are em-ployment status of the individuals in the labor market, wage earnings and their informality. Firstly, I used Mincer earning equation in order to estimate the wage differentials by their child labor status. Secondly, probit estimation method is applied in order to find out that whether there is significantly difference in the likelihood of being informal between the individuals who worked as children and those who didn’t. Finally, I applied multinomial logit estimation to find out relative risk ratios comparing individuals who were child la-borer in the past with non-child lala-borers for working in the employment status relative to wage-earners.
1. Introduction 12 T ab. 1.1: Distribution of age for the first regular job in T urk ey , 2006-2013 Conducted y ear 8-14 y ears 15-18 y ears 19-24 y ears 25-29 y ears +30 y ears T otal 2006 4224 8180 5571 1583 548 20106 21.00% 40.70% 27.70% 7.90% 2.70% 100.0% 2007 4410 8593 5795 1531 602 20931 21.10% 41.10% 27.70% 7.30% 2.90% 100.0% 2008 4709 8940 6271 1561 655 22136 21.30% 40.40% 28.30% 7.10% 3.00% 100.0% 2009 5062 9482 6685 1681 782 23692 21.40% 40.00% 28.20% 7.10% 3.30% 100.0% 2010 5074 9456 7065 1711 854 24160 21.00% 39.10% 29.20% 7.10% 3.50% 100.0% 2011 6699 11719 8615 2133 1081 30247 22.10% 38.70% 28.50% 7.10% 3.60% 100.0% 2012 16436 27838 19800 4594 3034 71702 22.90% 38.80% 27.60% 6.40% 4.20% 100.0% 2013 9704 15697 11133 2624 1822 40980 23.70% 38.30% 27.20% 6.40% 4.40% 100.0% P o oled data 56318 99905 70935 17418 9378 253954 (2006-2013) 22.18% 39.34% 27.93% 6.86% 3.69% 100.0% Sour ce: Surv ey for Income and Living Conditions , T urkStat
1. Introduction 13
It is found that male wage-earners who worked as the child in the past have lower qual-ity of human capital investment than those who never experience labor market conditions during their childhood. The interpretation about the negative effect of child working in the result is not localized in a period, but rather its overall effect. The analysis shows that the detrimental effects of child labor to human capital are stronger.
The analysis among male wage-earners shows that there is no statistical relationship between informally employed in adulthood and having worked as a child in the past when we control for other factors. The results for the choice of employment status indicate that child laborers in the past relative to non-child laborers are most likely to become unpaid family worker, followed by working as an employer.
The rest of this paper is organized as follows: Section 2 discusses the previous findings in the literature and its implications. Section 3 describes the methodology used in present study. Section 4 explains the data which is specified for this study. Section 4 presents the estimation results of this study and its implications. Finally, Section 5 discusses the results of this study.
2. LITERATURE REVIEW
The studying on the causes of child labor is one of the leading topics not only in underdeveloped countries but also in developing countries. Many researchers and policy makers are mostly interested in understanding the causes of child labor for the sake of eliminating child labor worldwide. Therefore, we can find a huge list for addresses on determinants of child labor in the literature.
Another piece of the literature about child labor is that the effects of working as a child to their adult labor market outcomes. Although, the consequences of working as a child to the labor market outcome takes an important part in the understanding the labor market conditions of these countries, the findings are limited. Moreover, this subject has been never examined on Turkey.
In this section, firstly I will give main findings on the adult outcomes of having worked as a child and discuss their contributions in Section 2.1. Secondly, I will summarize the child labor studies based on Turkey although they are only interested in the causes of working as a child. The second section will be useful to understand how households decide on the household labor supply in Turkey.
2.1
Adult Outcomes of Child Labor
Some of the researchers are focused how having worked as a child affecting their sub-sequent labor market conditions. Although all of the studies are done in the developing countries, there is no available study looking at labor market consequences for Turkey.
Emerson and Souza (2007) studied on the effects of working earlier in life to adult earning. The control variable used in this study are age started to work, years of schooling, race, father’s education, mother’s education, region. The study attempts to control the unobserved attributes effective on deciding on schooling and child labor such as ability and motivation. Luckily, historical data on their dataset such as numbers of schools by state and year, number of teachers, GDP data by state and year, population enable to overcome source of endogeneity. The instrumental variables used in the analysis are selected to control for cost of educational investment such as number of school per children
2. Literature Review 15
in individuals’ state in the year that they are 7 (11, and 15) years old. The results from the instrumental variable earning estimation model indicate that child labor has a large negative impact of starting to work due to the trade-off associated with educational attainment. They find that the effect of entering the labor market is negative for young children. However, those negative effect turns positive between 12 and 14 years.
Country-level findings show that participating in child labor market has an impact on adulthood labor market outcomes. For example, Emerson and Souza (2003) study the children in the Brazil aged between the years of 10 and 14 old and examine on the effect of having a child labor parent to the probability of being child labor.
They find that the likelihood to get into labor market as a child increases with having a child labor parent although they control educational levels of both father and mother and other household characteristics. In addition, they find that probability of working as child in the labor market increases if educational attainment of their parents and grandparents are lower. Furthermore, both OLS estimations and Heckman model estimates are showed that working as a child labor in the past has a negative effect on the current earnings even the level of education, age effects and family backgrounds are controlled.
They emphasize that parental child labor history has over and above the effect of family income and parental education. Moreover, their overlapping-generations model in Emerson and Souza (2003) show intergenerational child labor persistence, at least in Brazil.
Many studies looking at the causes of child working put emphasizes on the relationship between educational performance and working in the child labor market. However, the causality was not the main subject in the literature. Beegle et al. (2009) examined on its causality and its implications to subsequent labor market outcomes. In detail, the study for Vietnam of rural areas using Living Standards Survey data for the year of 1992 and 1998, Beegle et al. (2009) , examined how being child labor for those attending educational activities in 1992 affects their labor market outcome in the year of 1998.
Beegle et al. (2009) estimate the consequences of child labor on wage earning, educa-tional attainment, and occupation in the medium-run. They use instrumental variables specification method in order to eliminate potential selection bias (between household se-lection and within-household sese-lection) in the model. One of the advantage of their data set is that it enables to find the variables which are exogenous to the outcomes mentioned above, but affect child labor decision such as rice price, crop shock and their interaction. It is interesting that their results show that participating in child labor market not only makes them more likely to become wage-earner, but also makes them more likely to have higher wages in the medium run. They also point out that the benefits of working as a
2. Literature Review 16
child exceed the detrimental effects of working at these ages. However, they anticipate that net positive effect of being child laborer will disappear over a longer time.
When the effects of child labor are taken in a broad perspective, Wahba et al. (2001) point out that the family decide on their children to work or school by considering dis-counted future benefits and costs of education and work. Wahba et al. (2001) find that the variables controlled in the model have opposite impacts on school choice and work choice. They find that having a mother or father who worked as a child are significant for decision making mechanism on sending their children to school and sending their children out to work. Having parent worked as child in the labor market makes higher incidence of sending their children out to work and lower incidence of sending their children to school. Therefore, they show that families are faced with a trade-off mechanism.
Wahba et al. (2001) conclude that if the households live in a poor state and if the parents were child laborer in the past, the probability of sending their children out to work increases. Accordingly, they find that there is an intergenerational transmission of child labor in Egypt and they argue that it plays an important role on transmission of poverty between generations.
2.2
Child Labor Studies in Turkey
Qualitative and quantitative impacts of child working on schooling are frequently ex-amined for many countries, including Turkey. In the literature for Turkey, determinants of child labor are one of the mostly studied topics for child labor in Turkey. The studies which focus on this subject enable us to understand which one of the children are more likely to be work in their childhood and under which conditions families prompt them to work as a child in the labor market.
Many studies primarily focused on the household dynamics determining the decision of child to work or to educate. For example, Tunalı (1996), Tansel (1998), and Dayıo˘glu (2008) find that the higher the schooling level of parents, the higher is the likelihood that children will attend school. Tunalı(1996) suggests that relative to illiterate parents, literate parents are less likely to engage their children in market work.
Household poverty condition is also another factor affecting supplying the children in households to the labor market. A study for Turkey, Dayıo˘glu (2006), finds that children living in asset poor households stand at a higher risk of being child laborer and school dropout rate for child laborer. She also finds that school dropout rates are especially are much higher for wage-earners.
2. Literature Review 17
during the crisis in order to minimize variations in household income. Parallelly, employ-ment of children are sensitive to paternal wages but not to maternal wages. In addition, Dayıo˘glu (2008) and Dayıo˘glu and Assaad (2003) find that women and children employ-ment are not independent. That is, they find that they are positively correlated such that unobservables increases both the probability of women’s employment and children’s probability of work.
Household decision mechanism in Turkey is still gender-based. Many studies consider and highlight the treat even children in a traditional perspective. For example,Tunalı (1996) shows that probability of finding female children in household work are much more compared to male children and his evidences suggest that educational attainment of mothers has an independent effect more significantly on the employment of children. Ert¨urk and Dayıo˘glu (2004) put emphasize on the decision mechanism for girls’ about working as a child labor either in house works or in market places is different than their male relatives. Traditional gendered division of labor implies that males work outside and females work in households. In other words, girls like adult women (which is not the case for boys and men) may shoulder a double-shift when she works as a child in the labor market which rises to triple shift if she continues to education. In brief, there is no recent study about what is the consequences of working as a child in the labor market to subsequent labor market outcomes for these people.
3. METHODOLOGY
The aim of the study is to find out whether child labor status has a significant effect to adulthood labor market outcomes. It is an important question for Turkey because people who were child laborer in the past constitute 23 percent of the population in Turkey (See Table 1.1). However, there is no evidence on its effects to the labor market in Turkey, yet. In this section, I will explain how having worked as a child affects their adult labor market outcomes such that their wages, their employment status, and their probability of working as an informally employed. The analysis is threefold:
First, I will examine on wage differences between wage-earners due to their child labor market status. Secondly, I will examine on whether having worked as a child-laborer has a significant effect on working informally today. At the end, I will start to analyze the impacts of having worked as a child to the employment status. In this direct, the likelihood to become un-paid family worker, self-employed or employed relative to be wage earners will be calculated.
3.1
Wage Differences
The model which will be analyzed for wage differences between follows Mincer (1996). The model used for wage equation is written in Equation (3.1).
log(Wi) = β0+ β1ChildLaborStatusi+ β2Educationi+ β3Experiencei (3.1)
+β4Experience2i + β5Xi+ β6Y eari+ εi
One of the reason for using this method is that working in the labor market even as a child labor means that people are investing in their human capital. The model enables to control for the educational level and actual years of experience and other factors causing wage differences among individuals.
Generally, we cannot observe the quality of investments to the human capital (edu-cation and labor market experiences). It would be interesting to find that qualitative
3. Methodology 19
effects of their human capital investments. In addition, human capital formation of the children may be different when we consider they had worked during their childhood. In example, children who are investing in their human capital via getting experiences in the labor market may have chance to reduce their negative effect of educational quality to their labor productivity. It is currently uncertain that human capital formation may be advantageous relative to non-child laborers.
Outcome variable denotes log of real hourly wages of the individual i. The earnings come from the survey are regarding the previous year of annual earning. In this way, hourly wages of the individual i come from the survey conducted in the year of t are deflated using the consumer price indices for the time (t-1). 3
Child labor status is included as dummy variable. The vector of Xi indicates the
socio-economic and demographic characteristics of individuals which consists of the variables of age, child labor market status, marital status, region, and non-labor income proxy for socio-economic status of the individual. For capturing the socio-economic differentials among individual, I included non-labor income variable, which is the sum of rental income and interest dividend income and other forms of income excluding social charges, into the analysis.
The literature that emphasizes socio-economic status of the individuals is significant for human capital accumulation. For example, Uysal and Kontar (2012) finds that two persons having same educational level, experiences and similar other conditions of labor market (such as informality) are earning differently if educations of the fathers differentiate. Chen and Feng (2011) explains the effect of paternal education as family connection, which is a hidden human capital quality, increases the wages.
Dayıo˘glu and Tunalı (2003) also controlled for education, experience, region, firm size. Taking administrative responsibility in the workplace may differ earnings, so included. In addition, wage differences between regions and time-variant improvements in Turkey are controlled.
3.2
Informality
This model aims to analyze the likelihood of working informally today if he enters to the labor market as a child laborer. Hence, I used dependent variable for informality status on their current job.
Probit estimation method is applied to find the likelihood of being informal conditional on child labor status while controlling for other variables. The estimation model used for
3. Methodology 20
informality is written in Equation (3.2).
P (Yi = 1|X) = φ(Xiβ) (3.2)
where φ is the cumulative density function of standard normal distribution and Xi = [1, CHILDLABORST AT U Si, EDU Ci, EXPi, EXPi2,
REGIONi, T IM Ei, M AR.ST AT U Si, F IRM SIZEi]
If Y is equal to zero, wage-earner is formally employed. Otherwise, wage earner is informally working. X is the vector of individual characteristics and labor market con-dition. It includes age, education, region, time dummy, year of actual experience in the labor force and its square, marital status, number of employee in the local unit of work-place, and child labor status. I controlled for year differences in informality rate since its rate between 2006 and 2013 sharply decreased. Baslevent and Acar (2015) summarized that informality rate for men working in non-agricultural employment as a wage-earner decreased from 23.0 percent to 16.0 percent from 2006 to 2012.
Gursel and Durmaz (2014) also point out that average firm size is negatively correlated with informal employment.
Although informality varies depending on their current employment status, employ-ment status might be the outcome of child labor status. Furthermore, informality among non-wage earners is a consequence of preference-based decision. The determinants for the informality among wage-earners are much easier to explain. Because, it is mostly affected by the structural problems in labor market: low human capital and high costs of registering and low institutional quality are the main causes of informal employment among wage-earners. Therefore, the analysis of informality in an overall sample would make it much more complicated when we consider both the impacts of child labor status to employment status and frequency of informal employment among self-employed.
Examining on involunteer forms of informality helps us to get unbiased results about which of the individual characteristics increase the likelihood of being informal, especially for household-level micro data sets. As agricultural sector mostly consists of the persons working as an unpaid family worker or self-employed, the persons working as a wage-earner are limited. For these reasons, wage-earners in the agricultural sectors are excluded from the analysis.
3. Methodology 21
3.3
Employment Status
The labor market outcome which I will investigate in terms of child labor status is current employment status of the worker. Therefore, I used the data in a way that it includes un-paid family worker, self-employment, employed, casual worker, and wage-earner. In this study, I assume that individuals in the labor market face 5 mutually exclusive choices:
• Wage-earner (Yi = 0),
• Unpaid family worker (Yi = 1),
• Employer (Yi = 2), • Casual worker (Yi = 3), • Self-employed (Yi = 4). P (Yi = j) = exp(Xβj) 1 +P3 j=1exp(Xβj) (3.3) Employment status of individuals is dependent variable. Base outcome is chosen for wage-earners in order to compare the others to the largest group.
Xi is the vector of the characteristics of the individual i such as child labor status,
education, years of actual experience and its square, age, region, and year dummies. Child labor status, education, years of actual experience and its square, age group, region, and year dummies are included in the multinomial logit estimation model. The model estimated in the multinomial logit estimation is written in Equation(3.3).
4. DATA
The data used for the model is the repeated cross-sectional data generated from the Survey of Income and Living Conditions (SILC) waves 2006 to 2013 conducted by Turkish Statistical Institute (TurkStat).
SILC is a unique dataset which enables us to observe on child labor status of the individual at the national level. In other words, we use the data of SILC because the question about the age for the first regular job is only asked in this survey and it helps to identify which of respondents were the child laborer in the past.
The survey also enables us to differentiate the individuals not only by child labor status but also by current employment status and social welfare in households that they currently lived in.
Pooling the cross-sectional data will also enable us both to increase sample size for the analysis and to control the changes in labor market outcomes over time. The reason of selecting these years is that they are the latest available datasets generated by TurkStat.
4.1
Restrictions in the Data Set
The data that I used in the study have some limitations due to the structure of the data. For example, the way of asking the question to each individual in households about their age are changing in the surveys. Before the wave of 2011, we are not able to capture individuals’ exact year of age. Rather, we are able to get information about the age-group that individuals belong to.
I consequently used age group which is designed for the surveys on and before 2010 in the analysis. In parallel, the form of age variable which following the wave for the year of 2011 are transformed into age groups, which can be seen in Table 4.2
Each wave is separated into the individual and household modules. Individual char-acteristics such as age, gender and educational level for all respondents reside in the households are available without any restriction. However, some part of personal module, which consists of the age for the first regular job, employment status and employment in the last job for non-employed, is only asked to each household member if they are above
4. Data 23
of 14 years old. As a consequence of observing the age at first regular job, we are able to define the individuals who were child laborer and non-child laborer. I define the re-spondent as a child laborer before if they started to their first regular job when they were younger than 15 years old, which is the minimum of working age. In other words, our data enables us to define the people who were child-laborer if their age is above of 14 years old. Since exploring item in this study is potential labor market outcome differences in terms of child labor status, I restricted the data set to who are currently only in the working-age population. Unluckily, if we had available information about exact age of the individual in the survey year, it would be useful to observe who started their first regular job before and after 1998 which is the year that corresponds to the Turkey’s sign on ILO Convention No. 138 about the child labor ban for the ages below 15 years.
Ert¨urk and Dayıo˘glu (2004) and Tunalı (1996) emphasize a gender-based decision mechanism in the household, and therefore including females into the analysis may prob-ably cause a selection bias since female labor force participation rate in Turkey is low and women’s complicated decision process for entering to labor market or schooling (double shift due to traditional gender roles) should be taken into account in the analysis. In order to simplify the analysis, I focus on only male workers. Additionally, non-agricultural em-ployment is taken into the analysis. Because measuring earnings is difficult and informality status is most likely to be preference-based in the in agricultural sector.
4.2
Descriptive Statistics
After all restrictions mentioned above are made, the repeated cross sectional data which is used for wage and informality analysis is summarized in Table 4.1 , Table 4.2, Table 4.3, and Table 4.4.
I would like to point out that the descriptive statistics for the employment status analysis are given in Appendix and I will only describe the summary statistics specified in this section.
Table 4.1, Table 4.2 ,and Table 4.3 present the variables mostly describing the socio-economic status of the individuals in the sample by child labor status. It also provides statistics of the entire sample. In addition, the data used in main analysis consists of the responses of 3,950 individuals in the 2006 survey, 4,005 individuals in 2007, 4,325 individuals in 2008, 4,471 individuals in 2009, 4,498 individuals in 2010, 5,926 individuals in 2011, 7,063 individuals in 2012, and 8,236 individuals in 2013.
The sample includes 36,086 individuals (85.0 percent of the sample) who didn’t work as a child labor and 6,388 individuals (15.0 percent of the sample) who worked as children.
4. Data 24
Table 4.1 indicates that educational level of child laborers are clustered in the primary school. The shares of people who hold more than primary school degree sharply shrink relative to those were not child labor before. It seems that the individuals who were child labor in the past are less-educated.
Exploring the age distributions of workers by their child labor status is an interesting subject. The distribution seems to be so different when only consider the proportions at the same age group. However their sample size are different and the calculations for tests for binomial probability of success results indicate age group distribution are statistically same except for the age groups between 20-24 years and 35-39 years at 90 % of confidence interval. Child labor ban was legalized in the year of 1998 and policy improvements haven’t yet able to be seen in these age group. Therefore, we cannot yet assume that the problem of child labor in Turkey is the problem in dusty pages of history.
Regional distribution of wage-earners who never been child laborer shows that 12.6% of child workers are living in Aegean. 16.5% of wage-earners who were child laborer before are unexpectedly living in Aegean. In addition, 11.9% (9.0%) of wage earners who are child laborer (non-child laborer) are living in Mediterranean region. These regions are relatively developed in many ways and internal migration receiving regions. Migrants who were child laborers before and had limited education opportunities might had moved voluntarily or involuntarily to these regions in order to improve their welfare. The proportions by their child labor status for both Aegean and Mediterranean regions are significantly different.
4. Data 25 T ab. 4.1: Descriptiv es Not w ork ed Had w ork ed Ov erall V ariables Sample Size Its Share Sample Size Its Share Sample Size Its Share Child lab or status 36,086 84.96% 6,388 15.04% 42,474 100.0% Education Non-literate 233 0.65% 79 1.24% 312 0.7% Literate but non-g raduated 622 1.72% 281 4.4% 903 2.1% Primary sc ho ol 8,981 24.89% 3,754 58.77% 12,735 30.0% Secondary Sc ho ol 6,010 16.65% 1,198 18.75% 7,208 17.0% V o catio nal or T ec hnical High Sc ho ol 5,179 14.35% 339 5.31% 5,518 13.0% General High Sc ho ol 5,803 16.08% 373 5.84% 6,176 14.5% Higher Education 9,258 25.66% 364 5.7% 9,622 22.7% Region TR1-Istan bul 5,506 15.26% 1,007 15.76% 6,513 15.3% TR2-W estern Marmara 2,236 6.2% 477 7.47% 2,713 6.4% TR3-Aegean 4,531 12.56% 1,056 16.53% 5,587 13.2% TR4-East Marmara 3,475 9.63% 637 9.97% 4,112 9.7% TR5-W est Anatolia 3,757 10.41% 570 8.92% 4,327 10.2% TR6-Mediterranean 3,262 9.04% 759 11.88% 4,021 9.5% TR7-Cen tral Anatolia 2,409 6.68% 233 3.65% 2,642 6.2% TR8-W est Blac k-Sea 2,400 6.65% 446 6.98% 2,846 6.7% TR9-East Blac k-Sea 1,526 4.23% 147 2.3% 1,673 3.9% TRA-North-East Anatolia 1,920 5.32% 234 3.66% 2,154 5.1% TRB-Cen tral-East Anatolia 2,410 6.68% 275 4.3% 2,685 6.3% TR C-South -East Anatolia 2,654 7.35% 547 8.56% 3,201 7.5%
4. Data 26 T ab. 4.2: Descriptiv es (Con tin ued) Not w ork ed Had w ork ed Ov erall V ariables Sample Size Its Share Sample Size Its Share Sample Size Its Share Y ear 2006 3,370 9.34% 580 9.08% 3,950 9.3% 2007 3,385 9.38% 620 9.71% 4,005 9.4% 2008 3,662 10.15% 663 10.38% 4,325 10.2% 2009 3,786 10.49% 685 10.72% 4,471 10.5% 2010 3,846 10.66% 652 10.21% 4,498 10.6% 2011 5,055 14.01% 871 13.63% 5,926 14.0% 2012 6,028 16.70% 1,035 16.20% 7,063 16.6% 2013 6,954 19.27% 1,282 20.07% 8,236 19.4% Marital Status Single 21,868 60.6% 3,904 61.11% 25,772 33.2% Married 14,218 39.4% 2,484 38.89% 16,702 66.8% Age group 15-19 3,390 3.25% 530 8.3% 1,701 4.0% 20-24 6,284 9.39% 460 7.2% 3,850 9.1% 25-29 6,496 17.41% 1,015 15.89% 7,299 17.2% 30-34 5,746 18.00% 1,105 17.30% 7,601 17.9% 35-39 5,420 15.92% 1,171 18.33% 6,917 16.3% 40-44 4,184 15.02% 930 14.56% 6,350 15.0% 45-49 2,219 11.59% 632 9.89% 4,816 11.3% 50-54 878 6.15% 342 5.35% 2,561 6.0% 55-59 298 2.43% 153 2.4% 1,031 2.4% Age group 60-64 298 0.83% 50 0.78% 348 0.8%
4. Data 27 T ab. 4.3: Descriptiv es (Con tin ued) Not w ork ed Had w ork ed Ov erall V ariables Sample Size Its Share Sample Size Its Share Sample Size Its Share Not w ork ed Had w ork ed Ov erall V ariables Sample Size Its Share Sample Size Its Share Sample Size Its Share Firm Size 10 p er so ns and less 9,993 27.69% 2,468 38.63% 12,461 29.3% Bet w ee n 11 and 1 9 p ersons 4,145 11.49% 780 12.21% 4,925 11.6% Bet w ee n 20 and 4 9 p ersons 5,890 16.32% 943 14.76% 6,833 16.1% 50 p er so ns and more 15,519 43.01% 2,124 33.25% 17,643 41.5% Do not kno w but less than 11 p ersons 173 0.48% 24 0.38% 197 0.5% Do not kno w but more than 10 p ersons 366 1.01% 49 0.77% 415 1.0% Administrativ e Resp onsibilities No 31,569 87.48% 5,882 92.08% 37,451 88.2% Y es 4,517 12.52% 506 7.92% 5,023 11.8% Informalit y No 31,312 86.77% 4,978 77.93% 36,290 85.4% Y es 4,774 13.23% 1,410 22.07% 6,184 14.6%
4. Data 28
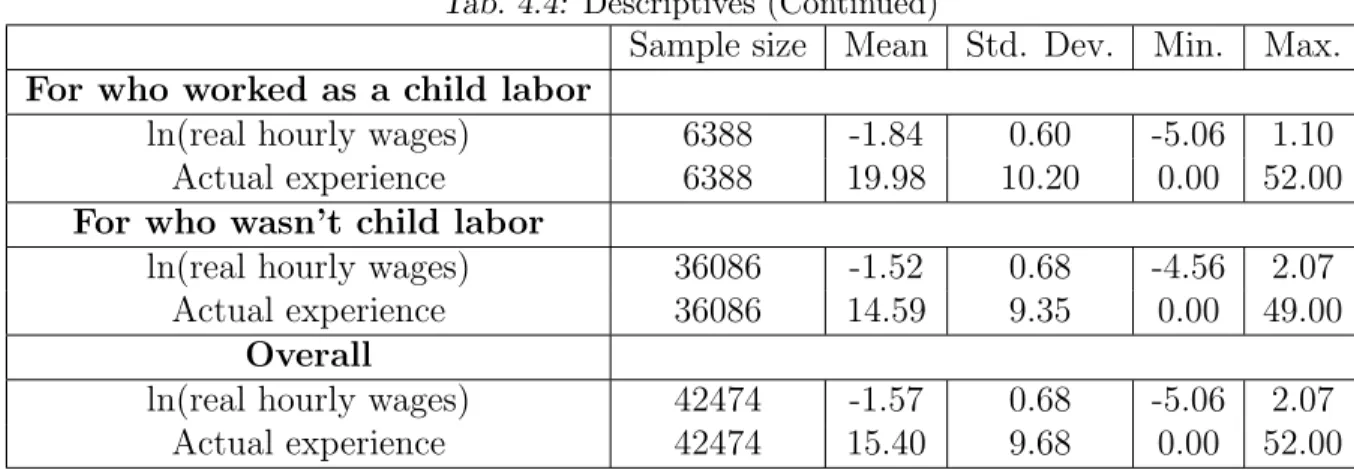
Tab. 4.4: Descriptives (Continued)
Sample size Mean Std. Dev. Min. Max.
For who worked as a child labor
ln(real hourly wages) 6388 -1.84 0.60 -5.06 1.10
Actual experience 6388 19.98 10.20 0.00 52.00
For who wasn’t child labor
ln(real hourly wages) 36086 -1.52 0.68 -4.56 2.07
Actual experience 36086 14.59 9.35 0.00 49.00
Overall
ln(real hourly wages) 42474 -1.57 0.68 -5.06 2.07
Actual experience 42474 15.40 9.68 0.00 52.00
SILC enables observing the informality status of the employees, i.e. whether the em-ployees are registered in the Social Security Institution of Turkey. The results indicate that informality is widespread among those who started their regular job before the age of 15, i.e. 22.1 percent of those who worked in the ages defined as banned by the ILO Convention No. 138. 13.2 percent of those who never engaged in the employment during their childhood are working informally and they will not be able benefit from the social security system. Low level of labor productivity may cause to accept the jobs which are mostly informal and low wages for longer working hours in order to make ends family meets.
In the questionnaire of SILC, it is asked that how many employees are working at the local unit, which indicates firm size in the Table 4.3. The results indicate that 39.6 percent of people who had worked in their childhood now work in the firms with 10 persons and less. Even though, its share for those never experienced child worker is 27.7 percent, the proportions of two samples are significantly different at 99 percent confidence interval and the proportion among who were child labor before is significantly higher than the other at 99 percent confidence interval.
Hourly wages are calculated by using the information of annual income generated in previous year and number of months worked in previous year and the information comes from the question about usual working hour in the main job. After the calculation of hourly earnings for each individual, hourly wages are then deflated by using consumer price indices for these years. Summary statistics for logarithm of hourly wages are represented in Table 4.4. T-test for two sample with unequal variances results show that income at the mean for the people who worked as a child labor in the past are significantly different than those for who never worked as a child labor at 99.9 percent confidence interval.
SILC enables to get actual experience in the workforce rather than calculating esti-mated years of experience. Furthermore, the mean of actual experience for the people
4. Data 29
worked as a child labor is 19.4 years and 13.9 years of experience in the labor market cor-respond for those never worked as a child labor in the labor market (See Table 4.4). The results are as expected since the younger enters to the labor market, the more standing in the labor market.
5. ESTIMATION RESULTS
In this section, I will firstly make an estimation for the link between earnings and human capital accumulation of male wage-earners. Secondly, I will focus on the incidence of informally working among the male wage-earners who worked as a child. Lastly,I will focus on the decision for forms of employment held by males who were child laborer in the past.
5.1
Wage differences
The estimation results estimating the determinants of wages in Turkey are reported in Table 5.1.
For the OLS estimation, the variables of education, age, child labor before, marital status, firm size, region, and year are included as dummy variables. ”Primary school” for educational level, ”age group of 25-29” for ages, ”never worked as a child labor” for child labor status, ”married” for marital status, ”Istanbul” for region, ”firm with employee between 50 persons and more” for firm size, and ”year of 2013” for year are the reference categories for respective variables.
I had included interaction of age with child labor status because there would be an association between the age of the individual and their child labor status even though descriptives give insight on that the age distributions of two groups are symmetrical. The regression results from interaction was insignificant and they are not included as result.
OLS estimation result indicates that working in the past as a child labor results in 3.7 percent decreases in real wages relative to those had never worked as a child laborer. In other words, two persons with same characteristics in the regression model except employment history in terms of working as a child laborer have significantly different real hourly wages. Therefore, we can interpret the results as the quality of human capital investment of a child laborer is lower than a non-child laborer.
5. Estimation Results 31
VARIABLES logrealhourlyincome
Child labor before -0.0371***
(0.00743)
Ages between 15 and 19 -0.293***
(0.0145)
Ages between 20 and 24 -0.0922***
(0.00985)
Ages between 30 and 34 0.0764***
(0.00838)
Ages between 35 and 39 0.137***
(0.0100)
Ages between 40 and 44 0.212***
(0.0118)
Ages between 45 and 49 0.240***
(0.0138)
Ages between 50 and 54 0.210***
(0.0170)
Ages between 55 and 59 0.215***
(0.0224)
Ages between 60 and 64 0.178***
(0.0328)
Non-literate -0.178***
(0.0269)
Literate but not graduated -0.0591***
(0.0164)
Secondary school 0.122***
(0.00750)
Vocational or Technical High School 0.291***
(0.00792)
General High School 0.351***
(0.00769)
Higher education 0.818***
(0.00728)
Actual experience 0.0207***
(0.00126)
5. Estimation Results 32 (3.06e-05) Single -0.0239*** (0.00582) TR2- Western Marmara -0.160*** (0.0107) TR3- Aegean -0.130*** (0.00857) TR4- East Marmara -0.0805*** (0.00938) TR5- West Anatolia -0.0890*** (0.00923) TR6- Mediterranean -0.160*** (0.00942) TR7-Central Anatolia -0.124*** (0.0108) TR8- West Black-Sea -0.148*** (0.0106) TR9- East Black-Sea -0.129*** (0.0129)
TRA- North-East Anatolia -0.0735***
(0.0117)
TRB- Central-East Anatolia -0.173***
(0.0108)
TRC- South -East Anatolia -0.207***
(0.0102)
Employee less than 10 -0.416***
(0.00569)
Employee between 11 and 19 -0.225***
(0.00760)
Employee between 20 and 49 persons -0.134***
(0.00670)
Do not know but less than 11 persons -0.313***
(0.0336)
Do not know but more than 10 persons -0.206***
(0.0233)
5. Estimation Results 33
(0.00751)
Non-labor income 0.00154***
(7.24e-05)
Non-labor income (sq.) -5.59e-07***
(6.93e-08) Year - 2006 -0.101*** (0.00912) Year - 2007 -0.112*** (0.00909) Year - 2008 -0.0503*** (0.00883) Year - 2009 -0.0473*** (0.00872) Year - 2010 -0.0554*** (0.00869) Year - 2011 -0.0343*** (0.00867) Year - 2012 -0.0390*** (0.00829) Constant -1.751*** (0.0132) Observations 42,474 R-squared 0.522 r2 p .
Standard errors in parentheses *** p<0.01, ** p<0.05, * p<0.1
Tab. 5.1: Regression Results for Wage Estimation
We can simplify that there are two cases for child-laborers: In the first case, male child laborers can drop out of the school or never goes to school. In the second case, child laborer can both attend the education and work in the labor market in their leisure time. The results indicate that if the first case is valid for child-laborer, then it seems that the quality of experiences during the child labor does not make their human capital investment better relative to those in the same education level and working for similar
5. Estimation Results 34
years of experience. Moreover, it makes him worse off. If we assume that the second case is valid for another male children, we can conclude that the quality of experiences and the quality of schooling is not enough to make him better off relative to the male students who are not engaged in child labor. However, current working children statistics demonstrates that the child laborer in Turkey is more likely to attend their education while they are working in the labor market, either as a paid or unpaid worker.
Although the medium run effects of engaging in the child labor market are examined in the literature, i.e. Beegle et al. (2009). We are not able to separate its impact to human capital investment. The reason behind this is that we cannot see how many years passed over child labor experiences because we are not available to know individuals’ years of age. Moreover, the interaction of age with child labor status variable is not significant when potential heterogeneity among these variables is considered. To sum up, the interpretation about the negative effect of child working in the result is not localized in a period, but rather its overall effect. The analysis shows that the detrimental effects of child labor to human capital is stronger.
The impact of age to earnings is analyzed by using ages between 25 and 29 years as reference category. The results indicate that for the persons younger (older) than reference category are earning less (more) relative to reference category year.
It is interesting to find that elder people are earning more than young because we may expect that young are more adapted to new technologies and they become more productive as a result of having new skills which is demanded by the market. However, the results of wage determinants for Turkey indicate that aging has a positive effect on wages. A person in the ages between 15 and 19 years earn 29.3 percent lower compared to those in the ages between 25 and 29 years. As the wages are in terms of estimated hourly wages, it is not appropriate to attribute earning differences to working less. Consequently, the results shows that maturity in the labor market is significant for earnings since older workers are figured as more reliable and having better skills than average workers.
The age group of between 45 and 49 years is the maximum age for their earnings. The persons in this age group earn 24.0 percent higher than the persons in the age group of between 25 and 29 years. However, marginal productivity of labor decreases after it maximized. Higher health care costs and lower flexibility in accepting new assignments may be effective on their productivity.
Educational level and income differences relation consist of the core for the produc-tivity differences among individuals. The idea is basic and it implies that the more (less) educated people earn more (less). The results are consistent with the theory.
com-5. Estimation Results 35
pared to primary-school graduated males. Literate but non-graduated males are signif-icantly earning less by 5.9 percent (relative to reference category). Secondary school graduates are significantly earning more by 12.2 percent relative to reference category. Although vocational or technical high school are aimed to grow intermediate members for the labor market and their education targets to give a profession to their students, voca-tional school graduates are earning more by 29.1 percent (compared to reference group) and general high school graduates are earning more by 35.1 percent (relative to reference group). Higher education graduates are significantly earning more by 81.8 percent relative to male primary school graduates.
The result shows that the effects of years of experience on income is increasing as actual years of experience increases. However, the gain due to one unit of increasing in the actual years of experience has a decreasing rate. The maximum level of earning can be achieved in 46.3 years of experience.
Another result of the study is that male married workers are earning more by 2.4 percent. The reason behind that may be specialization within household. In other words, as men are defined to take roles on working outside and women are defined to work inside of household and busy with household chores, married male workers can center their job on their life without loss of concentration due to household responsibilities. Therefore, it is seen that productivity differences by marital status is significant for the labor market in Turkey.
Wage differences between regions are significant in Turkey. Earnings in Istanbul region are significantly higher than other regions in Turkey. Although educational level, years of experience and some firm related factors are controlled, wage disparities between regions are seen in Turkey.
The number of employee in the local unit of enterprise is also important in explaining wage differences. For example, male workers in the firm with less than 10 employees are earning less by 41.9 percent relative to the workers working more than 50 employees in the local unit. Male workers in a firm with an employee between 10 and 49 earn less by 13.3 percent relative to male workers in the reference group. As the number of employees that a workers integrate increases, a worker in the workplace can specialize in their job and it helps workers to increase their productivity.
Lastly, the results indicate that people taking administrative responsibilities in the workplace significantly earn more by 22.2 percent relative to other workers not taking administrative responsibilities.
As explained in model section, I used non labor income variable as proxy variable for socio-economic status. The results indicate that socio-economic conditions of the
5. Estimation Results 36
individual is significant for generating income.
According to the analysis, there exist wage differences between years. It seems that real wages earned by men in Turkey have substantially increased in 2007 and smooth increase in real wages later than 2008 has been observed in Turkey.
5.2
Informality
Probit estimation results depicted in Table 5.2 enables us to find the persons who are under the risk of being informal employment status. In addition, calculated average marginal effects are given in the second column in Table 5.2.
As child laborers are mostly working informally as a result of their forms of employment and their low reservation wage, it is then important to ask that whether working as a child makes the probability of working informally increase or not? The results indicate that there is no statistical relationship between working informal and working child laborer in the past when we control for other factors that may affect informality. Therefore, we cannot say that working child laborer in the past is a cause of informality in wage employment. A male who was child laborer in the past have similar probability of working in as formal as informal employment status compared to their relatives.
5. Estimation Results 37
PROBIT AME
Informal Informal
Child labor before 0.00293 0.0004988
(0.0240) (0.0040831)
Ages between 15 and 19 1.158*** 0.1970448***
(0.0423) 0.007014)
Ages between 20 and 24 0.391*** 0.0664671***
(0.0324) (0.0054963)
Ages between 30 and 34 -0.0966*** -0.0164405***
(0.0331) (0.0056362)
Ages between 35 and 39 -0.0706* -0.0120123*
(0.0379) (0.0064575)
Ages between 40 and 44 -0.149*** -0.0254379***
(0.0442) (0.0075235)
Ages between 45 and 49 0.184*** 0.0312468***
(0.0494) (0.0083985)
Ages between 50 and 54 0.659*** 0.1121912***
(0.0579) (0.00982)
Ages between 55 and 59 0.862*** 0.1466305***
(0.0723) (0. 0122543)
Ages between 60 and 64 0.923*** 0.1569993***
(0.103) (0.0174434)
Non-literate 0.562*** 0.0955808***
(0.0750) (0.0127428)
Literate but not graduated 0.315*** 0.0536448***
(0.0448) (0.0076097)
Secondary school -0.173*** -0.0294233***
(0.0244) (0.0041446)
Vocational or Technical High School -0.451*** -0.0766714***
(0.0282) (0.0047631)
General High School -0.551*** -0.0937864***
(0.0293) (0.0049489)
Higher education -0.938*** -0.1595965***
(0.0319) (0.0053321)
Actual experience -0.0175*** -0.0029855***
5. Estimation Results 38
Square of actual experience 0.000630*** 0.0001072***
(9.88e-05) (0.0000168)
Single 0.0743*** 0.0126457***
(0.0191) (0.0032505)
Employee less than 10 1.432*** 0.2436403***
(0.0225) (0.0034672)
Employee between 11 and 19 0.793*** 0.1349293***
(0.0290) (0.0048849)
Employee between 20 and 49 persons 0.428*** 0.0728633***
(0.0297) (0.0050476)
Do not know but less than 11 persons 0.941*** 0.160204***
(0.0974) (0.0165555)
Do not know but more than 10 persons 0.815*** 0.1387697***
(0.0749) (0.0127215) TR2- Western Marmara -0.125*** -0.0211881*** (0.0405) (0.0068841) TR3- Aegean -0.208*** -0.0353438*** (0.0317) (0.0053841) TR4- East Marmara -0.138*** -0.023495*** (0.0348) (0.0059174) TR5- West Anatolia -0.135*** -0.023052 (0.0346) (0.0058918) TR6- Mediterranean 0.0396 0.0067372 (0.0331) (0.0056282) TR7-Central Anatolia -0.0210 -0.0035754 (0.0392) (0.0066671) TR8- West Black-Sea -0.115*** -0.0196049*** (0.0389) (0.0066265) TR9- East Black-Sea -0.181*** -0.0308659*** (0.0478) (0.0081269)
TRA- North-East Anatolia 0.134*** 0.0228585***
(0.0410) (0.0069823)
TRB- Central-East Anatolia 0.540*** 0.091888***
(0.0345) (0.0058341)
TRC- South -East Anatolia 0.499*** 0.0848736***
5. Estimation Results 39 Year-2006 0.628*** 0.1068897*** (0.0321) (0.0054055) Year-2007 0.479*** 0.0814485*** (0.0324) (0.0054733) Year-2008 0.270*** 0.0459278*** (0.0327) (0.0055545) Year-2009 0.347*** 0.059021*** (0.0317) (0.0053721) Year-2010 0.307*** 0.0523166*** (0.0321) (0.0054481) Year-2011 0.150*** 0.0255495*** (0.0311) (0.0052952) Year-2012 0.0497 0.0084637 (0.0303) (0.0051532) Constant -1.960*** (0.0503) Observations 48,609 48,609 r2 p 0.324 0.324
Standard errors in parentheses *** p<0.01, ** p<0.05, * p<0.1 Tab. 5.2: Regression Results for Informality
The impact of age on the likelihood of informality is expected. As age increases, workers’ human capital improves and their probability to get into formal jobs increases. Average marginal effect results indicate that a person aged between 15 and 19 years is more likely to work in an informal job relative to reference group (ages between 25 between 29 years).
Average marginal effect of the age between 15 and 19 is the highest among other age groups. We can conclude that early labor market experiences has higher likelihood for get into informal job rather than employment history. Moreover, it seems that the likelihood of working informally increases for those elder than 45 years old because of early-retirement in Turkey.
Probit estimation results show that low educational levels increases the likelihood of working informally. Both higher level of education and higher year of experiences in the labor market makes the likelihood of working informally higher.
5. Estimation Results 40
of specialization within households may affect labor performance. In addition, the laws in Turkey are designed as a married women to be socially secured if her husband is working even she does not work in the labor market. Therefore, married men and their family may give more importance to formality in a job.
Another factor which is related with informality rate is the firm size of the enterprise. Gursel and Durmaz (2014) point out that firm size is a strong proxy for differentiate labor productivities of individuals. The results indicate that low levels of employees working in the local unit increases the probability of working in an informal job. Average marginal effect of working in a local unit with less than 10 employees increases the likelihood of working informally by 24.4 percent relative to reference group (working in a workplace with more than 50 employees).
The OLS estimation on wages had showed that there were a significant differences among regions in Turkey. In addition, probit analysis also shows that regional disparities are seen in terms of formality.
People live in more developed regions are less likely to be informal (i.e. Istanbul re-gion) and people in less developed regions are more likely to get into informal jobs (i.e. South East Anatolia). Even we control for educational level and other labor productivity differences, we find large disparities in informality. Weaker rules of law and lower insti-tutional qualities may be effective on differentiation between regions. As expected, year differences in informality is significant. The results capture the significant decreasing rate for informality in these years.
5.3
Employment Status
Relative risk ratio results of the multinomial estimation model are depicted in Table 5.3. The results of the relative risk ratios are summarized in a way that base group of the dependent variable is working as a wage-earner. I will only summarize relative risk ratios comparing people who were child laborer in the past with non-child laborers for working in the employment status except wage-earners relative to wage-earners.
The results for the choice of employment status indicate that child laborers in the past are most likely to become unpaid family worker. For those having worked as a child relative to other, the relative risk for being in unpaid family worker relative to wage-earner would be expected to increase by a factor of 1.40 given the other variables in the model are held constant.
5. Estimation Results 41 Unpaid F amily W ork er Casual W ork er Self-Emplo y ed Emplo y er Child lab or b efore 1.400*** 0.905*** 1.086*** 1.275*** (0.083) (0.0 31) (0.034) (0.060 ) Ages b et w een 20 and 24 0.619*** 0.609*** 2.079*** 5.772*** (0.045) (0.0 34) (0.232) (1.908 ) Ages b et w een 25 and 29 0.323*** 0.467*** 3.677*** 11.01 9*** (0.031) (0.0 29) (0.400) (3.579 ) Ages b et w een 30 and 34 0.134*** 0.457*** 4.281*** 14.04 5*** (0.017) (0.0 33) (0.488) (4.614 ) Ages b et w een 35 and 39 0.061*** 0.434*** 4.585*** 12.82 7*** (0.010) (0.0 36) (0.548) (4.281 ) Ages b et w een 40 and 44 0.041*** 0.374*** 4.089*** 10.22 6*** (0.008) (0.0 34) (0.509) (3.462 ) Ages b et w een 45 and 49 0.046*** 0.406*** 4.567*** 8.967*** (0.010) (0.0 40) (0.589) (3.078 ) Ages b et w een 50 and 54 0.102*** 0.489*** 5.660*** 9.365*** (0.023) (0.0 53) (0.759) (3.263 ) Ages b et w een 55 and 59 0.203*** 0.506*** 8.227*** 12.81 3*** (0.052) (0.0 63) (1.158) (4.545 ) Ages b et w een 60 and 64 0.376*** 0.545*** 9.085*** 16.88 0*** (0.113) (0.0 86) (1.425) (6.191 ) Not literate 1.2 73 2.272*** 1.475*** 0.427*** (0.244) (0.1 79) (0.121 ) (0.107 ) Literate but non -graduated 1.054 1.5 44*** 1.186*** 0.787* (0.113) (0.0 81) (0.069) (0.100 )
5. Estimation Results 42 Secondary sc ho ol 0.869** 0.509*** 0.708*** 1.257*** (0.060) (0.0 19) (0.024) (0.063 ) V o catio nal or T ec hnical High Sc ho ol 1.020 0.258*** 0.593*** 1.560 *** (0.075) (0.0 12) (0.022) (0.080 ) General High Sc ho ol 0.484*** 0.173*** 0.408 *** 1.040 (0.041) (0.0 10) (0.017) (0.058 ) Higher education 0.290*** 0.029*** 0.170*** 1.122** (0.029) (0.0 03) (0.008) (0.053 ) Actual exp erience 1.005 0.972*** 0.998 1.052*** (0.011) (0.0 06) (0.006) (0.009 ) Squared actual exp erienc e 1.000 1.001*** 1.001*** 1.000 (0.000) (0.0 00) (0.000) (0.000 ) Single 1.452*** 0.986 0.977 0.89 7** (0.071) ( 0.029) (0.035) (0.047 ) Constan t 0.116*** 0.658*** 0.042*** 0.002*** (0.015) (0.0 47) (0.005) (0.001 ) Regional differences are con tr olled Y ear effect is con trolled Observ ation 76,780 Pseudo R-square 0.13 7 Standard errors in paren th eses *** p < 0.01, ** p < 0.05, * p < 0.1 T ab. 5.3: Regression Results for Emplo ymen t Sta tus
5. Estimation Results 43
The result is acceptable because in Turkey, more than half of the child workers are working on the jobs as an un-paid family worker for making contribution to the family income. Therefore, the result supports that working in the labor market on their same their employment status is more likely for the child laborers.
For those having worked as a child relative to non-child laborer, the relative risk for being in employer relative to wage-earner would be expected to be 27.5 percent higher given the other variables in the model are held constant.
The interpretation of this result is relatively similar with those comparing working as a family worker: The child laborers, which we are interested in males, mostly work in the family farms or enterprises in Turkey. They work in these jobs without getting any gain. It seems that they take over the portfolio of the management in family businesses when males come into power or family members believe that they are mature enough to control the organization.
Another implication of the result is that the relative risk for choosing self-employed relative to be a salaried worker or wage earner for those who were child laborer in the past relative to were not is not statistically significant. Finally, the relative risk for choosing to be a casual worker relative to be salaried-wage earner is 9.5 percent lower for those who were child laborer in the past relative to were.
The overall implication of the analysis for choosing employment status comparing those who had worked as a child with those never entered to the labor market as a child emphasise that working as a child is significant on choosing the type of employment. Many participants in the labor market who worked during their childhood are more likely to continue or to choose to work as an un-paid family when they become an adult. The second possible choice for male participants in the labor market who were child laborer in the past is that choosing to become an employer in the labor market.
6. CONCLUDING REMARKS
Some of the children in Turkey start to work at the workplaces in order to contribute their family income. Low levels of household income mostly cause children to work. The adult labor market outcomes of male child laborer was the subject of this study. The model is designed with the aim of finding whether there is an effects of child labor to adulthood labor market outcomes such as employment status, wages, and informality.
The decision for the children to work or not is found that it is crucial for their future outcomes. They working conditions are not the determined by their child labor status, however working as a child or not makes changes in their earnings and affects their likeli-hood to choose the type of employment.
This study contributes that working in the past as a child labor results in 3.7 percent decreases in real wages relative to those had never worked as a child laborer. People who worked as the child in the past have lower quality of human capital investment than non-child laborer, through either educational channel or experiences gained in the labor market relative to those in the same education level and working for similar years of experience.
Another discussion of this paper is to contribute the effects of earlier experiences in the labor market during childhood to become informally employed. The analysis among male wage-earners shows that there is no statistical relationship between working informal and working child laborer in the past when we control for other factors that may affect informality. Therefore, we cannot say that working child laborer in the past is a reason of informality in wage employment for Turkey.
In Turkey, more than half of the child workers are today working on the jobs as an un-paid family worker for making contribution to the family income. In its parallel, the relative risk of working as un-paid family worker relative to working as a wage-earner conditional on having worked as a child is the highest and relative risk of working as an employer is following. It seems that they take responsibility in the family businesses when family elders believe that the person who were child laborer is mature enough to control the organization.
The results prove that eliminating child labor is one of the core subject for ending poverty. In order to increase social income mobility, the policies and incentives maintaining
6. Concluding Remarks 45
discipline for ending child labor should be developed.
For further studies, not only males but also females can be subject of the study. How-ever, the data is not good enough to evaluate which conditions of the children directed them to work. As historical data is not available and the properties of hometown during their childhood is not accessible, it will be needed to generate data until another survey enables to identify the child labor status.
NOTES 46
Notes
1“Marking progress against child labour - Global estimates and trends 2000-2012” International Labour
Office, International Programme on the Elimination of Child Labor (IPEC) - Geneva: ILO, 2013.
2For further information, check Turkish Statistical Institute, Child Labor Statistics
3The source of annual consumer price indices is OECD (2015), Inflation (CPI) (indicator). doi:
BIBLIOGRAPHY
Baslevent, C. and A. Acar (2015). Recent trends in informal employment in turkey. Yildiz Social Science Review 1 (1).
Beegle, K., R. Dehejia, and R. Gatti (2009). Why Should We Care About Child Labor?: The Education, Labor Market, and Health Consequences of Child Labor. Journal of Human Resources 44 (4).
Chen, Y. and S. Feng (2011). Parental education and wages: Evidence from china. Fron-tiers of Economics in China 6 (4), 568–591.
Cilasun, S. M. and M. G. Kırdar (2012). Household structure, and household income and its components over the life-cycle in turkey. Technical report, Discussion Paper, Turkish Economic Association.
Dayıo˘glu, M. (2006). The impact of household income on child labour in urban turkey. Journal of Development Studies 42 (6), 939–956.
Dayıo˘glu, M. (2008). Mother’s and children’s employment in turkey. The Journal of Developing Areas 42 (1), 95–115.
Dayıo˘glu, M. and R. Assaad (2003, January). The Determinants of Child Labor in Urban Turkey. Working Papers 0302, Economic Research Forum.
Dayıo˘glu, M. and ˙I. Tunalı (2003). Falling behind while catching up: Changes in the female-male wage differential in urban turkey, 1988 to 1994. In Annual Meeting of the Population Association of America.
Emerson, P. and A. Souza (2007). Is child labor harmful? the impact of working earlier in life on adult earnings. IZA Discussion Papers 3027, Institute for the Study of Labor (IZA).
Emerson, P. M. and A. P. Souza (2003). Is there a child labor trap? intergenerational persistence of child labor in brazil. Economic development and cultural change 51 (2), 375–398.
BIBLIOGRAPHY 48
Ert¨urk, Y. and M. Dayıo˘glu (2004). Gender, education and child labour in turkey. Inter-national Labor Organization (ILO) (170).
Gursel, S. and M. Durmaz (2014, September). Economic conjecture and trend in informal employment. 14/173.
Mincer, J. (1996). Changes in wage inequality, 1970-1990. Technical report, National Bureau of Economic Research.
Psacharopoulos, G. (1997). Child labor versus educational attainment: Some evidence from latin america. Journal of population economics 10 (4), 377–386.
Tansel, A. (1998). Determinants of school attainment of boys and girls in turkey. Economic Growth Center Discussion Paper (789).
Tansel, A. (1999). Formal versus informal sector choice of wage earners and their wages in turkey. In Economic Research Forum Working Paper, Number 9927.
Tunalı, ı. (1996, December). Education and Work Experiences of 6-14 Year-Old Children in Turkey. Working Papers 9638, Economic Research Forum.
Uysal, G. and M. Kontar (2012, February). Father’s education affects child’s wages. 12/128.
Wahba, J. et al. (2001). Child labor and poverty transmission: No room for dreams. In Economic Research Forum Working Papers, Number 0108.
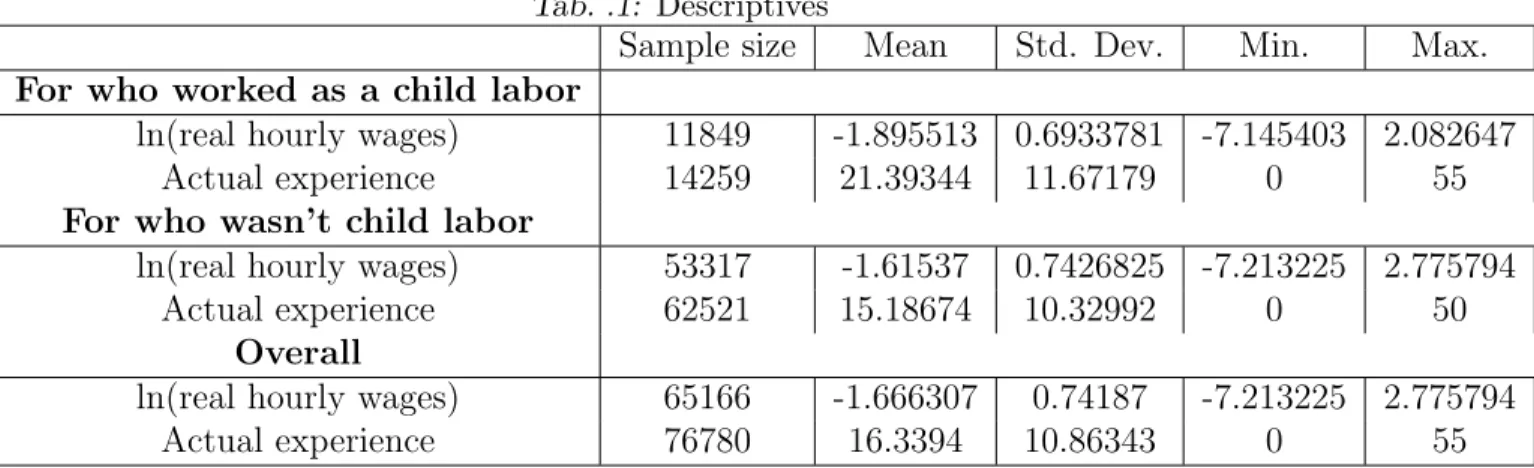
Appendix 50
Tab. .1: Descriptives
Sample size Mean Std. Dev. Min. Max.
For who worked as a child labor
ln(real hourly wages) 11849 -1.895513 0.6933781 -7.145403 2.082647
Actual experience 14259 21.39344 11.67179 0 55
For who wasn’t child labor
ln(real hourly wages) 53317 -1.61537 0.7426825 -7.213225 2.775794
Actual experience 62521 15.18674 10.32992 0 50
Overall
ln(real hourly wages) 65166 -1.666307 0.74187 -7.213225 2.775794