Procedia - Social and Behavioral Sciences 207 ( 2015 ) 98 – 110
1877-0428 © 2015 The Authors. Published by Elsevier Ltd. This is an open access article under the CC BY-NC-ND license (http://creativecommons.org/licenses/by-nc-nd/4.0/).
Peer-review under responsibility of the International Strategic Management Conference doi: 10.1016/j.sbspro.2015.10.155
ScienceDirect
11th International Strategic Management Conference 2015
Ultimate Point in the Service Provided by the Banks to Their
Customers: Customer Satisfaction in the Common Use of ATMs
Sefer Gümüş
a, Sudi Apak
a, Tuğbay Burçin Gümüş
a, Hande Gülnihal Gümüş
ab, Serpil
Gümüş
aaBeykent University, İstanbul, 34396, Turkey
bŞişli Vocational High School, İstanbul, 34394, Turkey
Abstract
As is the case with the other sectors, intensive competition is experienced in the banking sector as well. In order to keep position in this sector, it is required to find new customers or duly satisfy the already existing customers. To this effect, banks are compelled to introduce diverse services to their customers. One of the most important services is Automatic Teller Machines (ATM) generated from the combination of technology and electronics and which enable customers to draw as well as deposit money through the ATMs without visiting banks in all occasions. Customers are entitled to check their accounts and provide for transfer of funds. In our study, ATM users are asked the questions prepared in relation to customer satisfaction and the answers received are processed through SPSS 17.0 statistical software programs, factor analyses of the same are made, their reliabilities are tested, and according to the data for the year 2014, 550 individuals are accessed from amongst 60.000 ATM users through random sampling method and five banks are examined. The results of the study demonstrates that bank customers are very much satisfied with the ATMs about which exists little information and research.
© 2015 Published by Elsevier Ltd. Selection.
Peer-review under responsibility of the International Strategic Management Conference Keywords: Technology, ATM, Electronic banking, Distribution channels
1. Introduction
Fierce competition is experienced in the banking sector. In order to achieve the desired aims, banks are required to find new customers or duly satisfy the already existing customers. To this effect, they are compelled to introduce diverse services to their customers. One of the most important of these services is Automatic Teller Machines (ATM) generated from the combination of technology and electronics and which enable customers to draw as well as deposit money without visiting banks in all occasions. Customers are entitled to check their accounts and provide for transfer
Corresponding author. Tel. + 90-533-436-7258 fax. +90-212-867-5066 Email address: [email protected]
© 2015 The Authors. Published by Elsevier Ltd. This is an open access article under the CC BY-NC-ND license (http://creativecommons.org/licenses/by-nc-nd/4.0/).
of funds. Accordingly, the present study investigates customer satisfaction in the context of ATMs about which exists little information and research.
2. Literature Review
2.1. Banking and Common Money Payment Machines (ATM)
In the early years of the Turkish Republic, Türkiye İş Bankası (1924), Sınai ve Maadin Bankası (Industrial and Mines Bank) (1925) and Emlak Bankası (Emlak Bank) (1927) were established. In the 1960s, investment and development banks were founded within the framework of Five-Year Plans. In 1960, Turizm Bankası (Tourism Bank) was established, in 1963 Sınaî Yatırım ve Kredi Bankası (Industrial Investment and Credit Bank), in 1964 Devlet Yatırım Bankası (State Investment Bank), and in 1976 Devlet Sanayi ve İşçi Yatırım Bankası (State Industry and Labor Investment Bank) were established. It is a well-known fact that finance sector is one of the sectors most influenced by the rapid advances in technology. Implementation of electronic banking is on one hand accelerating the banking transactions, and on the other hand enabling transaction volumes and market shares of banks appearing before their customers with brand new services (Avşar, 2005: 52).
Automated Cash Dispensers/CDs which were started to be used in the 1960s were in the form of money dispensers providing a specific amount of cash. Automated Teller Machines/ATMs developing in parallel to technological advances at present provide, besides drawing cash, several other functions such as depositing money to the account, making transfers between accounts, giving information to their customers about their account status, realizing regular payments, asking for check books, accepting and approving loan applications.
In parallel to the use of credit cards on ATMs, loan allowance is also provided (with high rates of interest) by banks. Moreover, in Turkey every bank makes use of the banking infrastructure either individually or in small confined groups. They continue to serve their customers by installing more than one ATM at any particular point, saving resources substantially.
2.2. Cover and Use of Electronic Card
Individuals failing to use cash in a careful and diligent manner, and the wear and tear as well as the adverse influences created on health thereby have currently guided people to card-aided payment systems. Such cards made of plastic, used for purchasing goods and services, given to the individuals by banks or any other institutions are referred to as plastic Money or plastic card. On the back sides of these cards there is a magnetic strip generally containing several data and particulars. Plastic money is a misuse of phrase. Credit cards offer the card holder a specific credit limit for the period till the reimbursement of the money back to the bank. Similarly, ATMs are converting the bank deposits into cash by means of regular signals transmitted from the magnetic field of the plastic card. Plastic does not represent any value on its own, but its function is of particular essence (Yılmaz, 2002: 9).
Smart card is an integrated mobile entity keeping data and processing such data, in other words a sophisticated version of standard memory/chip cards. These cards incorporating microprocessors encompass a wide variety of use in several sectors ranging mainly from telecommunication (as SIM cards on cellular phones) and transportation, thanks to their embedded calculation capacity, ensuring mobile security and convenience for use. In standard memory-chip card systems (for instance, magnetic cards), data processing hardware and software read the information on the card, making calculations and re-writing data back onto the card. However, smart cards include a microprocessor in addition to the memory and thus necessary calculations are allowed to be made through this microprocessor. In other words, smart cards are cards with computers installed onto them (Kardaş, 2003: 29).
2.3. Customer Satisfaction
Today, customer satisfaction has become one of the busiest segments of marketing. In parallel to the social communities reserving money for consumption in a very serious manner, it has been commenced with conducting research on the concept of customer satisfaction. A major part of the changes in the field of marketing have directed business enterprises towards the application of such concepts such as customer value, customer compatibility, customer communication, further to and besides conventional marketing mix. “Customer focused marketing
approach” and “customer satisfaction” are the most frequently used concepts in the recent years by those involved with marketing discipline.
3. Purpose And Method Of The Survey
The purpose of this survey is to determine the difference between the service quality expected by the customers commonly using ATM and the perceived service quality. By referring to the level of any such difference, this study aims to examine customer satisfaction. There is a difference between the service quality expected and perceived by the user who commonly use ATM.
4. Importance Of The Survey
ATM machines used by the banks critically reduce the personnel requirements. Identifying the level of satisfaction in respect to the service provided by technologically programmed ATM machines is of the essence.
When the related literature is examined, it is detected that there is limited research on the measurement of the satisfaction level of ATM users. Due to the lack of any previous surveys made in relation to the subject matter, this research will contribute to the literature.
5. Research Model
The research is conducted on a screening model. Screening model is a research approach targeting to visualize any past or current condition in its present form and status. Any individual or object which is the subject matter of the present research is attempted to be identified within its own conditions.
The essential point is to “observe” it in a convenient manner and duly specifically (Karasar, 2009: 77). The model of the research is seen in Figure 1 (Karasar, 2009: 79). By means of the questionnaire it is tried to review the difference between the expected service quality and the perceived service quality of common ATMs and thus determine the satisfaction level of ATM users.
Fig 1. Research Model with Respect to the Satisfaction Level of Users Who Commonly Use ATM
5.1. Sampling Universe
The universe of the research consists of common ATM users in Üsküdar, on Istanbul’s Anatolian Side. The estimated number of common ATM users of X Bank in Üsküdar is 60.000 according to the 2014 data. The sample consists of 550 individuals from the customers of 5 different X Bank branches. In setting forth the size of the sample to represent the subject matter universe,
PERCEIVED
SERVICE
QUALITY
EXPECTED
SERVICE
QUALITY
DEMOGRAPHIC
CHARACTERISTICS
n=Nt2pq/d2 (N-l) + t2pq (Salant and Dillman, 1994: 55) N: The number of individuals in the target population n: The number of individuals to be included in the sample
p: The occurrence frequency of the event surveyed (occurrence probability)
q: The non-occurrence frequency of the event surveyed (non-occurrence probability) t: The theoretical value found at a specific level of specificity according to table t d: ± sampling fault assumed in accordance with the occurrence frequency of the incident.
By using the formula, for the aforesaid universe which is not of a homogeneous structure, at a reliability range of 95% and a sampling error of ± 10%, the required sample size is calculated as n = 96.
5.2. Data Collection Tool
In the survey, questionnaire is used as data collection tool. In the questionnaire, together with demographical questions, servqual scale is used in order to measure the perceived and the expected service quality.
Servqual Scale: Pasaruman and colleagues worked on the measurement of service quality and customer satisfaction and developed Servqual method, the most widely distributed method with proven validity and reliability (Pasaruman, Zeithaml and Berry, 1990: 47).
Factor Structure: Common ATM is equipped with a modern looking hardware. The buildings and facilities around common ATMs are attractive. The employees dealing with the common ATM are well-groomed. The materials used related to the service given with respect to the common ATM look visually attractive.
Reliability: The bank management to which the common ATM is affiliated to, duly realizes its promises in a timely manner. Whenever any customer encounters any problem, common ATM bank management as well as the employees closely attend to solve that problem. The bank providing common ATM service makes such services available in an accurate manner as soon as they are informed. Common ATM bank provides the service within the promised period of time. Common ATM bank and employees are very keen on keeping of the records and data accurately.
Eagerness: The employees in the bank of the common ATM tell their customers the definite time when the service would be provided. Common ATM employees provide their customers with fast service; they are always eager and willing to provide assistance to their customers. They never hesitate to answer the customer requests.
Trust: The attitude and the approach of common ATM employees build up a feeling of trust in the customers. Common ATM employees treat their customers courteously at all times. Employees at the bank of common ATM are equipped with know-how enabling them to duly respond to the questions of their customers.
Sensitivity: Common ATM employees deal individually with each and every customer one by one. Operating hours of the common ATMs are adjusted and arranged so as to help all customers. Common ATM bank is in possession of an employee who would be dealing individually with each of the customers. Common ATM bank keeps the interest of its customers above everything else. Common ATM employees duly understand any special requests of the customer.
Servqual: With the approach of Servqual, service quality and customer satisfaction assessment is based on calculating the difference between the point scores given by the customers to the “expectation-perception” phrase pairs. Over the factors obtained in these circumstances, SERVOUAL score is calculated as follows (Pasaruman, 1991: 420).
Servqual Score = Perception Score – Expectation Score
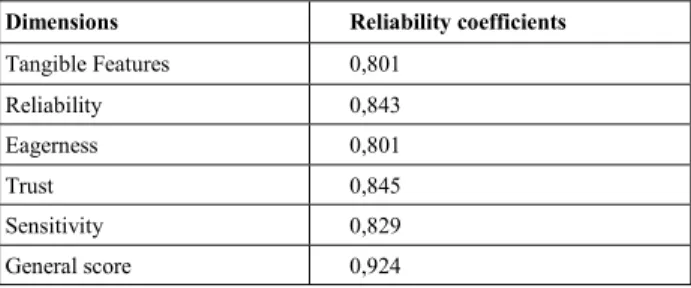
Table 1. Reliability of Scale
Dimensions Reliability coefficients
Tangible Features 0,801 Reliability 0,843 Eagerness 0,801 Trust 0,845 Sensitivity 0,829 General score 0,924
5.3. Statistical Analysis of Data
While evaluating the findings derived in the study, the SPSS (Statistical Package for Social Sciences) for Windows 17.0 software is used for the statistical analyses. While assessing the survey data, identifying statistical methods (Number, Percentage, Median, Standard Deviation) are used. To test the hypothesis, matched t-test analyses are conducted.
6. Findings
6.1. Findings with Respect to the Demographic Characteristics of the Sample Group
Table 2. Gender Distribution of the Sample Group
Frequency User Percentage (%)
Female 51 49%
Male 53 51%
Total 104 100%
Distribution of the sample according to gender is displayed in Table 2. Accordingly, it is seen that out of the common ATM users participating in the survey, 51 (49,0%) are female users and 53 (51,0%) are male users.
Fig 2. Distribution of the Sample Group According to Gender
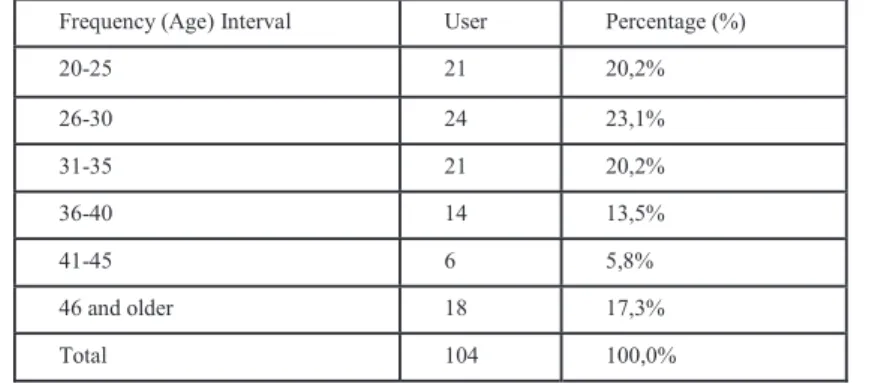
Fig 2. Distribution of the Sample Group According to Gender Table 3. Distribution of the Sample Group According to Age Groups
Frequency (Age) Interval User Percentage (%)
20-25 21 20,2% 26-30 24 23,1% 31-35 21 20,2% 36-40 14 13,5% 41-45 6 5,8% 46 and older 18 17,3% Total 104 100,0%
Distribution of the sample group according to the age groups is displayed in Table 3. Accordingly, of the common ATM users participating in the survey, 21 (20,2%) users are in the age group of 20-25, 24 (23,1%) users are in the age
group of 26-30, 21 (20,2%) users are in the age group of 31-35, 14 (13,5%) users are in the age group of 36-40, 6 (5,8%) users are in the age group of 41-45 and 18 (17,3%) are in the age group of 46 and over.
Table 4. Distribution of the Sample Group According to Educational Status
Frequency User Percentage (%)
High School and below 29 27,9%
University 66 63,5%
Post-Graduate 9 8,7%
Total 104 100,0%
Distribution of the sample group according to their educational status is demonstrated in Table 4. Accordingly, it is seen that out of the common ATM users participating in the survey, 29 (27,9%) are at an educational status of high school and below, 66 (63,5%) are university graduates, while 9 (8,7%) of them are post-graduates.
Fig 3. Distribution of the Sample Group According to Educational Status Table 5. Distribution of the Sample Group According to Marital Status
Frequency User Percentage (%)
Married 71 68,3%
Single 33 31,7%
Fig 4. Distribution of the Sample Group According to Marital Status Table 6. Distribution of the Sample Group According to Income Status
Frequency Percentage (%) 1000 TL and less 17 16,3% 1001-2000 TL 33 31,7% 2001-3000 TL 28 26,9% 3000 TL and more 26 25,0% Total 104 100,0%
Distribution of the sample group according to the income status of the participants is demonstrated in Table 6. Accordingly, it is seen that out of the common ATM users participating in the survey, 17 (16,3%) have an income level of 1000 TL and less, 33 (31,7%) have an income level of 1001-2000 TL, 28 (26,9%) have an income level of 2001-3000 TL, while 26 (25,0%) have an income level of 3000 TL and more.
Table 7. Distribution of the Sample Group According tothe Number of Banks/Credit Cards They Are Using
Frequency User Percentage (%)
1 38 36,5% 2 32 30,8% 3 14 13,5% 4 11 10,6% 5 9 8,7% Total 104 100,0%
Distribution of the sample group according to the number of banks/credit cards is shown in Table 7. Accordingly, it is seen that out of the common ATM users participating in the survey, 38 (36,5%) use 1 bank/credit card, 32 (30,8%) use 2 banks/credit cards, 14 (13,5%) use 3 banks/credit cards, 11 (10,6%) use 4 banks/credit cards, while 9 (8,7%) use 5 banks/credit cards.
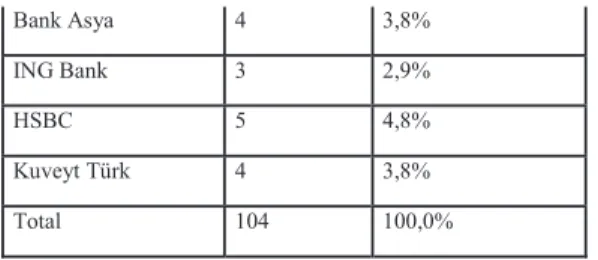
Fig 6. Distribution of the Sample Group According to the Number of Banks/Credit Cards They Are Using Table 8. Distribution of the Sample Group According to the Most Frequently Used Credit Cards
Frequency User Percentage (%)
İş Bankası 10 9,6%
Garanti Bankası 18 17,3%
Halk Bankası 13 12,5%
Yapı Kredi Bankası 13 12,5%
Ziraat Bankası 21 20,3%
Akbank 7 6,7%
Bank Asya 4 3,8%
ING Bank 3 2,9%
HSBC 5 4,8%
Kuveyt Türk 4 3,8%
Total 104 100,0%
Distribution of the sample group according to the most frequently used credit cards is displayed in Table 8. Accordingly, it is seen that out of the common ATM users participating in the survey, 10 (9,6%) use the credit cards of İş Bankası, 18 (17,3%) use the credit cards of Garanti Bankası, 13 (12,5%) use the credit cards of Halk Bankası, 13 (12,5%) use the credit cards of Yapı Kredi Bankası, 21 (20,2%) use the credit cards of Ziraat Bankası, 7 (6,7%) use the credit cards of Akbank, 6 (5,8%) use the credit cards of Finansbank, 4 (3,8%) use the credit cards of Bank Asya, 3 (2,9%) use the credit cards of ING Bank, 5 (4,8%) use the credit cards of HSBC, while 4 (3,8%) use the credit cards of Kuveyt Türk. İş Bankası 10% Garanti Bankası 17% Halk Bankası 12% Yapı Kredi Bankası 12% Ziraat Bankası 21% Akbank 7% Finansbank 6% Bank Asya 4% ING Bank 3% HSBC 5% Kuveyt Türk 4% İş Bankası Garanti Bankası Halk Bankası Yapı Kredi Bankası Ziraat Bankası Akbank Finansbank Bank Asya ING Bank HSBC Kuveyt Türk
Fig 7. Distribution of the Sample Group According to the Most Frequently Used Credit Cards
6.1. Reviewing the Relationship between Expected and Perceived Service Quality Scores in order to Determine the Satisfaction Levels of Common ATM Users Participating in the Survey
Table 9. Reviewing the Relationship between Expected and Perceived Service Quality Scores by Implementing Matched T-Test in order to determine the Satisfaction Levels of Common ATM Users Participating in the Survey
Groups N Mean Ss t P
Expected tangible characteristics 104 4,457 0,557 1,905 0,060 Perceived tangible characteristics 104 4,327 0,550
Expected reliability score 104 4,800 0,294 4,650 0,000
Perceived reliability score 104 4,554 0,523
Expected eagerness score 104 4,671 0,364 5,408 0,000
Perceived eagerness score 104 4,327 0,622
Expected trust score 104 4,863 0,305 3,645 0,000
Perceived trust score 104 4,675 0,467
Expected sensitivity score 104 4,467 0,535 5,170 0,000
Perceived sensitivity score 104 4,104 0,643
General expectation score 104 4,652 0,320 5,374 0,000
General perception score 104 4,397 0,445
Expected tangible characteristics score - As a result of the matched group t test conducted in order to determine whether or not the perceived tangible characteristics score median exhibits any significant variation, the difference between the arithmetical means is not found statistically significant (t=l,905; p=0,060>0,05).
Expected reliability score - As a result of the matched group t test conducted in order to determine whether or not the perceived reliability score median exhibits any significant variation, the difference between arithmetical means is found as statistically significant (t=4,650; p=0,000<0,05). According to the difference between the means, the perceived reliability score is less than the mean of the expected reliability score.
Expected eagerness score - As a result of the matched group t test conducted in order to determine whether or not the perceived eagerness score median exhibits any significant variation, the difference between the arithmetical means is found as statistically significant (t=5,408; p=0,000<0,05). According to the difference between the means, the perceived eagerness score is less than the mean of the expected eagerness score.
Expected trust score - As a result of the matched group t test conducted in order to determine whether or not the perceived trust score median exhibits any significant variation, the difference between the arithmetical means is found as statistically significant (t=3,645; p=0,000<0,05). According to the difference between the means, the perceived trust score is less than the mean of the expected trust score.
Expected sensitivity score - As a result of the matched group t test conducted in order to determine whether or not the perceived sensitivity score median exhibits any significant variation, the difference between the arithmetical means is found as statistically significant (t=5,170; p=0,000<0,05). According to the difference between the means, the perceived sensitivity score is less than the mean of the expected sensitivity score.
General expectation score - As a result of the matched group t test conducted in order to determine whether or not the general perception score median exhibits any significant variation, the difference between the arithmetical means is found as statistically significant (t=5,374; p=0,000<0,05). According to the difference between the means, general perception score is less than the mean of the general expectation score.
6.2 Studying the Relationship between the Expectation and Perception Scores of Questions Directed in order to Measure the Tangible Characteristics Satisfaction Level of the Common ATM Users Participating in the Survey
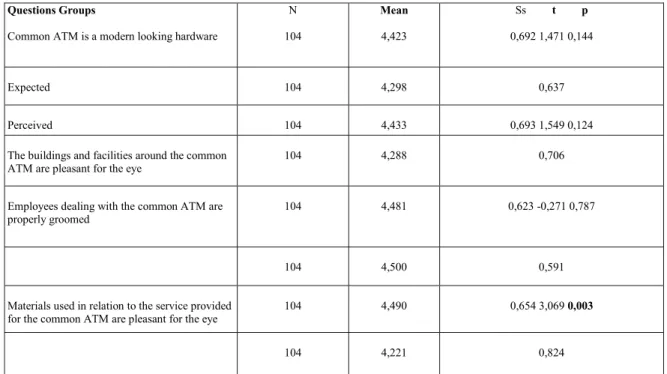
Table 10. Studying the Relationship between the Expectation and Perception Scores of the Questions Posed in order to Measure the Tangible Characteristics Satisfaction Level of the Common ATM Users Participating in the Survey
Questions Groups
Common ATM is a modern looking hardware
N 104 Mean 4,423 Ss t p 0,692 1,471 0,144 Expected 104 4,298 0,637 Perceived 104 4,433 0,693 1,549 0,124
The buildings and facilities around the common
ATM are pleasant for the eye 104 4,288 0,706
Employees dealing with the common ATM are
properly groomed 104 4,481 0,623 -0,271 0,787
104 4,500 0,591
Materials used in relation to the service provided
for the common ATM are pleasant for the eye 104 4,490 0,654 3,069 0,003
104 4,221 0,824
As a result of the matched group t test conducted with the purpose of determining whether or not there is a significant difference between the means of the expected and perceived service scores of the common ATM users participating in the survey, from amongst the services in connection with common ATMs, for the question “Common ATM is a modern looking hardware”, the difference found between the arithmetical means is not statistically meaningful (t=1,471; p=0,144>0,05).
As a result of the matched group t test conducted with the purpose of determining whether or not there is a significant difference between the means of the expected and perceived service scores of the common ATM users participating in the survey, from amongst the services in connection with common ATMs, for the question “The buildings and facilities around the common ATM are pleasant for the eye”, the difference between the arithmetical means is found as statistically meaningful (t=1,549; p=0,124>0,05).
As a result of the matched group t test conducted with the purpose of determining whether or not there is a significant difference between the means of the expected and perceived service scores of the common ATM users participating in the survey, from amongst the services in connection with common ATMs, for the question “Employees dealing with the common ATM are properly groomed”, the difference between the arithmetical means is not found statistically meaningful (t=-0,271; p=0,787>0,05).
As a result of the matched group t test conducted with the purpose of determining whether or not there is a significant difference between the means of the expected and perceived service scores of the common ATM users participating in the survey, from amongst the services in connection with common ATMs, for the question “Materials used in relation to the service provided for the common ATM are pleasant for the eye”, the difference between the arithmetical means is found statistically meaningful (t=3,069;p=0,003<0,05). According to the difference between the means, the mean of the perceived service score is lower than the mean of the expected service score obtained for the question “Materials used in relation with service provided for the common ATM, are pleasant for the eye”.
7. Conclusion and Assessment
In this period of rapidly developing information and technology, the most important concern of the business enterprises is to avoid falling behind the era and to attain superiority over the other competitors in the relevant sector by being well-acquainted with their customers, meeting their expectations and determining how such expectations would be met. Business enterprises are required to be specialized in matters such as customer loyalty, relational
marketing, customer oriented approach and customer relations management arising in line with the developments with respect to the essence of the customer. For those business enterprises which dominate all of the aforesaid matters, customer satisfaction would be generated automatically. If this is attained and realized, this would facilitate customer retention. Business enterprises attributing importance to the service quality and satisfaction of its customers should opt for measurement of customer satisfaction in order to further improve themselves. While conducting this, employees who are very well-acquainted with the technique as well as the measurement program should be preferred. Profitability of the business enterprise could be enhanced by adopting the necessary improvements and modifications in parallel to the data obtained as a result of such measurements. Banking sector has likewise assumed its share from the aforesaid rapid developments. New products and services are being introduced to the customers from one day to the next. How these products and services are perceived by the customers and how they influence their satisfaction level are possibly depicted through the measurement of customer satisfaction.
Within the limits of the sample population examined in the present study, the conclusions derived from the survey conducted in İstanbul, Turkey with the purpose of identifying the satisfaction levels of common ATM users are given below:
It is concluded that the general expectations of common ATM users are higher than the perceived service, and that such satisfaction is not maintained in full. It is further concluded that the expectations of common ATM users with respect to reliability are higher than their perceptions; the expectations of common ATM users with respect to eagerness are higher than their perceptions; and the expectations of common ATM users with respect to sensitivity are also higher than their perceptions. For monitoring the expectations through ATMs and thus reducing the number of personnel, it is recommended for banks to measure periodically their customer satisfaction levels through updated questionnaire screening operations. Further, the banks are recommended to improve their processes in order to provide services to customers on time and in a fast, flawless, enthusiastic and reliable manner. In respect of common ATM use, bank employees should improve their skills, should become equipped with the necessary know-how and foster a feeling of trust on the customers.
The satisfaction level of common ATM users might be a good research topic for further studies which could investigate the subject matter in a more detailed and comparative manner by using a larger sample population from different regions of the world.
References
Arslan, R. and Hotamışlı, M. (2007), Incentives and restrictions on Turkish banking system induced by the corporate ambient on the structure and applications of banks, Manisa Celal Bayar University, School of Economic and Administrative Sciences, Vol.14, No.1.
Atay, S. (et al), An application on elliptic curve based cryptographic protocol and smart card, Izmir Institute of Advanced Technology, School of Engineering, Department of Computer Engineering, pp.2.
Avşar, A. (2005), Risks encountered in electronic banking, Journal of Eskişehir Chamber of Industry, Vol.33, pp.52. Interbank Card Center Co. Inc. [Bankalararası Kart Merkezi A.Ş.] (2003), Book of Rules, Version 3.0, January.
Basel Committee on Banking Supervision (1998), Risk management for electronic banking and electronic money transactions, Turkish Bankers Association, Istanbul.
Bayındır, H. (2003), Installment card on Anatolian itineraries, Aktüel Para [Journal of Actual Money], Vol.468, pp.13.
Cibili, A. (2003), Interbank Exchange and Account Settlement System for Credit Card Transactions in Turkey, Unpublished MA Thesis, Marmara University – BSE (Banking Systems Institute), Istanbul.
Çeker, M. (1997), Credit card application and illegal use of credit cards regarding private law, Research Institute of Commerce and Banking Law, Ankara.
Çelik, Ö. (2009), Use Of Data Mining In Determining At Specific Periods The Demand For Cash On ATMs, Unpublished MA Thesis, Sakarya University, Institute of Sciences.
Dreifus, H. J., Monk, T. (1997), How tangible is your credit card limit, Economist Journal, Smart Cards, Wiley Computer Publishing, January 2000, Vol.2000, No.04, pp. 16-35.
Eyüpgiller, S. (2003), Bank Management Know-How For Bankers, 8th Reprint, Research Institute of Commerce and Banking Law, Ankara, Publication No.400.
Garanti Payment Systems Card Services Training Booklet (2006), Istanbul.
Karasar, N., (2009), Scientific Research Method, 20th Print, Nobel Publishing and Distribution. Istanbul.
Karatepe, O. M., Yavaş, U. and Babakuş, E. (2005), Measuring service quality of banks: Scale development and validation, Journal of Retailing and Consumer Services, September, pp. 373-383.
Kardaş, G. (2003), Use Of Smart Cards In Monitoring Healthcare Records, Unpublished MA Thesis, Ege University, International Computer Institute, Bornova, Izmir.
Kurşunel, F. (2003), Function of Credit Cards System Concerning Banking and a Typical Application, Unpublished MA Thesis, Selçuk University, Institute of Social Sciences, Department of Business Administration, Konya.
Öçer, A., and Bayuk, N. (2001), Customer satisfaction, World of Marketing, Vol.2, March-April.
Özarar, M., (Mayıs, 1998), About cryptographic smart cards in security mechanisms, PANO Journal, BKM, May, Vol.3, pp.2.
Pasaruman, A., Zeithaml, V. A. and Berry, L. L. (1990), Delivering Quality Service: Balancing Customer Perceptions and Expectations, The Free Press. New York.
Parasuraman, A., Zeithaml V. A. and Berry, L. L. (1991), Refinement and
reassessment of the SERVQUAL scale, Journal of Retailing, Vol.67, No.4, pp.420-450.
Salant, P., Dillman, D. A. (1994), How to Conduct Your Own Survey, John Wiley & Sons Inc. New York. Tanaçan, O. (2003), Smart cards, Compound Communications.
Toraman, C. (2002), Position of the internet in the banking industry and implementation of the same in Turkish banking system, Kamu-İş Labor Union, Vol.6, No.3.
Urhan, O. (2006), A practical assault on non-contact smart cards, Automation Journal, pp.116-119.
Urhan, O., Zengin, F., and Şanlı, M. (2004), Design and application of a security system via smart card using des algorithm, Kocaeli University, Electronic and Communication Engineering, Kocaeli, Eylül, pp.84-88.