Is the platelet‑to‑lymphocyte ratio
a new prognostic marker in multiple
myeloma?
Serife Solmaz, Ozcan Uzun1, Celal Acar, Omur Gokmen Sevindik2, Ozden Piskin3, Hayri Guner Ozsan3, Fatih Demirkan3, Bulent Undar3, Ahmet Alacacioglu4,
Mehmet Ali Ozcan3, Inci Alacacioglu3 Abstract:
BACKGROUND: Recent reports showed neutrophil-to-lymphocyte ratio (NLR), platelet-to-lymphocyte ratio (PLR), and monocyte-to-lymphocyte ratio (MLR), as a predictor of progression-free survival (PFS) and overall survival (OS) in various malignancies.
MATERIALS AND METHODS: We retrospectively examined the PLR, NLR, and MLR in a cohort of 186 newly diagnosed multiple myeloma (MM) patients. This study investigated the prognostic relevance of NLR, PLR, and MLR in MM patients. NLR, PLR, and MLR were calculated from whole blood counts before therapy. The Kaplan–Meier curves and multivariate Cox models were used for the evaluation of survival.
RESULTS: Applying cutoff of 1.9 (NLR), 120.00 (PLR), and 0.27 (MLR), decreased PLR showed a negative impact on the outcome. Decreased PLR is an independent predictor for PFS and OS. There were no significant differences in median survival between the high and low NLR (P = 0.80) and MLR (P = 0.87) groups.
CONCLUSIONS: In this study, thrombocytopenia and low PLR are associated with poor survival in MM patients does this P value apply to thrombocytopenia or low PLR and may serve as the cost-effective prognostic biomarker.
Key words:
Multiple myeloma, neutrophil-to-lymphocyte ratio, new prognostic marker, platelet-to-lymphocyte ratio
Introduction
M
ultiple myeloma (MM) is the second most common hematologic malignancy accounting for 1% of all tumors in the adults and approximately 15% of all hematologic malignancies.[1] MM is characterized by abnormal clonal proliferation of plasma cells in the bone marrow.[2] MM is a disease that affects plasma cells and can lead to devastating clinical features such as anemia, lytic bone lesions, hypercalcemia, and renal disease.[3,4] Proliferation and survival of these malignant plasma cellsheavily depend on signals coming from the microenvironment. Cytokines and growth factors (interleukin‑6 [IL‑6], vascular endothelial growth factor, insulin‑like growth factor 1, tumor necrosis factor, transforming growth factor β1, and IL‑10) are produced by stromal cells in the microenvironment that regulate myeloma cell growth, survival, and migration.[5] These inflammatory cytokines were also shown to have prognostic effect in patients with MM.[6] The international staging system (ISS) has demonstrated the prognostic value of serum β2 microglobulin and albumin levels in patients with MM.[7] Recently, platelet‑to‑lymphocyte ratio (PLR), neutrophil‑to‑lymphocyte ratio (NLR), Address for
correspondence:
Dr. Serife Solmaz, Izmir Bozyaka Education and Research Hospital, Hematology, Izmir, Turkey. E-mail: solmazserife@ yahoo.com Submission: 16-03-2018 Accepted: 11-09-2018 Department of Hematology, Bozyaka Education and Research Hospital, 1Department
of Internal Medicine, Batman Education and Research Hospital, Batman, 2Department of Hematology, Faculty of Medicine, Medipol Universıty, Istanbul, 3Department of Hematology, Faculty of Medicine, Dokuz Eylul Universıty, 4Faculty of
Oncology, Katip Çelebi University, Izmir, Turkey Access this article online
Quick Response Code:
Website: www.jlponline.org DOI:
10.4103/JLP.JLP_36_18
How to cite this article: Solmaz S, Uzun O, Acar C, Sevindik OG, Piskin O, Ozsan HG, et al. Is the platelet-to-lymphocyte ratio a new prognostic marker in multiple myeloma?. J Lab Physicians 2018;10:363-9. This is an open access journal, and articles are
distributed under the terms of the Creative Commons Attribution‑NonCommercial‑ShareAlike 4.0 License, which allows others to remix, tweak, and build upon the work non‑commercially, as long as appropriate credit is given and the new creations are licensed under the identical terms. For reprints contact: [email protected]
and monocyte‑to‑lymphocyte ratio (MLR) are gaining ground as valuable prognostic markers in solid and other hematologic malignancy.[8‑14] Therefore, our study aimed to investigate the role of pretreatment PLR, NLR, and MLR on the survival time of patients with MM. There are a number of studies investigating the relationship between NLR, MLR, and PLR and prognosis with myeloma patients in the literature. However, the relationship between PLR and prognosis has not been clearly demonstrated.
Materials and Methods
This retrospective study analyzed 186 newly diagnosed MM patients between 2005 and 2015 in the Department of Hematology, Dokuz Eylul University of Turkey. We described the age, gender, disease staging, immunoglobulin (Ig) subtypes at diagnosis, and survival of all patients. In all patients, complete blood count (CBC), biochemical examinations (including calcium, lactate dehydrogenase, albumin, and β2 microglobulin), erythrocyte sedimentation rate, and C‑reactive protein were taken at the diagnosis, and ISS was used as the staging criterion. Samples for laboratory investigations were collected in a standard and dispensed into appropriate bottles. Complete blood was performed with Beckman Coulter LH 780 among automated systems, and PLR, NLR, and MLR were calculated using data from the CBC count at the time of diagnosis. The PLR was calculated as platelet count divided by the absolute lymphocyte count, NLR was calculated as the absolute neutrophil count divided by the absolute lymphocyte count, and MLR was calculated as the absolute monocyte count divided by the absolute lymphocyte count of treatment‑naive patients.
Statistical analysis
Data were entered analyzed using Statistical Package for the Social Sciences (SPSS) statistics v 21.0 (Armonk, IBM Corp., N.Y., U.S.A). Pearson’s Chi‑square test for discrete variables or the Kruskal–Wallis test for continuous variables was used to compare the patient characteristics. The Kaplan–Meier method was used to estimate progression‑free survival (PFS) and overall survival (OS). OS was defined as the time from diagnosis to death as a result of any cause. PFS was defined as the time from diagnosis to disease progression. PFS and OS curves were compared using the log‑rank test. We determined the optimum cutoff points for the NLR and PLR as a predictor for OS based on the receiver operating characteristic (ROC) curve. The optimum cutoff points were the point on ROC curve. NLR, PLR, MLR, age, and ISS staging all were tested in the multivariate analysis. P < 0.05 was considered statistically significant.
Results
The baseline characteristics of the patients are summarized in Table 1. Among 186 MM patients, 56% were male, and 44% were female. The median age was 60 years (range 29–89). ISS staging of patients had been diagnosed with Stage I 24%, Stage II 28%, and Stage III 35% (not evaluated in 13% of the patients). The most prevalent MM type was IgG (51%). Forty‑one patients (8%) had severe renal failure.
Among all patients 100 (54%) received vincristine/ doxorubicin/dexamethasone, 34 (18%) received cyclophosphamide/dexamethasone, 21 (11%) received bortezomib/dexamethasone, and 31 (17%) were taken another regimens as induction regimens. A total of 115 (62%) were directed to autologous stem cell transplantation as part of induction regimen.
At the end of follow‑up time (median: 44 months), 82 deaths (44%) were recorded. The median OS and PFS were 44 months (2–146 months) and 24 months (0–104 months), respectively. The OS and PFS were 96% and 80% at 1 year, while OS and PFS were 52% and 25% at 5 years, respectively.
ISS staging was reported in only 161 (86.5%) of patients whom β2 microglobulin and albumin values were assessed. The median OS and PFS were calculated for all Table 1: The baseline characteristics of the patients
Characteristics Value Median age 60 (29-89) Gender (%) male 104 (56) Hb (g/dl) 11±5 WBC (mm3) 7±4 ANC (mm3) 3.9±1.8 ALC (mm3) 1.9±0.9 Platelet (×103/mm3) 228.00±88.00 Median LDH (U/L) 226±107 Sedimentation rate (mm/h) 82±33 Serum albumin (g/dL) 3.5±0.75 Serum β2 microglobulin (mg/L) 6.4±7 Ig type (%) Ig G 95 (51) Ig A 43 (16.7)
Liğht Chain kappa and lambda 26 (14)
Another 22 (18.3) ISS stage (%) I 45 (24) II 52 (28) III 64 (35) Not evaluated 25 (13)
Stem cell transplantation (%) 115 (62)
Death (%) 82 (44)
ISS = International staging system, WBC = White blood counter, ANC = Absolute neutrophil count, ALC = Absolute lymphocyte count
ISS stages. The median OS and PFS were 59 months and 33 months, respectively, for ISS I. The median OS and PFS were 44 months and 24 months, respectively, for ISS II, and 31 months and 16 months, respectively, for ISS III. We found a statistically significant relationship between ISS staging and OS (P = 0.001) and PFS (P = 0.001) in multivariate analysis.
The cutoff values for NLR, PLR, and MLR were not uniform in the previous reports for cancers. Hence, we performed ROC curve analysis for finding optimal cutoff points for the PLR, NLR, and MLR. The median NLR was 1.9 (range 036–9.4), the median PLR was 120.00 (range 7.50–765.00), and MLR was 0.27 (range 0–1.1). Based on the cutoff points for the NLR, PLR, and MLR, the patients were categorized into the groups as follows: high NLR group (≥1.9), low NLR group (<1.9) (with a sensitivity of 52.9% and specificity of 46.3%), high PLR group (≥120.00), low PLR group (<120.00) (with a sensitivity of 42.3% and specificity of 57.3%), high MLR group (≥0.27), and low MLR group (<0.27) (with a sensitivity of 48% and specificity of 51%).
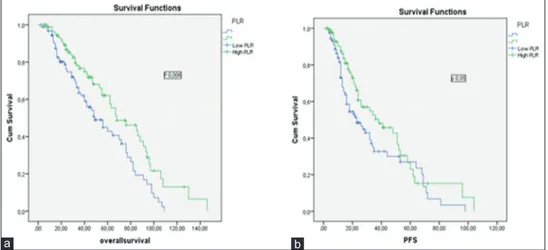
There was no statistical difference in OS between high NLR and low NLR groups (45 months [4–146 months] and 43 months [2–130 months]; P = 0.80, consistency). However, the OS of high PLR group was higher than low PLR group (48 months [4–146 months] and 40 months [2–109 months] P = 0.006, consistency) [Figure 1]. There was no significant difference in PFS between high NLR and low NLR groups (16 months [2–72 months] and 24 months [3–98 months], P = 0.14, consistency). H o w e v e r , t h e m e d i a n P F S w a s h i g h e r i n high PLR group (26 months [2–104 months] and 22 months [2–98 months], P = 0.005, consistency) [Figure 2]. The 5‑year PFS and OS estimates were 51% and 56% for patients with PLR <120.00 group versus 61% and 66% in patients with PLR ≥120.00 group, respectively (P = 0.006, consistency). The baseline characteristics of the patients in PLR groups are summarized in Table 2.
We studied that the prognostic value of MLR also. However, there was no significant difference in PFS
Figure 1: (a) The impact of platelet‑to‑lymphocyte ratio on overall survival in multiple myeloma patients, (b) the impact of platelet‑to‑lymphocyte ratio on progression‑free survival in multiple myeloma patients
a b
Figure 2: (a) The impact of neutrophil‑to‑lymphocyte ratio on overall survival in multiple myeloma patients, (b) the impact of neutrophil‑to‑lymphocyte ratio on progression‑free survival in multiple myeloma patients
and OS between high and low MLR groups (PFS: 24 months [2–104 months] and 24 months [2–98 months],
P = 0.81; OS: 43 months [4–146 months] and
44 months [2–130 months], P = 0.87).
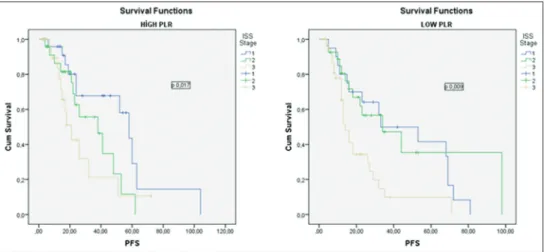
We examined affecting to OS of five variables, namely NLR, PLR, MLR, young age, and all ISS stage within multivariate analysis. We found that PLR, NLR, and ISS stage were statistically significant independent predictors for OS in the multivariate analysis [Table 3]. We made a subgroup analysis for each ISS stage for all patients; we combined the ISS stage and PLR. As shown in Table 4, OS and PFS were lower in all ISS subgroups of the patients with PLR <120.00; however, survival times were
lowest in patients with ISS III and PLR <120.00. Thus, ISS‑PLR very high‑risk group was defined in this group with ISS stage III and PLR <120.00. At the same time, as shown in Table 4, OS and PFS were highest in patients with ISS I and PLR ≥120.00. As a result, this group with ISS I and PLR ≥120.00 was defined as a ISS‑PLR low‑risk group. In all, 13, 5% of the patients were classified into the very low‑risk group (ISS stage I and PLR ≥120.00), 65% in standard risk group (patients not included in other two groups), and 21,5% in very high‑risk group (ISS Stage III and PLR <120.00). The 5‑year OS estimates were 88% (93 months), 71% (63 months), and 22% (42 months), for ISS‑PLR very low, standard, and very high‑risk groups, respectively. The 5‑year PFS estimates were 70%, 30%, and 10% in ISS‑PLR very low, standard, and very high‑risk groups, respectively [Figures 3 and 4].
There was no statistical significance between PLR groups for OS and PFS in the different treatment regimen subgroups. Since the numbers of patient were very small and the groups were heterogeneous.
Discussion
During systemic inflammation, neutrophilia and relative lymphopenia are expected as physiological response of the innate immune system.[15] Recently, the immunological profıle of patients with MM has been investigated in many studies, and the distinct immunological profile has been found to be associated with overall survival.[16] The NLR directly reflects the balance between neutrophilia and lymphopenia. A high NLR has been shown to be associated with poor prognosis for pancreatic, esophageal, rectal, lung, gastric, breast, ovarian cancer, and hematologic malignancy.[12,17‑19] NLR can be prognostic factor in severe disease conditions and various cancers. In the literature, there are some discrepancies about the effect of NLR on OS in patients with hematologic malignancies.[10,11,20,21] Wongrakpanich et al. found a significant relationship between high NLR and OS in the patients with MM (NLR cutoff point 2.59).[11] In another study, which was reported by Kelkitli et al., the study groups were divided into two groups according to the NLR cutoff point of 2.0. They found that MM patients with a NLR <2.0 survived longer compared with NLR >2.0.[10] This was the first study that found a significant relationship between NLR and OS in MM. Romano et al. found NLR to be a predictor of PFS and OS in MM patients treated upfront with novel agent. They showed that the 5‑year PFS and OS estimates were 18.2% and 36.4% for patients with NLR >2.0 versus 25.5 and 66.6% in patients with NLR <2.0. The prognostic relevance of NLR was even more prominent in the young patients and treated with autologous stem cell transplantation upfront.[20] In contrast to these studies, Atallah et al. did not able to show any significant relationship between OS Table 3: The results with multivariate analysis of the
neutrophil-to-lymphocyte ratio, platelet-to-lymphocyte ratio, monocyte-to-lymphocyte ratio, age, and
international staging system for overall survival
Variables P
PLR (<120.00 vs. ≥120.00) 0.01
NLR (<1.9 vs. ≥1.9) 0.045
MLR (<0.27 vs. ≥0.27) 0.3
Age (<65 vs. >65) 0.42
ISS (I, II, III) 0.001
PLR = Platelet-to-lymphocyte ratio, ISS = International staging system, NLR = Neutrophil-to-lymphocyte ratio, MLR = Monocyte-to-lymphocyte ratio
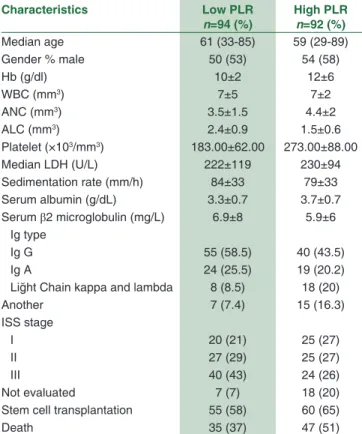
Table 2: The baseline characteristics of the patients according to platelet-to-lymphocyte ratio groups
Characteristics Low PLR n=94 (%) High PLRn=92 (%) Median age 61 (33-85) 59 (29-89) Gender % male 50 (53) 54 (58) Hb (g/dl) 10±2 12±6 WBC (mm3) 7±5 7±2 ANC (mm3) 3.5±1.5 4.4±2 ALC (mm3) 2.4±0.9 1.5±0.6 Platelet (×103/mm3) 183.00±62.00 273.00±88.00 Median LDH (U/L) 222±119 230±94 Sedimentation rate (mm/h) 84±33 79±33 Serum albumin (g/dL) 3.3±0.7 3.7±0.7 Serum β2 microglobulin (mg/L) 6.9±8 5.9±6 Ig type Ig G 55 (58.5) 40 (43.5) Ig A 24 (25.5) 19 (20.2)
Liğht Chain kappa and lambda 8 (8.5) 18 (20)
Another 7 (7.4) 15 (16.3) ISS stage I 20 (21) 25 (27) II 27 (29) 25 (27) III 40 (43) 24 (26) Not evaluated 7 (7) 18 (20)
Stem cell transplantation 55 (58) 60 (65)
Death 35 (37) 47 (51)
ISS = International staging system, WBC = White blood counter, ANC = Absolute neutrophil count, ALC = Absolute lymphocyte count, PLR = Platelet-to-lymphocyte ratio
Figure 3: The impact of platelet‑to‑lymphocyte ratio on progression‑free survival according to the international staging system Stages I, II, and III
Figure 4: The impact of platelet‑to‑lymphocyte ratio on overall survival according to the international staging system Stages I, II, and III and NLR. They used 2.28 as NLR cutoff point. They
defended their result on the basis of small sample size (96 patients).[21] We also did not find any statistical significant relationship between OS and NLR groups, although the survival seems to be better in low NLR group but not statistically significant (5‑year OS: 66% in low NLR, 54% in high NLR, P = 0.80). Due to these discrepancies, we think that prospective studies are needed, to clarify the effect of NLR on OS.
As the reactive thrombosis may be related to inflammatory response, the interaction between PLR and prognosis has been investigated in many studies,
and high PLR was reported as a predictor of poor prognosis in both hematological and nonhematological malignancies.[11,13,14,22,23] However, in contrast to these, a low platelet count or low PLR have been demonstrated to be a poor prognostic factor in myeloma patients.[24‑26] This difference in MM may be due to the pathology of the disease. Normal thrombopoiesis is inhibited by the accumulation of malignant plasma cells in the bone marrow in MM. The inflammatory response is related to cancer pathophysiology, the markers of inflammation, such as lymphocyte count, platelet count, C‑reactive protein, and hypoalbuminemia, have been investigated in cancer. Takagi et al. investigated the Table 4: Progression-free survival and overall survival results according to ISS and PLR
OS ISS I ISS II ISS III
Events/n 3-years estimate (%) P Events/n 3-years estimate (%) P Events/n 3-years estimate (%) P
PLR <120 20/45 74 0.017 27/52 76 0.045 40/64 22 0.009
PLR ≥120 25/45 96 0.018 25/52 77 0.01 24/64 51 0.90
PFS Events/n 3-years estimate (%) P Events/n 3-years estimate (%) P Events/n 3-years estimate (%) P
PLR <120 20/45 50 0.008 27/52 47 0.015 40/64 10 0.007
PLR ≥120 25/45 68 0.05 25/52 56 0.019 24/64 21 0.4
association of platelet activation status with clinical stages in MM patients and showed the role of platelets in MM progression. They found that IL‑1β is critical to platelet‑mediated MM progression.[27] In another study shown also that the half‑life of platelets has been reported to be significantly reduced in patients with MM.[28] In the study by Shi et al., it was shown that elevated NLR and MLR and decreased PLR were associated with unfavorable outcomes in newly diagnosed MM patients. The cutoff points for NLR, PLR, and MLR were 4, 100, and 0.3, respectively, in their study.[29]
In this study, we evaluated the prognostic significance of PLR in newly diagnosed myeloma patients and found a statistically significant difference in OS and PFS between patients with high and low PLR (OS: 48 months and 40 months P = 0.006; PFS: 26 and 22 months P = 0.005). However, high NLR and MLR did not affect the survival times significantly in the MM patients. We think this may be due to low sample size of our study.
Onec et al. showed that high NLR was associated with poor prognosis in the myeloma patients.[29] Li
et al. retrospectively analyzed 315 newly MM patients
and showed that MM patients with high NLR(>2) experienced shorter OS (P = 0.02) and PFS (P = 0.01).[30] However, the differences in OS and PFS by PLR were not found in these MM patients. Contrary to this, in this study, it was shown that there were statistically significant effects of PLR on OS and PFS in MM patients; however, there were no significant differences of OS and PFS according to NLR and MLR in MM patients. However, in multivariate analysis, it was concluded that PLR, NLR, and ISS stages were statistically significant independent predictors for OS.
Conclusions
As a result, we concluded that PLR is a significant prognostic factor for OS and PFS in newly diagnosed MM patients. The prognostic effect of PLR, NLR, and MLR in MM patients is still unclear. Further prospective studies will be necessary to the use of PLR as a prognostic marker in MM patients in routine practice.
Financial support and sponsorship Nil.
Conflicts of interest
There are no conflicts of interest.
References
1. Spicka I. Advances in multiple myeloma therapy during two past decades. Comput Struct Biotechnol J 2014;10:38‑40.
2. Röllig C, Knop S, Bornhäuser M. Multiple myeloma. Lancet 2015;385:2197‑208.
3. Snozek CL, Katzmann JA, Kyle RA, Dispenzieri A, Larson DR, Therneau TM, et al. Prognostic value of the serum free light chain ratio in newly diagnosed myeloma: Proposed incorporation into the international staging system. Leukemia 2008;22:1933‑7. 4. Naymagon L, Abdul‑Hay M. Novel agents in the treatment of
multiple myeloma: A review about the future. J Hematol Oncol 2016;9:52.
5. Yang HH, Ma MH, Vescio RA, Berenson JR. Overcoming drug resistance in multiple myeloma: The emergence of therapeutic approaches to induce apoptosis. J Clin Oncol 2003;21:4239‑47. 6. Ege H, Gertz MA, Markovic SN, Lacy MQ, Dispenzieri A,
Hayman SR, et al. Prediction of survival using absolute lymphocyte count for newly diagnosed patients with multiple myeloma: A retrospective study. Br J Haematol 2008;141:792‑8. 7. Greipp PR, San Miguel J, Durie BG, Crowley JJ, Barlogie B, Bladé J,
et al. International staging system for multiple myeloma. J Clin
Oncol 2005;23:3412‑20.
8. Santoni M, De Giorgi U, Iacovelli R, Conti A, Burattini L, Rossi L,
et al. Pre‑treatment neutrophil‑to‑lymphocyte ratio may be
associated with the outcome in patients treated with everolimus for metastatic renal cell carcinoma. Br J Cancer 2013;109:1755‑9. 9. Williams KA, Labidi‑Galy SI, Terry KL, Vitonis AF, Welch WR,
Goodman A, et al. Prognostic significance and predictors of the neutrophil‑to‑lymphocyte ratio in ovarian cancer. Gynecol Oncol 2014;132:542‑50.
10. Kelkitli E, Atay H, Cilingir F, Güler N, Terzi Y, Ozatlı D, et al. Predicting survival for multiple myeloma patients using baseline neutrophil/lymphocyte ratio. Ann Hematol 2014;93:841‑6. 11. Wongrakpanich S, George G, Chaiwatcharayut W, Biso S,
Candelario N, Mittal V, et al. The prognostic significance of neutrophil‑to‑lymphocyte and platelet‑to‑lymphocyte ratios in patients with multiple myeloma. J Clin Lab Anal 2016;30:1208‑13. 12. Porrata LF, Ristow K, Habermann T, Inwards DJ, Micallef IN,
Markovic SN, et al. Predicting survival for diffuse large B‑cell lymphoma patients using baseline neutrophil/lymphocyte ratio. Am J Hematol 2010;85:896‑9.
13. Feng JF, Huang Y, Liu JS. Combination of neutrophil lymphocyte ratio and platelet lymphocyte ratio is a useful predictor of postoperative survival in patients with esophageal squamous cell carcinoma. Onco Targets Ther 2013;6:1605‑12.
14. Salman T, Kazaz SN, Varol U, Oflazoglu U, Unek IT, Kucukzeybek Y, et al. Prognostic value of the pretreatment neutrophil‑to‑lymphocyte ratio and platelet‑to‑lymphocyte ratio for patients with neuroendocrine tumors: An izmir oncology group study. Chemotherapy 2016;61:281‑6.
15. Takizawa H, Boettcher S, Manz MG. Demand‑adapted regulation of early hematopoiesis in infection and inflammation. Blood 2012;119:2991‑3002.
16. Bryant C, Suen H, Brown R, Yang S, Favaloro J, Aklilu E, et al. Long‑term survival in multiple myeloma is associated with a distinct immunological profile, which includes proliferative cytotoxic T‑cell clones and a favourable treg/Th17 balance. Blood Cancer J 2013;3:e148.
17. Guthrie GJ, Charles KA, Roxburgh CS, Horgan PG, McMillan DC, Clarke SJ, et al. The systemic inflammation‑based neutrophil‑lymphocyte ratio: Experience in patients with cancer. Crit Rev Oncol Hematol 2013;88:218‑30.
18. Luo G, Guo M, Liu Z, Xiao Z, Jin K, Long J, et al. Blood neutrophil‑lymphocyte ratio predicts survival in patients with advanced pancreatic cancer treated with chemotherapy. Ann Surg Oncol 2015;22:670‑6.
19. Templeton AJ, McNamara MG, Šeruga B, Vera‑Badillo FE, Aneja P, Ocaña A, et al. Prognostic role of neutrophil‑to‑lymphocyte ratio in solid tumors: A systematic review and meta‑analysis. J Natl Cancer Inst 2014;106:dju124.
20. Romano A, Parrinello NL, Consoli ML, Marchionni L, Forte S, Conticello C, et al. Neutrophil to lymphocyte ratio (NLR) improves
the risk assessment of ISS staging in newly diagnosed MM patients treated upfront with novel agents. Ann Hematol 2015;94:1875‑83. 21. Atallah JP, Mohammad F, Bhat A, Patel NJ, Azab B,
Vivekanandrajah A, et al. Elevated neuthrophil: Lymphocyte ratio does not predict survival in multipl myeloma patients. Blood 2013;122:5336.
22. Baranyai Z, Krzystanek M, Jósa V, Dede K, Agoston E, Szász AM,
et al. The comparison of thrombocytosis and platelet‑lymphocyte
ratio as potential prognostic markers in colorectal cancer. Thromb Haemost 2014;111:483‑90.
23. Jung SH, Kim JS, Lee WS, Oh SJ, Ahn JS, Yang DH, et al. Prognostic value of the inverse platelet to lymphocyte ratio (iPLR) in patients with multiple myeloma who were treated up front with a novel agent‑containing regimen. Ann Hematol 2016;95:55‑61.
24. Eleftherakis‑Papapiakovou E, Kastritis E, Roussou M, Gkotzamanidou M, Grapsa I, Psimenou E, et al. Renal impairment is not an independent adverse prognostic factor in patients with multiple myeloma treated upfront with novel agent‑based regimens. Leuk Lymphoma 2011;52:2299‑303.
25. Ozkurt ZN, Yağci M, Sucak GT, Kirazli S, Haznedar R.
Thrombopoietic cytokines and platelet count in multiple myeloma. Platelets 2010;21:33‑6.
26. Shi L, Qin X, Wang H, Xia Y, Li Y, Chen X, et al. Elevated neutrophil‑to‑lymphocyte ratio and monocyte‑to‑lymphocyte ratio and decreased platelet‑to‑lymphocyte ratio are associated with poor prognosis in multiple myeloma. Oncotarget 2017;8:18792‑801.
27. Takagi S, Tsukamoto S, Park J, Johnson KE, Kawano Y, Moschetta M,
et al. Platelets enhance multiple myeloma progression via IL‑1β upregulation. Clin Cancer Res 2018;24:2430‑9.
28. Fritz E, Ludwig H, Scheithauer W, Sinzinger H. Shortened platelet half‑life in multiple myeloma. Blood 1986;68:514‑20.
29. Onec B, Okutan H, Albayrak M, Saribacak Can E, Aslan V, Unver Koluman B, et al. The predictive role of the neutrophil/ Lymphocyte ratio in survival with multiple myeloma: A Single center experience. J Clin Lab Anal 2017;31:2‑8.
30. Li Y, Li H, Li W, Wang L, Yan Z, Yao Y, et al. Pretreatment neutrophil/lymphocyte ratio but not platelet/lymphocyte ratio has a prognostic impact in multiple myeloma. J Clin Lab Anal 2017;31: e22107.