Adding lipoprotein(a) levels to the GRACE score
to predict prognosis in patients with
non-ST elevation acute coronary syndrome
Ekrem Guler
1, Cetin Gecmen
2, Gamze Babur Guler
3, Oguz Karaca
1, Hicaz Zencirkiran Agus
2,
Haci Murat Gunes
2, Ulankhuu Batgerel
2, Ali Elveran
2, Ali Metin Esen
2 1Cardiology Clinic, Medipol University, Istanbul, Turkey2Cardiology Clinic, Kartal Kosuyolu Heart and Research Hospital, Istanbul, Turkey 3Cardiology Clinic, Atatürk State Hospital, Duzce, Turkey
A b s t r a c t
Background: High levels of lipoprotein(a) [Lp(a)] are known to be a cardiovascular risk factor associated with premature coronary artery disease. In predicting the long term prognosis in acute coronary syndromes (ACS), the relationship between Lp(a) and risk scoring systems remains unclear.
Aim: We investigated whether adding Lp(a) to the GRACE scoring system has an incremental value in predicting prognosis in ACS.
Methods: 115 patients (mean age 64 ± 11 years) with non-ST elevation acute coronary syndromes (NSTE-ACS) were enrolled in this prospective study. Patients were categorised into quartiles according to the Lp(a) levels. Statistically significant variables in the univariate analysis (haemoglobin, creatinine, age, left ventricular ejection fraction, previous myocardial infarction (MI) history, Killip class) were included in the multivariate analysis to determine the independent predictors of cardiovascular outcomes (mortality, rehospitalisation) with and without Lp(a) quartiles for one year follow-up.
Results: Previous MI history and Lp(a) quartile were detected as independent predictors of combined cardiovascular events (OR: 2.969 [95% CI 1.413–6.240] and OR: 6.279 [95% Cl 1.363–28.927] respectively). Lp(a) quartile also remained as an independent predictor for prognosis when added to a model based on GRACE risk score (OR: 2.589 [95% CI 1.402–4.780]). Serum Lp(a) levels were moderately correlated with GRACE risk score (r = 0.371; p < 0.001).
Conclusions: Lipoprotein(a) has an additional prognostic value over GRACE risk score in predicting one-year adverse outcomes in NSTE-ACS. The combination of serum Lp(a) with GRACE risk score could provide enhanced risk stratification in patients with ACS.
Key words: lipoprotein(a), acute coronary syndromes, GRACE risk score
Kardiol Pol 2013; 71, 7: 695–701
Address for correspondence:
Gamze Babur Guler, Cardiology Clinic, Atatürk State Hospital, Aziziye street, 417 Duzce, Turkey, e-mail: [email protected] Received: 19.07.2012 Accepted: 21.02.2013
Copyright © Polskie Towarzystwo Kardiologiczne
INTRODUCTION
Non-ST elevation acute coronary syndrome (NSTE-ACS) is the commonest cause of all acute coronary syndromes (ACS) accounting for 70% of coronary care unit admissions [1]. Risk stratification in NSTE-ACS is mandatory to guide its management, owing to the wide spectrum of the patient population. It is known that several biomarkers incorporated in the current risk scores provide added prognostic informa-tion in NSTE-ACS [2].
The Global Registry of Acute Coronary Events (GRACE) risk score, which is based on clinical features, ECG changes and biomarkers (troponin and creatinine), is one of the most frequently used risk scores.
Among several scoring systems for NSTE-ACS, GRACE is the recommended risk score that predicts adverse outcomes during the hospital stay as well as at six-month post-discharge [3–5]. Several biomarkers such as C-reactive protein (CRP) [6], and type B natriuretic peptide (BNP) [7] have been
shown to improve prediction when added to the GRACE risk score.
Lipoprotein(a) (Lp(a)] is a complex lipoprotein particle considered as a cardiovascular (CV) risk factor in numerous studies. It has been shown that increased levels of Lp(a) is associated with premature atherosclerosis, myocardial infarc-tion (MI) and stroke [8]. However, the relainfarc-tionship between Lp(a) and risk scoring systems in ACS still remains unclear. We hypothesised that Lp(a) is an independent predictor of prognosis, and that adding Lp(a) to the GRACE scoring system has an incremental value for predicting adverse events in patients with NSTE-ACS.
METHODS
Study population
A total of 123 patients with NSTE-ACS were enrolled between September 2008 and December 2009 in this prospective ob-servational study. Contact with eight patients was lost during follow-up and the remaining 115 patients completed one year of follow-up. The presence of ischaemic chest pain and/or typi-cal ECG changes (including new onset ST-segment depression or T-wave inversion in two contiguous leads), and/or elevated troponin T levels (> 0.1 ng/dL) were defined as the inclusion criteria. Patients with ST-segment elevation, new onset left bundle branch block, and secondary conditions to precipitate angina (anaemia, fever, and thyrotoxicosis) were excluded. All patients underwent physical examination and a comprehensive evaluation by two-dimensional and Doppler echocardiography.
All patients received standard ACS therapy including aspirin, clopidogrel, low molecular weight heparin, glycopro-tein IIb/IIIa inhibitors, angiotensin converting enzyme (ACE) inhibitors, beta-blockers, and statins as recommended by the guidelines. Patients were submitted to coronary angiography and percutaneous coronary intervention at the decision of the treating physician. Angiographic data was recorded. The study protocol was approved by the local ethics committee and written informed consent was obtained from each patient.
Risk score
At admission, the variables of GRACE risk score (age, heart rate, systolic blood pressure, Killip class, cardiac arrest at admission, troponin levels, ST segment deviation, and serum creatinine) were recorded. Risk factors for coronary artery disease (CAD) (hypertension, diabetes mellitus, hypercholes-terolaemia, being a current smoker and having a family history of CAD), previous medication (antiplatelet agents, ACE inhibi-tors, beta-blockers, statins) and reperfusion strategy were also recorded. GRACE risk scores were divided into low (1–108), intermediate (109–140) and high risk (141–372) groups.
Laboratory
Blood samples from an antecubital vein were collected from each patient. The levels of serum total cholesterol (T-C), high
density lipoprotein-cholesterol (HDL-C), and triglyceride (TG) were measured using the standardised enzymatic methods in the first 24 hours after admission. The rationale for measur-ing lipid parameters in the first 24 hours was that serum T-C concentration in this period is likely to reflect pre-infarction concentrations, as reported by Jackson et al. [9]. Low density lipoprotein cholesterol (LDL-C) was calculated according to Friedewald’s equation if TG levels were < 400 mg/dL. Serum Lp(a) level was measured immediately to avoid potential changes due to long-term storage. Lp(a) concentration was determined by rate nephelometry using commercial test kits (LPAX reagent, Beckman Coulter Ireland Inc, Galway, Ireland).
Follow-up
Patients were followed-up for a median of 12 months on the basis of outpatient visits, telephone contact or hospital records. The primary end-point, defined as the composite of CV death and rehospitalisation due to ACS, was assessed during the 12 months of follow-up.
Statistical analysis
Patients were divided into terciles of GRACE score and quar-tiles of Lp(a) levels. Categorical variables were presented as number of cases (percentage), continuous variables as mean (standard deviation), and as median (range). The mean values of baseline variables were compared among GRACE risk groups (low, medium, high) with ANOVA for continuous variables when data is normally distributed, and median values were compared with Kruskal-Wallis test when data is not normally distributed. Categorical variables were compared with c2 test.
Association between variables and CV events (mortality and rehospitalisation) was assessed using multivariate logistic regression models: variables which were included in the first multivariate model were determined by univariate regression analysis for CV events and only those with p < 0.05 were retained in the base model: age, serum creatinine, ejection fraction, haemoglobin, previous MI history, Killip class. The second model included GRACE terciles only. Furthermore, the incremental value of adding Lp(a) to the base model and GRACE terciles model was assessed by another multivaria-te logistic regression model. We used the goodness-of-fit measures of models; Hosmer-Lemeshow test with p-value greater than 0.05 reports that observed and model-predicted values of the dependent variable are the same, implying that the model’s estimates fit the data well [10]. Nagelkerke R2 expresses that the percent of variation in the dependent
variable is accounted for by variation in the independent variables [11].
Likelihood ratio c2 test is used to compare the fit of one
model to the fit of the other model. In this study, for illustra-tive purposes; in nested models it is used to assess whether adding Lp(a) to the model provides an improvement in terms of goodness-of-fit over the base model or GRACE terciles
model. If it provides an improvement in fit, therefore p value should be significant.
All statistical analyses were performed using SPSS for Windows version 11.0. All tests were two-sided and statistical significance was defined as p value < 0.05.
RESULTS
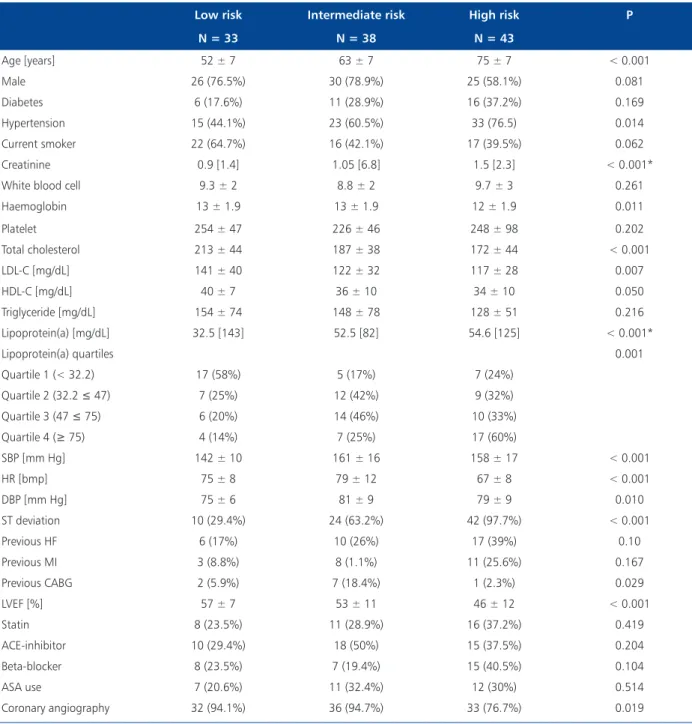
The study population included 115 patients (mean age 64 ± 11 years) with NSTE-ACS who were divided into low, intermediate, and high risk groups according to the terciles of the GRACE risk score. Patients were categorised into quartiles according to the Lp(a) levels as follows: Quartile 1: Lp(a) < 32.2 mg/dL, (n = 29); Quartile 2: 32.2 £ Lp(a) < 47 mg/dL, (n = 28); tile 3: 47 £ Lp(a) < 75 mg/dL, (n = 30); and Quar-tile 4: Lp(a) ≥ 75 mg/dL, (n = 28). The baseline characteristics of the patients according to the risk groups are shown in Table 1. The mean values of T-C, LDL-C and HDL-C in low, intermediate and high risk groups were found to increase from high to low GRACE risk groups. Since Lp(a) values were not normally distributed in the GRACE risk score terciles, median values were used and recorded as 32.5 [143] mg/dL, 52.5 [82] mg/dL, and 54.6 [125] mg/dL, respectively.
During a median follow up of 12 months, the incidence of combined CV events was 17.4% (14 CV deaths and six rehos-pitalisations). Of the 14 deaths, five patients had cardiogenic shock, one patient had refractory ventricular fibrillation, six patients had sudden cardiac death, and two deaths occurred early after surgical coronary revascularisation due to left ven-tricular pump failure. Combined CV events, mortality and rehospitalisations for each GRACE tercile are shown in Table 2.
By univariate logistic regression analysis; age, gender, systolic blood pressure, heart rate, Lp(a) quartile, HDL-C, LDL-C, ST deviation, left ventricular ejection fraction (LVEF), previous heart failure, creatinine, previous diabetes, previous hypertension, previous MI, Killip class, and haemoglobin were evaluated for combined CV events (Table 3). Haemoglobin, creatinine, age, LVEF, previous MI and Killip class were found to be statistically significant in the univariate model. These variables were included in the multivariate logistic regres-sion model by both including and excluding Lp(a) quartile to determine the independent predictors of CV events during 12 months. Previous MI history was revealed to be inde-pendent of prognosis for the base model (OR: 6.222 [95% CI 1.600–24.202]. Lp(a) quartile and previous MI history were detected as independent predictors of prognosis for the second model (OR: 2.969 [95% CI 1.413–6.240] and OR 6.279 [95% Cl 1.363–28.927] respectively). When included in a model based on the GRACE risk score, Lp(a) quartile remained as an independent predictor of adverse events (2.589 [1.402–4.780]). The addition of Lp(a) quartile improved Nagelkerke R2 and calibration of the models with
a higher p value for Hosmer-Lemeshow test (Table 4).
The base model and the GRACE risk score model were compared by including Lp(a) quartiles. Likelihood ratio c² and p value were compared among the models. P values of all models were significant, and Lp(a) quartiles added more significant prognostic value to GRACE terciles model (p = 0.001 and p < 0.001) (Fig. 1).
Correlation of the GRACE risk score with Lp(a) levels is shown in Figure 2 (r = 0.371, p < 0.001).
DISCUSSION
In the present study, we principally evaluated the additional role of serum Lp(a) levels to the GRACE risk score for predict-ing prognosis in patients with NSTE-ACS. We have shown that elevated levels of Lp(a) were correlated with increasing GRACE risk scores. Moreover, the independent predictors of mortality and rehospitalisations during 12 months of follow-up were detected as serum Lp(a) levels added to the GRACE score.
The patients with NSTE-ACS are evaluated in a wide clini-cal spectrum with varying short and long term prognosis [3]. The decision as to the treatment strategy requires early risk stratification. Currently available risk scoring systems are based on clinical history, ECG changes, and laboratory tests. Although GRACE risk score was initially developed to predict in-hospital mortality in NSTE-ACS patients, it has recently been shown to predict long-term risk of MI and death in the same patient population [12]. Over the years, new biomarkers have been added to the risk scores and tested for predicting prognosis in patients with NSTE-ACS. CRP as a marker of inflammation [6], and BNP, as an indicator of left ventricular overload [7], have been the most studied markers. It has also been revealed that a multi-marker approach based on adding troponin T, CRP, and NT-proBNP to the TIMI risk score provided com-plementary information in ACS patients [2].
In our study, we investigated the contribution of Lp(a) to the traditional GRACE risk score, and found that Lp(a) provided significant prognostic information in patients with NSTE-ACS.
Lipoprotein(a) contains apolipoprotein(a) linked to apolipoprotein B-100 by a single disulfide bond and cho-lesterol-rich LDL particles [13]. Since first described by Berg 40 years ago [14], Lp(a) has been accepted as a strong CV risk factor. It is known that Lp(a) is more atherogenic than LDL to retain in the vessel wall [15]. It is considered that Lp(a) can either inhibit fibrinolysis or promote coagulation as a prothrombotic molecule because it contains smaller apo(a) isoforms homologous with plasminogen [16]. However, based on its relation to the proinflammatory oxidised phospholip-ids, a proatherogenic role of Lp(a) has been suggested [17]. Proatherogenic/prothrombotic effects of Lp(a) seem to be related to the adverse CV events during long-term follow-up.
Due to the proatherogenic structure of Lp(a), high levels have long been associated with coronary and cerebrovascular diseases as well as coronary in-stent restenosis [18, 19]. It has been shown that Lp(a) predicts the severity of coronary
athero-Table 1. Baseline demographic and clinical characteristics of patients according to GRACE risk groups
Low risk Intermediate risk High risk P
N = 33 N = 38 N = 43 Age [years] 52 ± 7 63 ± 7 75 ± 7 < 0.001 Male 26 (76.5%) 30 (78.9%) 25 (58.1%) 0.081 Diabetes 6 (17.6%) 11 (28.9%) 16 (37.2%) 0.169 Hypertension 15 (44.1%) 23 (60.5%) 33 (76.5) 0.014 Current smoker 22 (64.7%) 16 (42.1%) 17 (39.5%) 0.062 Creatinine 0.9 [1.4] 1.05 [6.8] 1.5 [2.3] < 0.001*
White blood cell 9.3 ± 2 8.8 ± 2 9.7 ± 3 0.261
Haemoglobin 13 ± 1.9 13 ± 1.9 12 ± 1.9 0.011 Platelet 254 ± 47 226 ± 46 248 ± 98 0.202 Total cholesterol 213 ± 44 187 ± 38 172 ± 44 < 0.001 LDL-C [mg/dL] 141 ± 40 122 ± 32 117 ± 28 0.007 HDL-C [mg/dL] 40 ± 7 36 ± 10 34 ± 10 0.050 Triglyceride [mg/dL] 154 ± 74 148 ± 78 128 ± 51 0.216 Lipoprotein(a) [mg/dL] 32.5 [143] 52.5 [82] 54.6 [125] < 0.001* Lipoprotein(a) quartiles 0.001 Quartile 1 (< 32.2) 17 (58%) 5 (17%) 7 (24%) Quartile 2 (32.2 £ 47) 7 (25%) 12 (42%) 9 (32%) Quartile 3 (47 £ 75) 6 (20%) 14 (46%) 10 (33%) Quartile 4 (≥ 75) 4 (14%) 7 (25%) 17 (60%) SBP [mm Hg] 142 ± 10 161 ± 16 158 ± 17 < 0.001 HR [bmp] 75 ± 8 79 ± 12 67 ± 8 < 0.001 DBP [mm Hg] 75 ± 6 81 ± 9 79 ± 9 0.010 ST deviation 10 (29.4%) 24 (63.2%) 42 (97.7%) < 0.001 Previous HF 6 (17%) 10 (26%) 17 (39%) 0.10 Previous MI 3 (8.8%) 8 (1.1%) 11 (25.6%) 0.167 Previous CABG 2 (5.9%) 7 (18.4%) 1 (2.3%) 0.029 LVEF [%] 57 ± 7 53 ± 11 46 ± 12 < 0.001 Statin 8 (23.5%) 11 (28.9%) 16 (37.2%) 0.419 ACE-inhibitor 10 (29.4%) 18 (50%) 15 (37.5%) 0.204 Beta-blocker 8 (23.5%) 7 (19.4%) 15 (40.5%) 0.104 ASA use 7 (20.6%) 11 (32.4%) 12 (30%) 0.514 Coronary angiography 32 (94.1%) 36 (94.7%) 33 (76.7%) 0.019
Data is presented as the mean value ± standard deviation and percentage of patients. *This data is presented as median and range.
LDL-C — low density lipoprotein cholesterol; HDL-C — high density lipoprotein cholesterol; SBP — systolic blood pressure; DBP — diastolic blood pressure; HR — heart rate, HF — heart failure; MI — myocardial infarction; CABG — coronary artery bypass grafting; LVEF — left ventricular ejec-tion fracejec-tion; ACE — angiotensin-converting enzyme; ASA — acetylsalicylic acid
Table 2. Comparison of cardiovascular events according to GRACE terciles
Low risk Intermediate risk High risk P
N = 33 N = 38 N = 43
Combined cardiovascular events 1 (2.9%) 6 (15.8%) 13 (30.2%) 0.007
Cardiovascular mortality 1 (2.9%) 3 (7.9%) 10 (23.3%) 0.016
Table 3. Results of univariate model for 12 months combined cardiovascular events
c2 Odds ratio [95% CI]
Age (per year) 5.69 1.054 [1.007–1.103] Gender (male) 0.348 1.385 [0.461–4.163] Killip class 7.16 2.861 [1.256–6.517] Diabetes mellitus 0.456 1.429 [0.513–3.977] Hypertension 1.892 2.089 [0.701–6.224] Heart failure history 2.948 2.420 [0.895–6.547] Previous MI history 12.648 6.917 [2.384–20.069] SBP [mm Hg] 0.341 0.992 [0.964–1.020] HR [bpm] 0.061 1.005 [0.963–1.050] Lp(a) quartile 17.658 2.985 [1.641–5.432] LDL-C [mg/dL] 1.299 0.992 [0.978–1.006] HDL-C [mg/dL] 0.300 0.986 [0.936–1.036] Creatinine [mg/dL] 6.760 1.933 [1.020–3.661] Haemoglobin [g/dL] 6.676 0.705 [0.536–0.927] ST deviation 0.168 1.242 [0.437–3.533] LVEF [%] 10.958 0.936 [0.899–0.974] MI — myocardial infarction; CI — confidence interval; SBP — systo-lic blood pressure; HR — heart rate; LVEF — left ventricular ejection fraction; LDL-C — low density lipoprotein cholesterol; HDL-C — high density lipoprotein cholesterol; Lp(a) — lipoprotein(a)
Table 4. Model fit indices when Lp(a) is added in a model with GRACE terciles and in a multivariate model
Without Lp(a) Odds ratio [95% CI]
With Lp(a) Odds ratio [95% CI]
Multivariate model Haemoglobin [g/dL] 0.840 [0.594–1.188] 1.002 [0.694–1.428] Creatinine [mg/dL] 1.512 [0.879–2.600] 1.634 [0.907–2.945] Age (per year) 1.020 [0.965–1.078] 1.018 [0.959–1.081] LVEF [%] 0.993 [0.938–1.051] 1.000 [0.938–1.066] Previous MI history 6.222 [1.600–24.202] 6.279 [1.363–28.927] Killip class 2.359 [0.872–6.385] 2.810 [0.887–8.901] Lp(a) quartile 2.969[1.413–6.240] P (Hosmer Lemeshow) 0.356 0.810 Nagelkerke R2 0.339 0.456
Model with GRACE risk terciles GRACE risk terciles 3.105 [1.457–6.618] 2.385 [1.055–5.389] Lp(a) quartile 2.589 [1.402–4.780] P (Hosmer Lemeshow) 0.472 0.756 Nagelkerke R2 0.149 0.292
Lp(a) — lipoprotein a; CI — confidence interval; LVEF — left ventricular ejection fraction; MI — myocardial infarction
sclerosis regardless of the conventional CV risk factors, espe-cially in normolipidemic patients [20]. Cho et al. [21] showed that high serum levels of Lp(a) were significantly associated with long-term adverse outcomes in acute MI patients, especially in those having a high Killip class. They suggested that Lp(a) levels could provide data for risk stratification in patients with acute MI. In our study, Lp(a) levels increased in parallel with the increasing GRACE risk scores in patients with NSTE-ACS.
On the other hand, we observed that LDL-C values significantly decreased with increasing GRACE risk score groups. It is supposed that MI in patients with low LDL-C levels
Figure 1. Comparison of logistic regression models by the use of the likelihood ratio c2 statistic for nested models;
Lp(a) — lipoprotein(a)
Figure 2. Correlation between GRACE risk score and lipoprotein(a)
is associated with insufficient modification of other known risk factors. Another explanation is that patients with low baseline LDL-C levels do not receive aggressive statin therapy [22]. However, lowering LDL-C has still been a cornerstone of
pharmacological management of CAD although atheroscle-rotic complications still occur in patients who have reached the target low-lipid profile. The current status of Lp(a) as a CV risk factor was stated in a recently published consensus panel [23]. This suggested that Lp(a) should be measured in patients with an intermediate or high risk of CAD who present with one of the following: recurrent events despite statin therapy; pre-mature CAD; familial hypercholesterolaemia; family history of premature CAD and/or elevated Lp(a); ≥ 3% ten-year risk of fatal CAD according to the European guidelines; or ≥ 10% ten-year risk of fatal and/or non-fatal coronary heart disease according to the US guidelines. They also emphasised that after reduction of LDL-C and T-C levels, it was recommended to reduce Lp(a) below 50 mg/dL by using niacin since Lp(a) is not affected by statin therapy. Our study supports this; when the patients’ GRACE score increased, LDL-C levels decreased significantly. Along with the rise in the Lp(a) level, the frequency of CV events seemed to be increased. How-ever, nearly 30% of patients in our study used statin therapy before the admission for ACS and we administered statins to all patients as recommended. Patients did not take special treatment for high Lp(a) levels that might be responsible for the adverse cardiac events.
In our study, Lp(a) emerged as the most important pre-dictor of prognosis along with previous MI history, which has been definitely proven to correlate with adverse events in ACS and has been shown as a GRACE risk score variable [4, 5]. Although previous MI history is a powerful predictor of prognosis, after the addition of Lp(a) to the regression model, Lp(a) also became a predictor of adverse events. Lp(a) has been also shown as a predictor of poor prognosis during one year of follow-up when added to the GRACE risk score.
The present study has limitations in several aspects. Firstly, it was a single centre study. Secondly, elevated levels of Lp(a) in our study population could be attributable to the tissue injury during MI since previous studies [24, 25] showed that Lp(a) levels were elevated as an acute-phase reactant. It was difficult to determine the correct time to collect blood samples for Lp(a). Finally, the patient population was relatively small, and further studies with a large sample size are required.
CONCLUSIONS
Lp(a) has an additional prognostic value over GRACE risk score in predicting one-year adverse events in NSTE-ACS. The combination of Lp(a) with GRACE risk score could provide enhanced risk stratification in patients with ACS.
Conflicts of interest: none declared References
1. Rosamond W, Flegal K, Furie K et al. American Heart Association Statistics Committee and Stroke Statistics Subcommittee. Heart disease and stroke statistics–2008 update: a report from the American Heart Association
Statistics Committee and Stroke Statistics Subcommittee. Circulation, 2008; 117: e25–e146.
2. Tello-Montoliu A, Marın F, Rolda’n V et al. Multimarker risk stratification approach to non-ST elevation acute coronary syndrome: implications of troponin T, CRP, NT pro-BNP and fibrin D-dimer levels. J Intern Med, 2007; 262: 651–658.
3. Granger CB, Goldberg RJ, Dabbous OH et al. The Global Registry of Acute Coronary Events Investigators. Predictors of hospital mortality in the global registry of acute coronary events. Arch Intern Med, 2003; 163: 2345–2353.
4. Eagle KA, Lim MJ, Dabbous OH et al. The GRACE Investigators. A validated prediction model for all forms of acute coronary syndrome. Estimating the risk of 6-month post-discharge death in an international registry. JAMA, 2004; 291: 2727–2733.
5. Fox KAA, Dabbous OH, Goldberg RJ et al. The GRACE Investigators. Pre-diction of risk of death and myocardial infarction in the six months after presentation with acute coronary syndrome: prospective multinational observational study (GRACE). BMJ, 2006; 333: 1091.
6. Schiele F, Meneveau N, Seronde MF et al. C-reactive protein improves risk prediction in patients with acute coronary syndromes. Eur Heart J, 2010; 31: 290–297.
7. Ang DS, Wei L, Kao MP et al. A comparison between B-type natriuretic peptide, Global Registry of Acute Coronary Events (GRACE) score and their combination in ACS risk stratification. Heart, 2009; 95: 1836–1842. 8. Erqou S, Kaptoge S, Perry PL et al. Lipoprotein(a) concentration and the
risk of coronary heart disease, stroke, and nonvascular mortality. JAMA, 2009; 302: 412–423.
9. Jackson R, Scragg R, Marshall R et al. Changes in serum lipid concentra-tions during first 24 hours after myocardial infarction. Br Med J (Clin Res Ed), 1987; 294: 1588–1589.
10. Hosmer DW, Lemeshow S. Applied logistic regression. 2nd Ed. John Wiley & Sons Inc., New York 2000.
11. Kleinbaum DG. Logistic regression a self learning text. Springer-Verlag New York Inc. 1994.
12. Fox KA, Carruthers KF, Dunbar DR et al. Underestimated and under-re-cognized: the late consequences of acute coronary syndrome (GRACE UK-Belgian Study). Eur Heart J, 2010; 31: 2755–2764.
13. Utermann G. Lipoprotein(a). In: Scriver CR, Beaudet AL, Sly WS, Valle D eds. The metabolic and molecular bases of inherited disease. 8th Ed. McGraw-Hill, New York 2001: 2753–2787.
14. Berg K. A new serumtype system in man-the Lp system. Acta Pathol Microbiol Scand. 1963,59; 369–382
15. Beisiegel U, Niendorf A, Wolf K et al. Liporotein (a) in the arterial wall. Eur Heart J, 1990; 11 (suppl. E): 174–183.
16. Marcovina SM, Koschinsky ML. Evaluation of lipoprotein(a) as a pro-thrombotic factor: progress from bench to bedside. Curr Opin Lipidol, 2003; 14: 361–366.
17. Tsimikas S, Brilakis ES, Miller ER et al. Oxidized phospholipids, Lp(a) lipoprotein, and coronary artery disease. N Engl J Med, 2005; 353: 46–57. 18. Peña-Díaz A, Izaguirre-Avila R, Anglés-Cano E. Lipoprotein Lp(a) and
atherothrombotic disease. Arch Med Res, 2000; 31: 353–359.
19. Frohlich J, Dobíasova M, Adler L et al. Gender differences in plasma levels of lipoprotein(a) in patients with angiographically proven coronary artery disease. Physiol Res, 2004; 53: 481–486.
20. Lima LM, Carvalho MG, Loures-Vale AA et al.. Increased serum levels of lipoprotein(a) correlated with the severity of coronary artery disease in patients submitted to angiography. Arq Bras Cardiol, 2006; 87: 260–266. 21. Cho JY, Jeong MH, Ahn Y et al. High lipoprotein(a) levels are associated with long-term adverse outcomes in acute myocardial infarction patients in high Killip classes Korean. Circ J, 2010; 40: 491–498.
22. Al-Mallah MH, Hatahet H, Cavalcante JL et al. Low admission LDL-cho-lesterol is associated with increased 3-year all-cause mortality in patients with non ST segment elevation myocardial infarction. Cardiol J, 2009; 16: 227–233.
23. Nordestgaard BG, Chapman MJ, Ray K et al. for the European Atherosclerosis Society Consensus Panel. Lipoprotein(a) as a cardiovascular risk factor: cur-rent status. Eur Heart J, 2010; 31: 2844–2853.
24. Maeda S, Abe A, Seishima M et al. Transient changes of serum lipoprotein(a) as an acute phase protein. Atherosclerosis, 1989; 78: 145–150. 25. Noma A, Abe A, Maeda S et al. Lp(a): an acute-phase reactant? Chemistry
Adres do korespondencji:
Gamze Babur Guler, Cardiology Clinic, Atatürk State Hospital, Aziziye street, 417 Duzce, Turkey, e-mail: [email protected] Praca wpłynęła: 19.07.2012 r. Zaakceptowana do druku: 21.02.2013 r.
GRACE w określaniu rokowania u chorych
z ostrym zespołem wieńcowym
bez uniesienia odcinka ST
Ekrem Guler
1, Cetin Gecmen
2, Gamze Babur Guler
3, Oguz Karaca
1, Hicaz Zencirkiran Agus
2,
Haci Murat Gunes
2, Ulankhuu Batgerel
2, Ali Elveran
2, Ali Metin Esen
2 1Cardiology Clinic, Medipol University, Istanbul, Turcja2Cardiology Clinic, Kartal Kosuyolu Heart and Research Hospital, Istanbul, Turcja 3Cardiology Clinic, Atatürk State Hospital, Duzce, Turcja
S t r e s z c z e n i e
Wstęp: Wysokie stężenia lipoproteiny (a) [Lp(a)] uważa się za czynnik ryzyka sercowo-naczyniowego związany z przedwczes-nym rozwojem choroby wieńcowej. Nie są znane zależności między stężeniem Lp(a) i systemami oceny ryzyka ani ich wpływ na rokowanie długoterminowe u chorych z ostrymi zespołami wieńcowymi (OZW).
Cel: Celem badania było ustalenie, czy dołączenie stężenia Lp(a) do skali GRACE powoduje zwiększenie wartości progno-stycznej oceny ryzyka w OZW.
Metody: Do tego prospektywnego badania włączono 115 chorych (średnia wieku 64 ± 11 lat) z OZW bez uniesienia odcinka ST (NSTE-ACS). Chorych podzielono w zależności od kwartylu stężenia Lp(a). Statystycznie istotne zmienne w analizie wie-loczynnikowej [hemoglobina, kreatynina, wiek, frakcja wyrzutowa lewej komory, przebyty zawał serca (MI), klasa wg Killipa] włączono do modelu analizy wieloczynnikowej, aby określić niezależne czynniki prognostyczne zdarzeń sercowo-naczyniowych (zgon, ponowna hospitalizacja) z uwzględnieniem lub pominięciem kwartyli stężenia Lp(a) w rocznej obserwacji.
Wyniki: Stwierdzono, że przebyty MI i kwartyl stężenia Lp(a) były niezależnymi czynnikami prognostycznymi zdarzeń sercowo--naczyniowych (odpowiednio OR: 2,969; 95% CI 1,413–6,240 i OR: 6,279; 95% CI 1,363–28,927). Kwartyl stężenia Lp(a) pozostał niezależnym czynnikiem predykcyjnym również po dołączeniu tego parametru do skali ryzyka GRACE (OR: 2,589; 95% CI 1,402–4,780). Wykazano umiarkowanie silną korelację między stężeniami Lp(a) w surowicy i punktacją w skali ryzyka GRACE (r = 0,371; p < 0,001).
Wnioski: Uwzględnienie stężenia Lp(a) w rokowaniu dotyczącym rocznego ryzyka niepożądanych zdarzeń sercowo-naczy-niowych u chorych z NSTE-ACS powoduje zwiększenie wartości prognostycznej w porównaniu z oceną opartą wyłącznie na skali ryzyka GRACE. Połączenie stężenia Lp(a) w surowicy i punktacji w skali GRACE umożliwia lepszą stratyfikację ryzyka w tej grupie chorych.
Słowa kluczowe: lipoproteina (a), ostre zespoły wieńcowe, skala ryzyka GRACE