U. Ü. ZİRAAT FAKÜLTESİ DERGİSİ, 2010, Cilt 24, Sayı 2, 23-36 (Journal of Agricultural Faculty of Uludag University)
Water-Yield Relationships in Deficit Irrigated Potato*
Serhat Ayas
1*, Abdurrahim Korukçu
21 Uludağ Üniversitesi Yenişehir İbrahim Orhan M.Y.O, Yenişehir 2 Uludağ Üniversitesi Ziraat Fakültesi Tarımsal Yapılar ve Sulama Bölümü, Bursa
e-mail: [email protected]
Geliş Tarihi: 23.11.2009; Kabul Tarihi: 23.12.2009
Abstract: This study was conducted in Yenişehir, Bursa between 2004 and 2005 so as to investigate
the effect of water deficiency applied in different growth periods of potato on yield and quality parameters.
In this study, ten different irrigation treatments in four different growth periods (vegetative growth, tuber formation, tuber bulking and ripening) of potato plant (Solanum Tuberosum L, Hermes) were formed and the yield and quality parameters obtained from these treatments were evaluated. Depending on the treatments, the amount of irrigation water applied to the plants ranged between 345 and 585 mm in the first year, and between 286 and 485 mm in the second year and plant water consumption varied between 399 and 655 mm in the first year and between 370 and 646 mm in the second year. Yield, average tuber weight, average tuber diameter, average tuber size, tuber dry matter ratio, tuber starch ratio, the number of tubers per plant, the number of main stems per plant, tuber peel ratio, the rate of marketable tuber ratio and plant height values were found statistically significant.In both of the years, the highest levels of yield were obtained as 32.3 t ha-1 and 35.0 t ha-1 in the
treatments in which full irrigation was conducted in all growth periods, while the lowest levels of yield were obtained as 12.1 t ha-1 and 10.9 ha-1 in the treatments in which 50% water deficiency was
applied in all growth periods respectively.
Water- yield relationship factor (ky) was found as 0.909 on average. The highest values of water use
efficiency (WUE) and irrigation water use efficiency (IWUE) were obtained as 5.23 and 4.35 respectively only in the treatment in which deficit irrigation was given only in ripening period and full irrigation was applied in the other periods.
Key Words: Potato, Deficit Irrigation, Irrigation Water Use Efficiency, Drip Irrigation.
Bursa Koşullarında Kısıntılı Sulanan Patatesin Su–Verim İlişkisi
Özet: Bu çalışma; patatesin farklı bitki gelişme dönemlerinde uygulanan su kısıntılarının verim ve
kalite parametreleri üzerine etkisini araştırmak amacıyla, 2004 ve 2005 yıllarında Bursa-Yenişehir’de yürütülmüştür.
Çalışmada, patates bitkisinin (Solanum Tuberosum L, Hermes) 4 farklı gelişme döneminde (vejetatif gelişme, yumru oluşumu, yumru gelişimi ve olgunlaşma) 10 farklı sulama konusu oluşturulmuş ve bu konulardan elde edilen verim ve kalite parametreleri değerlendirilmiştir. Uygulanan sulama suyu miktarları konulara göre ilk yıl 344.6 ile 584.5 mm, ikinci yıl 285.6 ile 484.5 mm arasında, bitki su tüketimleri ise, ilk yıl 398.5 ile 655.2 mm, ikinci yıl 370.4 ile 646.4 mm arasında değişmiştir. Verim, ortalama yumru ağırlığı, ortalama yumru çapı, ortalama yumru boyu, yumru kuru madde oranı, yumru nişasta oranı, bitki başına yumru adedi, bitki başına ana sap adedi, yumru kabuk oranı, pazarlanabilir yumru oranı, bitki boyu değerleri istatistiksel olarak önemli bulunmuştur. En yüksek verim her iki yılda sırayla 32.29 t ha-1 ve 35.00 t ha-1 ile tüm gelişme dönemlerinde tam sulamanın yapıldığı
uygulamadan, en düşük verim 12.10 t ha-1 ve 10.91 ha-1 ile tüm gelişme dönemlerinde% 50 su
kısıntısının yapıldığı uygulamadan elde edilmiştir. Su verim ilişkisi faktörü (ky) ortalama 0.909 olarak
bulunmuştur. En yüksek su kullanım etkinliği (WUE) ve sulama suyu kullanım etkinliği (IWUE) değerleri sırasıyla 5.23 ve 4.35 ile yalnızca olgunlaşma döneminde su kısıntısının yapıldığı ve diğer dönemlerde tam suyun uygulandığı konudan elde edilmiştir.
Anahtar Kelimeler: Patates, Kısıntılı Sulama, Sulama Suyu Kullanım Etkinliği, Damla Sulama.
Introduction
Commonly-used surface irrigation methods cause low levels of irrigation efficiency along with salinity and drainage problems in growth areas. Irrigation water use efficiency is becoming more and more important and alternative water application methods, such as drip and sprinkler irrigation, can considerably contribute to the improvement of the water applications for agricultural purposes and irrigation efficiency (Sezen, 2005). Moreover, efficient-use of water with the help of drip irrigation system is really important in terms of irrigation programming owing to the fact that deficit irrigation leads to drops in production and water stress, while over-irrigation brings about yield losses (Anonim, 2005).
Turkey’s annual potato production is around 4170000 tones and 1.4% of the total production is produced in Bursa (Tarımsal Yapı ve Üretim, 2005). 65% of this production is freshly consumed in internal market, 15% of it is saved for planting, 3% is exported, 3% of it is processed in industry as chips and French Fries, and the rest 12-14% is lost in storages (Sütveren, 2006).
The potato is pretty sensitive to water deficiency in soil. Optimum yield is obtained when the utilizable water in soil is not over 30-50%. If it drops below 50% the available utilizable moisture, yield may decrease. While the potato is considerably affected by water deficiency during germination, tuber formation and tuber bulking periods, it is less sensitive to water during ripening and early vegetative periods. Among potato irrigation methods, furrow, sprinkler and drip irrigation methods are the most common ones. Under some circumstances, below ground drip irrigation systems may be used. However, furrow and sprinkler irrigation methods are the most common methods. Recently, drip irrigation method has become one of the irrigation methods that are used in potato irrigation(Önder and Önder, 2006). With the drip irrigation method, water and plant nutrient elements can be directly given to the plant through its root area, and this may affect the plant positively and increase the irrigation performance by holding water(Phene and Howell, 1984).
Potato needs frequent-irrigation for a good growth and yield. Yield is considerably affected by storage quality, disease resistance, and the time, amount and frequency of irrigation(Bartoszuk, 1987). Neutronmeter method (CWU) gives fairly reliable results in
Neutronmeter method is becoming more common in the planning of irrigation time and the estimation of plant water consumption since it gives fairly reliable results, calibration curve does not change depending on time and soil characteristics, and soil moisture measurements are done really quickly(Güngör et al., 2004)
There are very few researchers who study the reactions of crop plants, especially the reactions of potato, to water stress (Hassan et al., 2002). The aim of this study is to investigate the water-yield relationship of the potato plant under the conditions in Bursa and the effects of water applied in different amounts on different growth periods of potato and to show the yield and quality difference between the crops that are irrigated with the furrow and sprinkler irrigation methods and the ones irrigated with the drip irrigation method as an alternative to these commonly used methods in the area.
Material and Methods
The research was conducted in Yenişehir, Bursa (40º 15′ 09” N, 29º 38′ 43”E; altitude, 233 m) in 2004 and 2005(Anonim, 2005).
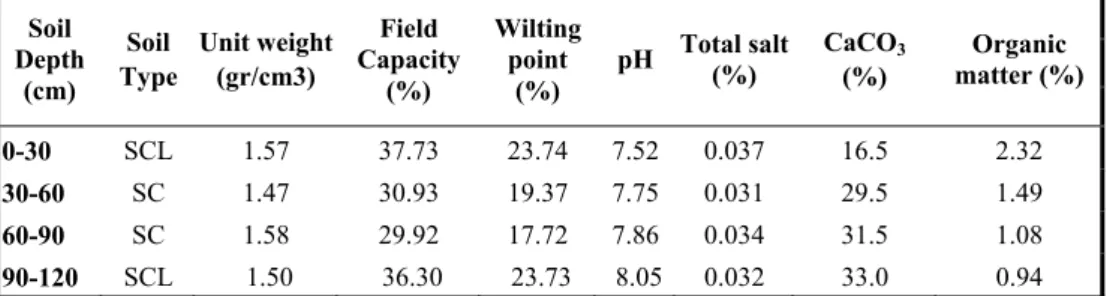
In the area, summers are hot and dry, and winters are cold and wet. Average temperature and rainfall values during the growth period (March-August) were 18.4º and 22.0 mm in the first year of the research, and 20.4º and 43.9 mm in the second year of the research respectively. During the growth period of the potato, minimum and maximum temperature values were 15.5 ºC in April and 22.3 ºC in August in the first year and 7.5 ºC in March and 24.3 ºC in August in the second year respectively. The values of total rainfall were recorded as 161.2 mm in the first year and as 263.1 mm in the second year. The experimental field soil was sandy clay loam (SCL) and its pH level varied between 7.52 and 8.05. Chemical and physical properties of the soil are given in Table 1.
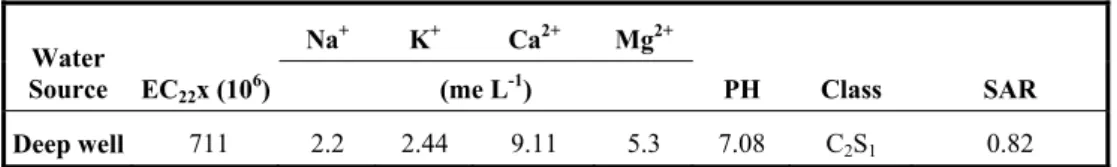
In the research area, a deep well was used as the water source and the water was classified as C1S1 after the analysis conducted.
Table 1. Some of chemical and physical properties of experimental field soil
Soil Depth (cm) Soil Type Unit weight (gr/cm3) Field Capacity (%) Wilting point (%) pH Total salt (%) CaCO3 (%) Organic matter (%) 0-30 SCL 1.57 37.73 23.74 7.52 0.037 16.5 2.32 30-60 SC 1.47 30.93 19.37 7.75 0.031 29.5 1.49 60-90 SC 1.58 29.92 17.72 7.86 0.034 31.5 1.08 90-120 SCL 1.50 36.30 23.73 8.05 0.032 33.0 0.94
15-15-15 NPK fertilizer was applied to experimental plots while the potatoes were being planted, and 75 kg of fertilizer per one thousand square meters were utilized. Rest of the nitrogen that had to be applied was given to the plots in the form of urea together with the irrigation water. The first half of the urea was applied as 25 kg per one thousand square meters (% 46 N) in the tuber formation period and the second half was applied as 25 kg per
a thousand square meters in the tuber bulking period together with the irrigation water. Additionally, in both of the years, 25 kg of magnesium nitrate fertilizer per one thousand square meters (11 – 0 – 0 + 16 MgO - Nitrogen % 11 and MgO % 16) were utilized in the tuber formation and bulking periods in order to support the generative development.
Tubers were transplanted into the experimental plots with a two-line machine at a depth of 10 cm with 40 cm intervals on the same line and with 70 cm intervals between the plant lines on April 3, 2004 in the first year, and on March 21, 2005 in the second year. In the experiments, Solanum Tuberosum L. Hermes, which is a medium –maturing plant and suitable for industry, was used.
The yield and quality parameters of potato are yield, average tuber weight, average tuber diameter, average tuber size, tuber dry matter ratio, tuber starch ratio, number of tubers per plant, number of stems per plant, tuber peel ratio, marketable tuber ratio, and the plant height. Average tuber weight was calculated by weighing 30 tubers in the harvest plot and average tuber diameter and tuber size were found by measuring the weighed potatoes with a diameter scale/ruler and by taking the average of these values. At first, the damp weight of the samples taken from the harvest plot was found, then the dry weight of these samples was found after they were dried at 75 ºC in a drying oven for 48 hours and in the end, tuber dry matter ratio was calculated. Tuber starch ratio was found by having them dissolved in hydraulic acid and by using a poly meter(Özkaya and Kahveci, 1990). The number of stems per plant was calculated by counting the stems and measuring the plant sizes. The number of tubers per plant and the marketable tuber ratio were calculated with the count of the tubers in the harvest plot after the harvest and with the measurement of the tuber diameters of the samples. The ones with a longer diameter than 4,5 cm were considered as a marketable tuber and the number of these tubers was compared with the number of all the tubers harvested.
The experiment coincidence blocks were organized with three repetitions and 10 experiment treatments were randomly distributed. The size of the experiment plots was 28 m2 (4.0 m x 7.0 m). The intervals between the plots were 1.5 m, and blocks were placed
with 2 m intervals. In each plot, the intervals between plant- lines were 0.70 m and the intervals between plants in the same line were 0.40 m. Into each plot, 100 plants were planted. In order to avoid the effect of neighboring plots, only 30 plants in the middle row were harvested.
Ten different irrigation treatments were formed depending on full or deficit irrigation applications in vegetative, tuber formation, tuber bulking and ripening. In the deficit irrigated plots, 50% of the water necessary to increase the available/ existing moisture to the field capacity was given, while in the fully irrigated plots, all of this water was applied. According to this, irrigation treatments were formed like this: K(IIII), K(IIII50), K(III50I),
K(II50II), K(I50III), K(II50I50I50), K(I50II50I50), K(I50I50II50), K(I50I50I50I), K(I50I50I50I50).
In the research, drip irrigation method was used and water was provided from a deep well. The quality properties and chemical composition of the irrigation water used in the experiment are given in Table 2. The water carries low-sodium risk, has a medium EC and is in C2S1 class.
Table 2. Chemical composition of irrigation water used in the experiment
Water
Source EC22x (106)
Na+ K+ Ca2+ Mg2+
(me L-1) PH Class SAR
Deep well 711 2.2 2.44 9.11 5.3 7.08 C2S1 0.82
During the plant growth period, the moisture content of the soil was monitored before and after irrigation with a gravimeter just in case there were neutron escapes in the first layer of the soil which was 30 cm deep, and with a neutron meter in the other layers, once in every 30 cm till 120 cm depth.
Evapotranspiration (EP), was calculated with water balance equation (Eq. 1)(Howell et al., 1995)
ET= P + I - Rf - Dp ± S (1)
In the equation, ET represents the evapotranspiration, P is the total precipitation, I shows the amount of the irrigation water applied during the period (mm), Rf is the amount
of the surface flow (mm), Dp represents the deep drainage (mm) and S is the soil moisture
at the beginning and end of the period (mm/90 cm). In the calculation, because of the fact that water was applied to the plant with the drip irrigation method, surface flow (Rf ) was
excluded and the soil moisture in the layer between 90 and 120 cm depths was taken as the deep drainage (Dp). However, owing to the fact that no variation was monitored in the soil
profile in the layer between 90 and 120 cm depths during the growth period, the deep drainage was taken as “0”.
In this study, Steward model has contributed to define the relationships between yield and ET (Eq.2)(Stewart et al., 1975; Doorenbos, and Kassam, 1979). The equation can be represented as
ETm
ETa
ky
Ym
Ya
1
1
, (2)where Ya is the actual yield (t ha -1 ), Ym is the maximum yield (t ha -1 ), ETa is the actual
evapotranspiration (mm) and ETm is the maximum evapotranspiration (mm). Values of ky
indicate the response factor of potato to deficit irrigation.
The water use efficiency (WUE) was determined to evaluate the productivity of irrigation in the treatments. WUE and irrigation water use efficiency (IWUE) are two terms used to promote the efficient use of irrigation water at the crop production level (Bos, 1980). WUE was calculated as the ratio of yield (YLD) to ETa, given as WUE=YLD/ETa (t
ha-1 mm-1). IWUE was estimated by the following equation;
IRGA
YLD
YLD
tha
IWUE
1
ra infed , (3)where YLD rainfed is the yield obtained from the rainfed treatment or dryland yield and
After the tubers were planted into the soil, the moisture content of the soil till 90 cm depth was increased to the level of field capacity by applying 73 mm irrigation water to all treatments. Irrigation was started on April 25, 2004 in the first year, and on April 17, 2005 in the second year, and it was done every 7 days. In total, 16 and 15 irrigations were applied in the first and second years respectively.
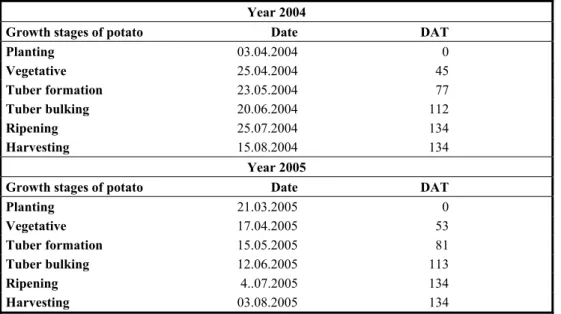
In both years of the study, the data related to the number of the days after the tuber planting, different physiological growth periods and harvesting periods are given in Table 3.
All data were subjected to analysis of variance (ANOVA) for each character using MSTAT-C (version 2.1-Michigan State University 1991) and MINITAB (University of Texas at Austin) software. The significance of irrigation treatments were compared by the Duncan test at the 0.05 and 0.01 probability levels(Steel and Torrie, 1980).
Results and Discussion
In the experimental years, maximum irrigation water was obtained in K(IIII) treatment as 585 – 485 mm and minimum irrigation water was obtained in K(I50I50I50I50) treatment as
345 – 286 mm respectively. Seasonal water consumption of the plant (ETc) increased with
the rise in the amount of the applied irrigation water. In K(IIII) and K(I50I50I50I50)
treatments, it was calculated as 655 – 399 mm in the first year and as 646 – 370 mm in the second year respectively. This result is consistent with the information in the literature data (Erdem et al. 2006; Önder and Önder, 2006; Ayla, 1989; Faberio et al., 2001; Ferreıra and Carr, 2002; Shock et al., 2003; Starr et al. 2008; Ünlü, 2006). The amounts of the applied irrigation water and yield values are given in Table 4.
Table 3. Growth stages of potato in all treatments.
Year 2004
Growth stages of potato Date DAT
Planting 03.04.2004 0 Vegetative 25.04.2004 45 Tuber formation 23.05.2004 77 Tuber bulking 20.06.2004 112 Ripening 25.07.2004 134 Harvesting 15.08.2004 134 Year 2005
Growth stages of potato Date DAT
Planting 21.03.2005 0 Vegetative 17.04.2005 53 Tuber formation 15.05.2005 81 Tuber bulking 12.06.2005 113 Ripening 4..07.2005 134 Harvesting 03.08.2005 134
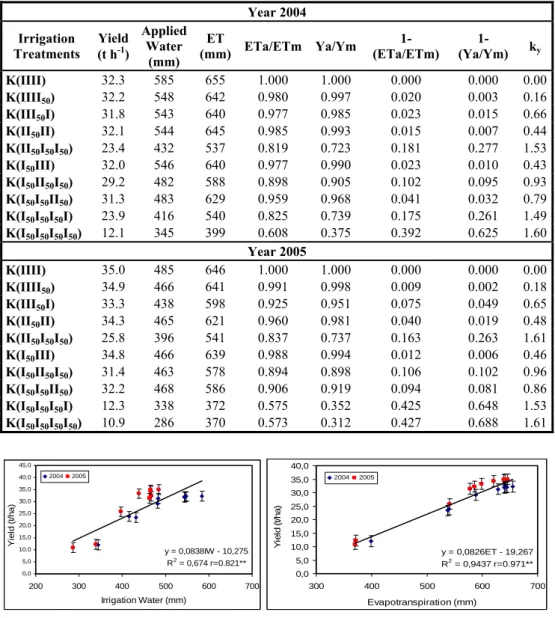
Linear relationships were observed between the crop evapotranspiration (ETc) with
yield (Ya) and irrigation water (IW) with yield (Ya). The equation for the relationship was Ya = 0.0826 ETc – 19.267 and R2 = 0.94 and Ya = 0.08381IW – 10.275 (Figure 1 and 2).
Table 4. Relationship between the decrease in relative water use and decrease in relative
yield and yield response factor for lettuce irrigated by a drip system Year 2004 Irrigation Treatments (t hYield -1) Applied Water (mm) ET
(mm) ETa/ETm Ya/Ym (ETa/ETm) 1- (Ya/Ym) 1- ky
K(IIII) 32.3 585 655 1.000 1.000 0.000 0.000 0.00 K(IIII50) 32.2 548 642 0.980 0.997 0.020 0.003 0.16 K(III50I) 31.8 543 640 0.977 0.985 0.023 0.015 0.66 K(II50II) 32.1 544 645 0.985 0.993 0.015 0.007 0.44 K(II50I50I50) 23.4 432 537 0.819 0.723 0.181 0.277 1.53 K(I50III) 32.0 546 640 0.977 0.990 0.023 0.010 0.43 K(I50II50I50) 29.2 482 588 0.898 0.905 0.102 0.095 0.93 K(I50I50II50) 31.3 483 629 0.959 0.968 0.041 0.032 0.79 K(I50I50I50I) 23.9 416 540 0.825 0.739 0.175 0.261 1.49 K(I50I50I50I50) 12.1 345 399 0.608 0.375 0.392 0.625 1.60 Year 2005 K(IIII) 35.0 485 646 1.000 1.000 0.000 0.000 0.00 K(IIII50) 34.9 466 641 0.991 0.998 0.009 0.002 0.18 K(III50I) 33.3 438 598 0.925 0.951 0.075 0.049 0.65 K(II50II) 34.3 465 621 0.960 0.981 0.040 0.019 0.48 K(II50I50I50) 25.8 396 541 0.837 0.737 0.163 0.263 1.61 K(I50III) 34.8 466 639 0.988 0.994 0.012 0.006 0.46 K(I50II50I50) 31.4 463 578 0.894 0.898 0.106 0.102 0.96 K(I50I50II50) 32.2 468 586 0.906 0.919 0.094 0.081 0.86 K(I50I50I50I) 12.3 338 372 0.575 0.352 0.425 0.648 1.53 K(I50I50I50I50) 10.9 286 370 0.573 0.312 0.427 0.688 1.61 y = 0,0838IW - 10,275 R2 = 0,674 r=0.821** 0,0 5,0 10,0 15,0 20,0 25,0 30,0 35,0 40,0 45,0 200 300 400 500 600 700 Irrigation Water (mm) Yi el d ( t/ h a ) 2004 2005 y = 0,0826ET - 19,267 R2 = 0,9437 r=0.971** 0,0 5,0 10,0 15,0 20,0 25,0 30,0 35,0 40,0 300 400 500 600 700 Evapotranspiration (mm) Yi e ld ( t/ h a ) 2004 2005
Figure 1. The relationship between crop
evapotranspiration and yield
Figure 2. The relationship between
According to the research results, irrigation applications significantly affected the yield (Fig. 2) and when they were evaluated as the averages of both of the years, the highest values of yield were calculated as 33.6 t ha-1 and 33.6 t ha-1 in K(IIII) and K(IIII50)
treatments respectively (Table 5).
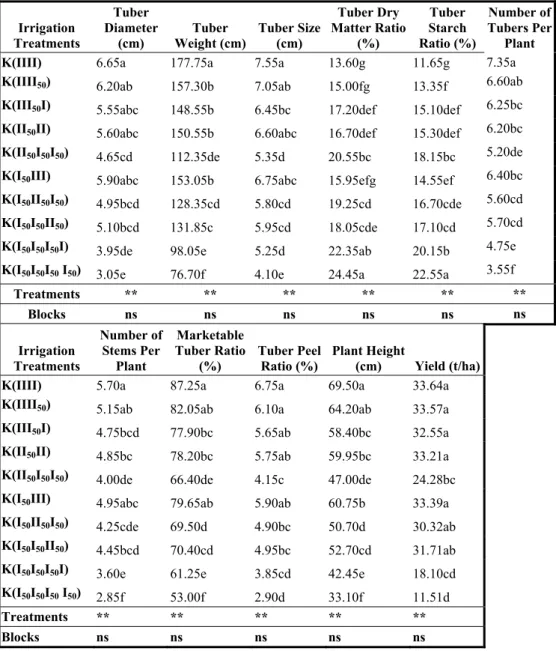
Table 5. Effects of irrigation treatments on potato marketable parameters
Irrigation Treatments
Tuber Diameter
(cm) Weight (cm)Tuber Tuber Size (cm)
Tuber Dry Matter Ratio (%) Tuber Starch Ratio (%) Number of Tubers Per Plant K(IIII) 6.65a 177.75a 7.55a 13.60g 11.65g 7.35a
K(IIII50) 6.20ab 157.30b 7.05ab 15.00fg 13.35f 6.60ab
K(III50I) 5.55abc 148.55b 6.45bc 17.20def 15.10def 6.25bc
K(II50II) 5.60abc 150.55b 6.60abc 16.70def 15.30def 6.20bc
K(II50I50I50) 4.65cd 112.35de 5.35d 20.55bc 18.15bc 5.20de
K(I50III) 5.90abc 153.05b 6.75abc 15.95efg 14.55ef 6.40bc
K(I50II50I50) 4.95bcd 128.35cd 5.80cd 19.25cd 16.70cde 5.60cd
K(I50I50II50) 5.10bcd 131.85c 5.95cd 18.05cde 17.10cd 5.70cd
K(I50I50I50I) 3.95de 98.05e 5.25d 22.35ab 20.15b 4.75e
K(I50I50I50 I50) 3.05e 76.70f 4.10e 24.45a 22.55a 3.55f
Treatments ** ** ** ** ** ** Blocks ns ns ns ns ns ns Irrigation Treatments Number of Stems Per Plant Marketable Tuber Ratio (%) Tuber Peel Ratio (%) Plant Height (cm) Yield (t/ha)
K(IIII) 5.70a 87.25a 6.75a 69.50a 33.64a
K(IIII50) 5.15ab 82.05ab 6.10a 64.20ab 33.57a
K(III50I) 4.75bcd 77.90bc 5.65ab 58.40bc 32.55a
K(II50II) 4.85bc 78.20bc 5.75ab 59.95bc 33.21a
K(II50I50I50) 4.00de 66.40de 4.15c 47.00de 24.28bc
K(I50III) 4.95abc 79.65ab 5.90ab 60.75b 33.39a
K(I50II50I50) 4.25cde 69.50d 4.90bc 50.70d 30.32ab
K(I50I50II50) 4.45bcd 70.40cd 4.95bc 52.70cd 31.71ab
K(I50I50I50I) 3.60e 61.25e 3.85cd 42.45e 18.10cd
K(I50I50I50 I50) 2.85f 53.00f 2.90d 33.10f 11.51d
Treatments ** ** ** ** **
Blocks ns ns ns ns ns
When the full irrigation treatment was compared with the deficit irrigation treatments, yield drops/losses were measured as 0.2%, 3.3%, 1.3%, 38.6%, 0.7%, 10.9%, 6.1%, 85.9% and 192.3%. In a similar study, it was found out that yield drops/losses are caused by deficit irrigation in different growth periods of the potato(Hassan et al., 2002). In the study, it was found out that that deficit irrigation has a significant effect on yield and quality parameters at P<0.01 level. These results are consistent with the information in the literature data (Önder et al., 2005; Haverkort et al., 1990; Karafyllidis et al. 1996; Lynch et al., 1995; MacKerron and Jefferies, 1986; MacKerron and Jefferies, 1988; Ojala, 1990; Patel, and Rajput, 2007; Yuan et al., 2003).
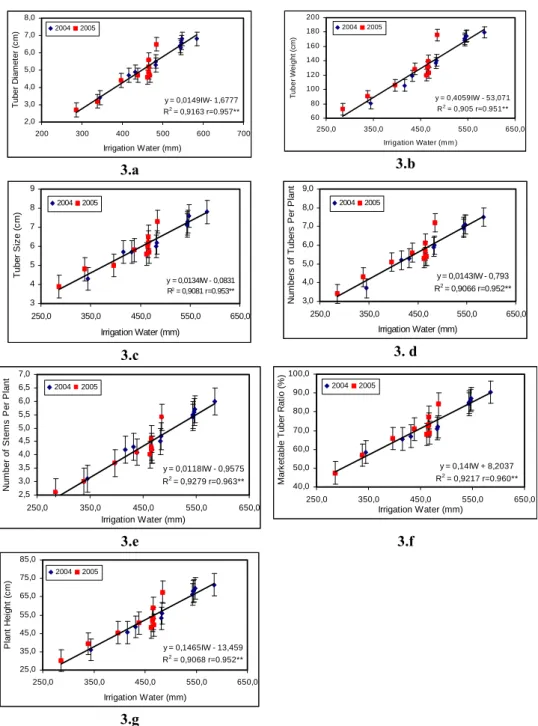
While a positive linear relationship was found between the amount of irrigation water and the tuber diameter, tuber weight, tuber size, number of tubers per plant, number of stems per plant, marketable tuber ratio, tuber peel ratio and plant height; a negative linear relationship was found between the amount of irrigation and tuber dry matter and tuber starch ratio.
According to the relationship, these results were found: tuber diameter = 0.0149IW + 1.6777and R2 = 0.92 (Fig. 3.a.), Tuber weight = 0.4059IW – 53.071 and R2 = 0.91 (Fig.
3.b.), tuber size = 0.0134IW + 0.0831 and R2 = 0.91 (Fig. 3.c.), Number of Tubers Per
Plant = 0.0143IW + 0.793 and R2 = 0.91 (Fig. 3.d.), Number of Stems Per Plant =
0.0118IW + 0.9575 and R2 = 0.93 (Fig. 3.e.), marketable plant ratio = 0.14IW + 8.2037 and R2 = 0.92 (Fig. 3.f.), tuber peel ratio = 0.0157IW – 2.1089 and R2 = 0.92 (Fig. 3.g.), plant
height = 0.1465IW – 13.459 and R2 = 0.91 (Fig. 3.h.), Tuber Dry Matter Ratio =
-0.0481IW + 40.436 and R2 = 0.94 (Fig. 3.i.) and Tuber starch Ratio = -0.0469IW + 38.035
y = 0,0149IW- 1,6777 R2 = 0,9163 r=0.957** 2,0 3,0 4,0 5,0 6,0 7,0 8,0 200 300 400 500 600 700 Irrigation Water (mm) T uber D iam et er (c m ) 2004 2005 3.a y = 0,4059IW - 53,071 R2 = 0,905 r=0.951** 60 80 100 120 140 160 180 200 250,0 350,0 450,0 550,0 650,0 Irrigation Water (m m ) T u ber W e ig ht ( c m ) 2004 2005 3.b y = 0,0134IW - 0,0831 R2 = 0,9081 r=0.953** 3 4 5 6 7 8 9 250,0 350,0 450,0 550,0 650,0 Irrigation Water (mm) T uber S iz e ( c m ) 2004 2005 3.c y = 0,0143IW - 0,793 R2 = 0,9066 r=0.952** 3,0 4,0 5,0 6,0 7,0 8,0 9,0 250,0 350,0 450,0 550,0 650,0 Irrigation Water (mm) N u m b e rs o f T u ber s P e r P lant 2004 2005 3. d y = 0,0118IW - 0,9575 R2 = 0,9279 r=0.963** 2,5 3,0 3,5 4,0 4,5 5,0 5,5 6,0 6,5 7,0 250,0 350,0 450,0 550,0 650,0 Irrigation Water (mm) N u m b e r o f Ste m s Pe r Pl a n t 2004 2005 y = 0,14IW + 8,2037 R2 = 0,9217 r=0.960** 40,0 50,0 60,0 70,0 80,0 90,0 100,0 250,0 350,0 450,0 550,0 650,0 Irrigation Water (mm) M a rk et abl e T u ber R a ti o ( % ) 2004 2005 3.e 3.f y = 0,1465IW - 13,459 R2 = 0,9068 r=0.952** 25,0 35,0 45,0 55,0 65,0 75,0 85,0 250,0 350,0 450,0 550,0 650,0 Irrigation Water (mm) Pl a n t H e ig h t ( c m ) 2004 2005 3.g
Figure 3. Relationship between applied of irrigation water and tuber diameter, tuber
weight, tuber size, number of tubers per plant, number of stems per plant, marketable tuber ratio, plant height tuber peel ratio, tuber dry matter ratio, tuber starch ratio.
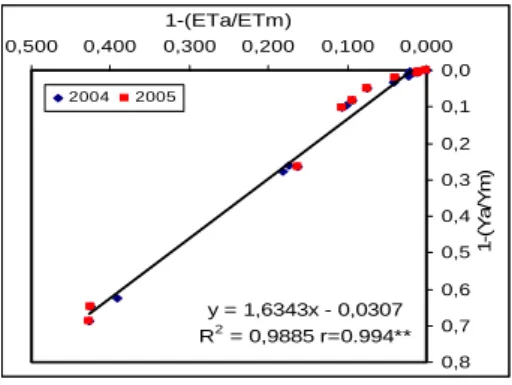
Crop yield response factor (ky)
Crop yield response factor (ky), demonstrates a linear relationship between relative crop evapotranspiration and relative yield decrease. It shows the response of the yield to the relative crop evapotranspiration. In other words, it explains the drops in the yield as a result of each level of deficiency in water consumption. Seasonal crop yield factor (ky) was calculated as 0.909 (Figure 4). y = 1,6343x - 0,0307 R2 = 0,9885 r=0.994** 0,0 0,1 0,2 0,3 0,4 0,5 0,6 0,7 0,8 0,000 0,100 0,200 0,300 0,400 0,500 1-(ETa/ETm) 1-(Y a /Y m ) 2004 2005
Figure 4. Relationship between relative yield decrease and relative crop evapotranspiration
crop evapotranspiration for potato throughout the total growing season
With the rise in the water deficiency, ky value increased. This result is found a bit low in terms of seasonal crop yield factors in the individual growth periods of the plants, while it is consistent with the crop yield factors in the individual growth/ development factors given in literature(Doorenbos and Kassam, 1979). The difference between these two results may be attributed to the differences between the experimental, climatic and soil conditions.
Water use efficiencies
The average WUE and IWUE values of the years, when the study was conducted, were found different depending on the treatments (Table 6). The highest WUE and IWUE was obtained from K(IIII), 5.23 and 4.35 kg.mm-1 respectively and the lowest value was
obtained from K(I50I50I50I50). These results are similar to the literature data(Önder et al.,
2005). In other words, the highest yield was obtained and the most water was saved with deficit irrigation only in the ripening period of the potato.
Table 6. Total water use efficiency (WUE) and irrigation water use efficiency (IWUE)
values for the potato irrigated by a drip system at different irrigation treatments. Irrigation
Treatments (t hYield -1) Irrigation Water (mm) (mm) ET kg.mmIWUE -1 kg.mmWUE -1
K(IIII) 33.65 534.5 650.8 4.14 5.17 K(IIII50) 33.57 506.6 641.3 4.35 5.23 K(III50I) 32.55 490.8 619.1 4.29 5.17 K(II50II) 33.21 504.4 633.1 4.30 5.19 K(II50I50I50) 24.58 414.2 539.0 3.10 4.37 K(I50III) 33.39 505.7 639.3 4.33 5.17 K(I50II50I50) 30.32 472.2 583.0 4.01 5.08 K(I50I50II50) 31.71 475.4 607.0 4.29 5.12 K(I50I50I50I) 18.10 377.1 456.2 1.69 3.75 K(I50I50I50I50) 11.51 315.1 384.5 0.00 2.99 Conclusion
In this study, it was found out that irrigation applications significantly affects yield, average tuber weight, average tuber size, tuber dry matter ratio, tuber starch ratio, number of tubers per plant, number of stems per plant, tuber peel ratio, marketable tuber ratio and plant size. As the average of the experimental years, the highest yield was 33.7 t h-1 and it
was obtained in K(IIII) treatment. The lowest yield was obtained as 11.5 h-1 in K(I
50I50I50I50)
treatment. Yield dropped significantly as a result of the decrease in the irrigation water. Relative yield decreases in the irrigation treatments were 0.2, 3.3, 1.3, 38.6, 0.7, 10.9, 6.1, 85.9 and %192.3 respectively. IWUE value of K(IIII50) treatment was the highest of all the
treatments. When there was water deficiency, the most suitable treatment was K(IIII50)
treatment, in which deficit irrigation was applied as the water application level only in ripening period with drip irrigation.
References
Anonim, 2005. Bursa-Yenişehir Meteoroloji İstasyonu Yıllık Raporu, Bursa.
Ayla, Ç. 1989. Bolu Ovasında Patatesin Azot-Su İlişkileri ve Su Tüketimi. TOPRAKSU Genel Müdürlüğü Merkez Araştırma Enstitüsü Yayın. Ankara. Gen. No: 168, Rap.No: 55, 69s.
Bartoszuk, W. 1987. Decrease in potato yield resulting from water deficit during the growing season. Potato Abstract, 15 (1) (Abstract no: 194).
Bos, M.G. 1980. Irrigation Efficiencies at Crop Production Level. ICID Bull.29: 18-25. Doorenbos, J. and A.H. Kassam. 1979. Yield Response to Water. FAO Irrigation and
Erdem, T., Y. Erdem, A.H. Orta and H. Okursoy. 2006. Water-yield relationships of potato under different irrigation methods and regimens. Sci. Agric. (Pracicaba Brazil), 63(3):226-231.
Faberio, C., F.M.S. Olalla and J.A. Juan. 2001. Yield size of deficit irrigated potatoes. Agricultural Water Management, Vol. 48, p.255-266.
Ferreıra, T.C. and M.K.V. Carr. 2002. Response of potatoes (Solanum tuberasum L.) to irrigation and nitrogen in a hot, dry climate : I. water use. Field Crops Reseach, Vol. 78, p. 51-64.
Güngör. Y., Z. Erözel and O. Yıldırım 2004. Sulama. Ankara Üniversitesi Ziraat Fakültesi Tarımsal Yapılar ve Sulama Bölümü. Ankara.
Hassan, A.A., A.A. Sarkar, M.H. Ali and N.N. Karim. 2002. Effect of deficit irrigation at different growth stages on the yield of potato. Pakistan Journal of Biological Sciences, 5(2): 128-134.
Haverkort, A.J., M. Van de Ward and K.B.A. Bodlaeader. 1990. The effect of early drought stress on numbers of tubers and stolons of potato in controlled and field conditions. Potato Res., Vol. 33, p. 89-96.
Howell, T.A., A. Yazar, A.D. Schneıder, D.A. Dusek and K.S. Copeland. 1995. Yield and water use efficiency of corn in response to lepa irrigation. Transaction of ASAE, Vol. 38(6) 1737-1747.
Karafyllidis, D.I., N. Stavropoulos and D. Georgakis. 1996. The effect of water stress on the yielding capacity of potato crops and subsequent performance of seed tubers. Potato Res., Vol. 39, p. 153-163.
Krüger E., G., Schmidt and U. Brucker. 1999. Scheduling strawberry irrigation besed upon tansiometer measurement and a climatic water balance model. Scienta Horticulturea, 81:409-424.
Lynch, D.R., N. Foroud, G.C. Kozub and B.C. Farries. 1995. The effect of moisture stress at three growth stages on the yield, components of yield and processing quality of eight potato varieties. Amer. Potato. J., 72, p. 375-386.
MacKerron, D.K.L. and R.A. Jefferies. 1986. The influence of early soil moisture stress on tuber numbers in potato. Potato Res., Vol. 29, p. 299-312.
MacKerron, D.K.L. and R.A., Jefferies, 1988. The distribution of tuber sizes in droughted and irrigated crops of potato. I. Observations on the effect of water stress on graded yields from different cultivars. Potato Res., Vol. 31, p. 269-278.
Ojala, J.C., J.C. Stark and G.E. Kleinkopf. 1990. Influence of irrigation and nitrogen management on potato yield and quality. Am. Potato J., Vol. 67, p. 29-43.
Önder, S., M.E. Çalışkan, D. Önder and S. Çalışkan. 2005. Different irrigation methods and water stress effects on potato yield and yield components. Agricultural Water Management, Vol.73, p. 73-86.
Önder, S. and D. Önder. 2006. Patateste su-verim ilişkileri. 4. Ulusal Patates Kongresi, Niğde. s. 194 – 201.
Özkaya, H. and B. Kahveci. 1990. Tahıl ve Ürünleri Analiz Yöntemleri, Gıda Teknolojisi Derneği Yayınları No:14, Ankara.152.s
Patel, N. and T.B.S. Rajput. 2007. Effect of drip tape placement depth and irrigation level on yield of potato. Agricultural Water Management, 88: 209-223.
Phene, C.J. and T.A. Howell. 1984. Soil sensor control of high frequency irrigation. Trans. ASAE, 27 (2). 392-396.
Sezen, S.M., 2005. Effects of drip irrigation management on yield and quality of field grown green beans. Agricultural Water Management, 71(2005)243-255.
Shock, C.C., E.B.G. Feıbert and L.D. Saunders. 2003. “Umatilla Russet” and “Russet Legend” potato yield and quality response to irrigation. Horticultural Science, Vol. 38, p.1117-1121.
Starr, G.C., D. Rowland, T.S. Griffın and O.M. Olanya. 2008. Soil water in relation, water uptake and potato yield in a humid climate. Agricultural Water Management, 95: 292-300.
Steel, R.G.D. and J.H. Torrie. 1980. Principles and Procedures of Statistics. A Biometrical Approach. McGraw – Hill, NewYork, pp 186-187.
Stewart, J.I., R.D. Misra, W.O. Pruitt and R.M. Hagan. 1975. Irrigating corn and sorgum with a deficient water supply. Trans. ASAE, 18, 270-280.
Sütveren, H., 2006. Patatesin Sanayideki Yeri. Yayınlanmamış Derleme Makale. Kraft Gıda Sanayi ve Ticaret A.Ş. Nevşehir.
Tarımsal Ekonomi Araştırma Enstitüsü, 2005. Sayı:2 Nüsha:8 ISSN:1303-8346 http://www.aeri.org.tr
Ünlü, M., R. Kanber, U. Şenyiğit, H. Onaran and K. Diker. 2006. Trickle and sprinkler irrigation of potato (Solanum tuberosum L.) in the middle Anatolian region in Turkey. Agricultural Water Management, 79: 43-71.
Yuan, B.Z., S. Nishiyama and Y. Kang. 2003. Effects of different irrigation regimes on the growth and yield of drip-irrigated potato. Agricultural Water Management, Vol. 63, p. 153-167.