http://journals.tubitak.gov.tr/biology/ © TÜBİTAK
doi:10.3906/biy-1412-82
Epigallocatechin 3-gallate applications on HT-29 and MCF-7 cell lines and
evaluation of tumor suppressor gene methylation
Yunus Kasım TERZİ1, Özge ÖZER KAYA1, Özlem DARCANSOY İŞERİ2, Zerrin ÇELİK1, Feride İffet ŞAHİN1,* 1Department of Medical Genetics, Faculty of Medicine, Başkent University, Ankara, Turkey
2Institute of Transplantation and Gene Sciences, Başkent University, Ankara, Turkey
1. Introduction
EGCG is the major component of catechins found in green tea and exists in four active forms: (1)-epigallocatechin-3-gallate (EGCG), (2)-epigallocatechin (EGC), (3)-epicatechin-3-gallate (ECG), and (4)-epicatechin (EC) (Zeng et al., 2014). Catechins, which are polyphenols, constitute nearly 30%–40% of the dry weight of green tea (Lecumberri et al., 2013; Zeng et al., 2014), which is one of the most popular beverages in the world, after water. EGCG is an important compound, as it has antitumor activity. It exerts this activity by binding to the active center of DNA methyltransferase-1 (DNMT1) enzyme, as previously demonstrated by in vitro activity assays (Lee et al., 2005; Pandey et al., 2010). Thus, it is involved in the changes in gene expression by an epigenetic mechanism decreasing DNA hypermethylation and is a potential anticancer drug for cancer prevention or treatment (Fang et al., 2003; Chen et al., 2011).
Cancer development and progression is a multistep process evolving through both genetic and epigenetic mechanisms. The loss of function of tumor suppressor genes is a fundamental step that is quite well known in cancer development. Aberrant promoter methylation, especially hypermethylation of tumor suppressor genes, is an important mechanism of epigenetic silencing (Baylin
and Herman, 2000; Brooks, 2009; Nystrom and Mutanen, 2009; Arends, 2013). Nearly half of all known tumor suppressor genes might be inactivated by hypermethylation (Arai et al., 2006).
Breast and colorectal cancers are common cancers and constitute a major public health problem; thus, they are important targets for research and the implementation of treatment (Cho et al., 2010; Colussi et al., 2013). It has been reported that CpG island methylation of tumor-related genes is an important event in both the pre-invasive and progression stages of breast cancer (Park et al., 2011). Colorectal cancer is another common cause of morbidity and mortality, and dietary components play an important role in the pathogenesis and, therefore, prevention of this cancer (Singh and Fraser, 1998). In recent years, specific nutritional components, such as catechins, have been reported to be bioactive molecules acting on cancer cells (Fang et al., 2003; Li and Tollefsbol, 2010; Nandakumar et al., 2011).
In this study, considering (1) EGCG is a potential anticancer drug, (2) it binds to DNA methyltransferase enzyme, (3) promoter methylation of tumor suppressor genes is an important mechanism of epigenetic silencing, and (4) epigenetic silencing is important to the carcinogenesis of adenocarcinomas, we aimed to evaluate Abstract: Epigallocatechin 3-gallate (EGCG) is an antitumor molecule and shows this activity by binding to the active center of a
methyltransferase enzyme (DNMT1). The methylation of DNA sequences of tumor suppressor and DNA repair genes is observed in different stages of carcinogenesis. In this study, we analyzed the effect of EGCG on the methylation status of 25 tumor suppressor genes in cancer cell lines HT-29 and MCF-7. HT-29 and MCF-7 cells were incubated with 10 µM, 20 µM, and 50 µM and 1 µM, 5 µM, and 10 µM EGCG for 48 h, respectively. We found promoter hypermethylation of (1) CDH13, GATA5, and RARβ genes in MCF-7 cell line and (2) RARβ, ESR1, PAX6, WT1, CADM1, CHFR, CDH13, and GATA5 genes in HT-29 cell line. However, (3) after EGCG application, no changes in methylation status were detected in our samples. Our results suggest that methylation status of tumor suppressor genes did not change with different EGCG doses.
Key words: Epigallocatechin 3-gallate, epigenetics, methylation, breast cancer, colorectal cancer
Received: 23.12.2014 Accepted/Published Online: 16.05.2015 Printed: 30.09.2015 Research Article
the effects of EGCG on the methylation status of 25 tumor suppressor gene promoters in colorectal (HT-29) and breast cancer (MCF-7) cell lines. Methylation-specific multiplex ligation probe amplification (MS-MLPA) was used for the analysis that determines both the methylation status of genes of interest and the copy number changes. We tested the effects of different EGCG concentrations on the methylation status of tumor suppressor gene promoters in HT-29 and MCF-7 cell lines and also assayed effects of these application concentrations on cell proliferation. 2. Materials and methods
2.1. Cell lines
Human colon adenocarcinoma (designation: HT-29, ATCC number: HTB-38) and human breast adenocarcinoma (designation: MCF-7, ATCC number: HTB-22) cell lines were obtained from the American Type Tissue Culture Collection (ATCC). Cells were cultured in RPMI 1640 supplemented with 10% fetal bovine serum, 2 mM L-glutamine, penicillin (100 IU/mL), and streptomycin (100 μg/mL) (media and serums from Biochrom AG, Berlin, Germany). All cells were cultured at 37 °C in the humidified atmosphere of a 5% CO2 incubator (Heraeus, Hanau, Germany).
2.2. EGCG treatment
Commercially available (−)-epigallocatechin gallate was used in the experiments (Sigma-Aldrich, St Louis, MO, USA). Powdered EGCG was dissolved in water to prepare 5 mg/mL stock solution and stored at –20 °C. For each cell line (MCF-7 and HT-29), 2 million cells were transferred to 9 different 25 cm2 tissue culture flasks. Three of these flasks were assigned as the control group, and EGCG was not applied to these flasks. The other 6 flasks were used in duplicate for EGCG application. HT-29 and MCF-7 cells were incubated with 10 µM, 20 µM, and 50 µM (Zhang, 2012) and 1 µM, 5 µM, and 10 µM (Lee et al., 2005; Hsu et al., 2011) EGCG, respectively for 48 h, as defined by previous studies. At the end of 48 h for all groups, DNA samples were extracted from both untreated control cells and EGCG-treated cells by using QIAamp DNA mini kit (Qiagen, Carlsbad, Germany), according to the manufacturer’s instructions.
2.3. MS-MLPA analysis
SALSA MLPA kit ME002-B1 Tumor Suppressor 2 kit (MRC Holland, Amsterdam, the Netherlands) was utilized to analyze the methylation status of promoter regions of 25 different tumor suppressor genes (Table). MLPA reactions were performed according to the manufacturer’s instructions. Briefly, 250 ng of genomic DNA extracted from control and EGCG applied cell lines in 5 µL of TE buffer (10 mM Tris-HCl, pH 8.2; 0.1 mM EDTA) was denatured. Oligonucleotide probes were hybridized to the genomic DNA for 16 h. Following the
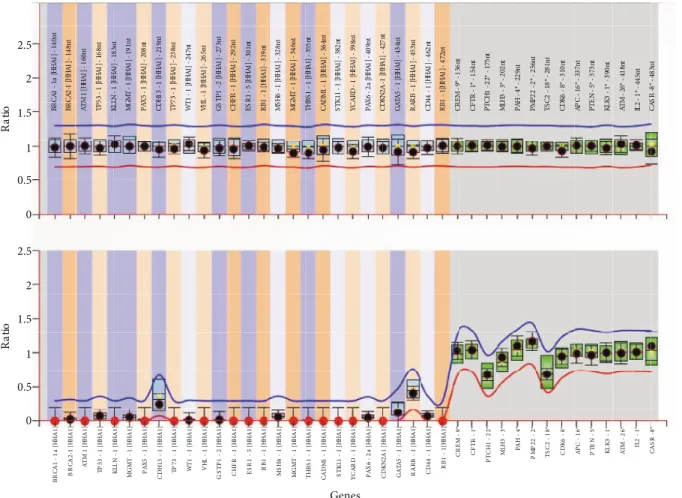
hybridization reaction, hybridized probes were ligated via ligation reaction. All reaction tubes were divided into two tubes, one for copy number analyses and the second for methylation analyses. To determine the methylation status of the promoter regions, a restriction endonuclease reaction was performed by using HhaI enzyme. As a methylation-sensitive restriction endonuclease, HhaI can only digest an unmethylated DNA target. Following HhaI digestion, PCR reaction was performed in all tubes. PCR products were denatured and loaded onto an ABI 3500 capillary electrophoresis system (Applied Biosystems, Foster City, CA, USA). Band analysis was performed by GeneMapper software (Applied Biosystems), and Coffalyser Net program (MRC Holland) was used to determine copy number analysis and methylation status of the EGCG-treated and untreated samples. The assay uses 14 reference probes (Figures 1 and 2; last 14 data points). The undigested PCR runs were analyzed to obtain the copy number ratio in samples. The ratios were calculated by dividing the peak area obtained from each PCR reaction by the sum of the area of reference probes (Figures 1A and 2A). Fragment analysis of digested samples was performed to determine unmethylated regions. Since reference probes do not have HhaI restriction sites, the total of peak area values obtained from reference probes served as controls to methylated regions that were not digested by the enzyme. The methylation ratio was obtained by dividing each digested probe’s peak area by the sum of the area of reference probe peaks (Figures 1B and 2B). Differences in methylation status between EGCG-treated and untreated cells were compared using independent samples t-test. SPSS version 20.0 (IBM Corp., Armonk, NY, USA) was used for statistical analysis, and P < 0.05 was considered significant.
2.4. Assay for cell proliferation
The effects of EGCG application on the proliferation of MCF-7 and HT-29 cells were colorimetrically tested by biochemical reduction of MTT (3-(4,5-dimethyl-2-thiazol-2-yl)-2,5-diphenyl-2H-tetrazolium bromide) (Sigma-Aldrich). Briefly, EGCG was serially diluted in half from 400 to 1 µM in 96-well microtiter plate rows, except for the untreated cells and medium control wells. Plates were incubated for 48 h. The inhibition of cell proliferation was determined after 4 h of incubation with 20 µL of MTT (5 mg/mL). The optical density of the sodium dodecyl sulfate (10%) (Sigma-Aldrich) solubilized tetrazolium salt was measured at 540 nm with an ELISA reader (Biotek Instrument ELx800, Winooski, VT, USA). Inhibition of cell proliferation and inhibitory concentration 50 (IC50) values (EGCG concentrations at which 50% of cells are viable) were calculated from the logarithmic trend lines of the proliferation versus EGCG concentration graphs. Data of the triplicate experiments are expressed as mean ±
standard error of means (SE). Differences in IC50 between cell lines were statistically evaluated by independent samples t-test at the 0.05 level using SPSS version 20.0 (IBM Corp., USA).
3. Results
3.1. Effects of EGCG on the methylation status of tumor suppressor genes in MCF-7 and HT-29
Copy number analysis of the undigested (Figures 1A and 1B) MCF-7 and HT-29 samples demonstrated that 25 tumor suppressor genes (Table) had neither duplications
nor deletions in their promoter regions. Similarly, there were no changes in the copy numbers of the EGCG-treated samples. Methylation status of the promoter regions of 25 tumor suppressor genes was detected by fragment analysis of HhaI-digested samples. Each digested probe’s peak area was divided by the combined peak areas of the control probes lacking a HhaI restriction site, and methylation ratios were obtained (Figures 1B and 2B). Accordingly, promoter regions of CDH13, GATA5, and RARβ genes were found to be hypermethylated in all samples from the MCF-7 cell line, either EGCG-treated or untreated (Figure Table. List of the tumor suppressor genes in which the methylation status of promoter regions was analyzed. Genes are listed according
to their chromosomal locations and nominated using the Universal Protein Resource (UniProt) catalog of information on proteins (http://www.uniprot.org).
UniProt number Gene alias Gene name Chromosomal location
Q15350 TP73 Tumor protein p73 1p36.32
P52701 MSH6 DNA mismatch repair protein 2p16.3
P10826 RARB Retinoic acid receptor beta 3p24.2
P40337 VHL Von Hippel–Lindau disease tumor suppressor 3p25.3
P03372 ESR1 Estrogen receptor 6q25.1
Q02548 PAX5 Paired box protein 9p13.2
P42771 CDKN2A Cyclin-dependent kinase inhibitor 2A 9p21.3
B2CW77 KLLN Killin 10q23.31
P16455 MGMT Methylated-DNA--protein-cysteine methyltransferase 10q26.3
P16070 CD44 CD44 antigen 11p13
P26367 PAX6 Paired box protein 11p13
P19544 WT1 Wilms tumor protein 11p13
P09211 GSTP1 Glutathione S-transferase P 11q13.2
Q13315 ATM Serine-protein kinase 11q22.3
Q9BY67 CADM1 Cell adhesion molecule 1 11q23.3
Q96EP1 CHFR E3 ubiquitin-protein ligase 12q24.33
P51587 BRCA2 Breast cancer type 2 susceptibility protein 13q13.1 P06400 RB1 Retinoblastoma-associated protein 13q14.2
P07996 THBS1 Thrombospondin-1 15q14
Q9ULZ3 PYCARD Apoptosis-associated speck-like protein containing a CARD 16p11.2
R55290 CDH13 Cadherin-13 16q23.3
P38398 BRCA1 Breast cancer type 1 susceptibility protein 17q21.31
P04637 TP53 Cellular tumor antigen p53 17p13.1
Q15831 STK11 Serine/threonine-protein kinase 19p13.3
1B). However, we did not detect a statistically significant difference between treated and untreated groups. RARβ,
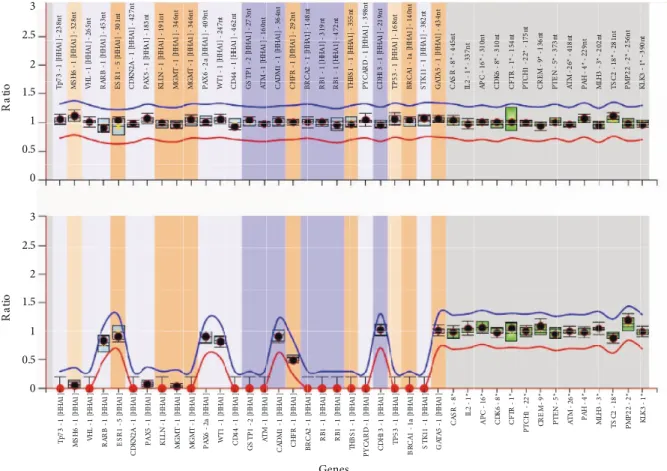
ESR1, PAX6, WT1, CADM1, CHFR, CDH13, and GATA5
genes were hypermethylated in the HT-29 cell line in addition to these three genes (Figure 2B). However, we did not detect changes in methylation status in our samples in HT-29 after EGCG application.
3.2. Antiproliferative effects of EGCG on MCF-7 and HT-29 cells
MTT analysis revealed a concentration-dependent growth inhibition by EGCG in both cell lines (Figure 3). IC50 was 11.2 ± 1.4 µM for MCF-7 cells, whereas it was 136.3 ± 2.1 µM for HT-29 cells. MTT results demonstrated that EGCG caused significantly (P < 0.05) higher cytotoxicity in MCF-7 cells compared to HT-29 cells. Next, we calculated the effect of application concentrations on cell viability.
Viability of MCF-7 cells was 91.5 ± 1%, 65.3 ± 3.4%, and 52.0 ± 3.0% at 1, 5, and 10 µM EGCG concentrations, respectively. Similarly, viability of HT-29 cells was 93.2 ± 1%, 88.7 ± 0.9%, and 77.7 ± 1.9% at 10, 20, and 50 µM EGCG concentrations, respectively.
4. Discussion
Dietary components may play key roles in influencing DNA methylation status, resulting in regulation of gene expression. As cancer is a multistep process, gene activation and silencing throughout epigenetic mechanisms, as well as gene mutations, play important roles in carcinogenesis. In recent years, dietary components have been widely studied, and their potential use in cancer treatment and prevention strategies has been discussed (Li and Tollefsboy, 2010; Hardy and Tollefsbol, 2011).
BRC A1 - 1a [H HA 1] BR CA 2-1 [H HA 1] AT M 1 [H HA 1] TP 53 - 1 [H HA 1] KL LN - 1 [H HA 1] MG M T - 1 [H HA 1] PA X5 - 1 [H HA 1] C DH 13 - 1 [H HA 1] TP 73 - 1 [H HA 1] WT 1 - 1 [H H A1 ] VH L - 1 [H HA 1] GS TP 1 - 2 [H HA 1] CH FR - 1 [H HA 1] ES R1 - 5 [H HA 1] RB 1 - 1 [H HA 1] MS H6 - 1 [H HA 1] MG MT - 1 [H HA 1] TH BS 1 - 1 [H H A1 ] CA DM 1 - 1 [H HA 1] ST K1 1 - 1 [H HA 1] YC AR D - 1 [H HA 1] PA X6 - 2a [H HA 1] CD KN 2A 1 [H HA 1] GA TA 5 - 1 [H HA 1] RA RB - 1 [H HA 1] C D4 4 - 1 [H HA 1] RB 1 - 1[ HH A1 ] CR EM - 9* CF TR - 1* PT CH 1 - 22 * ML H3 - 3* PA H - 4* PM P2 2 - 2* TS C2 - 18 * C DK 6 - 8* AP C - 16 * PT E N - 5 * KL K3 - 1* AT M - 26 * IL 2 - 1* CA SR -8 * BR CA1 - 1a [H HA1 ] - 14 0n t BR CA 2-1 [HHA 1] - 14 8n t AT M 1 [H HA1 ] - 16 0n t TP 53 - 1 [HHA 1] - 16 8n t KL LN - 1 [HH A1 ] - 18 3n t MG MT - 1 [HHA 1] - 19 1n t PA X5 - 1 [HHA 1] - 20 8n t CD H13 - 1 [HHA 1] - 21 9n t TP 73 - 1 [HHA 1] - 23 8n t WT 1 - 1 [HHA 1] - 24 7n t VH L - 1 [HHA 1] - 26 5n t GS TP 1 - 2 [HHA 1] - 27 3n t CH FR - 1 [HHA 1] - 29 2n t ES R1 - 5 [HHA 1] - 30 1n t RB 1 - 1 [H HA 1] - 31 9n t MS H6 - 1 [H HA1 ] - 32 8n t MG MT - 1 [ HHA 1] - 34 6n t TH BS1 - 1 [H HA 1] - 35 5n t CA DM 1 1 [H HA 1] - 36 4n t ST K11 - 1 [HHA 1] - 38 2n t YC AR D - 1 [HHA 1] - 39 8n t PA X6 - 2a [HHA 1] - 40 9n t CD KN 2A -1 [H HA 1] - 42 7n t GA TA 5 - 1 [HHA 1] - 43 4n t RA RB - 1 [HHA 1] - 45 3n t CD 44 - 1 [ HH A1 ] - 46 2n t RB 1 - 1[ HH A1 ] - 47 2n t CR EM - 9* - 13 6n t CF TR - 1* - 15 4n t PT CH 1 - 22 * - 17 5n t ML H3 - 3* - 20 2nt PA H - 4 * 22 9n t PM P2 2 - 2* - 25 6n t TS C2 - 18 * - 28 1n t CD K6 - 8* - 31 0n t AP C - 16 * - 33 7n t PT EN - 5* - 37 3n t KL K3 - 1* - 39 0n t AT M - 26 * - 41 8n t IL 2 1* - 445 nt CA SR -8 * - 48 3n t 2.5 2 1.5 1 0.5 0 2.5 2 1.5 1 0.5 0 Ra tioR at io Genes
Figure 1. Methylation-specific MLPA analysis of MCF-7 cells. X-axis shows tumor suppressor genes (1–25) and reference
probes (26–40). Y-axis represents (A) copy number analysis of the tumor suppressor genes and (B) methylation profile of the tumor suppressor genes with respect to reference probes. The red line and blue line in panel A represent minimum normalized ratio with deletions and maximum normalized ratio with duplications in the regions, respectively. The red line and blue line in panel B represent minimum normalized ratio of unmethylated promoter regions and maximum normalized ratio of methylated regions, respectively. Promoter regions of CDH13, GATA5, and RARβ genes were hypermethylated in MCF-7 cell line.
Tp 73 - 1 [HH A1 ] MS H6 - 1 [H HA 1] VH L - 1 [H HA 1] R AR B - 1 [H H A1 ] ES R1 - 5 [HH A1 ] CD KN 2A - 1 [HH A1 ] PA X5 - 1 [H HA 1] KL LN - 1 [HH A1 ] M GM T - 1 [H H A1] M GM T - 1 [H HA 1] PAX 6 - 2a [H H A1] WT 1 - 1 [H HA 1] CD 44 - 1 [HH A1 ] GS TP 1 - 2 [H HA 1] AT M - 1 [H HA 1] CA DM 1 - 1 [H HA 1] CH FR - 1 [H HA 1] BR CA 2 - 1 [H HA 1] RB 1 - 1 [H HA 1] R B1 - 1 [H HA 1] TH BS 1 - 1 [H HA 1] PY CA RD - 1 [H HA 1] CD H1 3 - 1 [H HA 1] TP 53 - 1 [HH A1 ] BR C A1 - 1a [HH A1 ] S TK 11 - 1 [H HA 1] GA TA 5 - 1 [HH A1] CA SR - 8 * IL 2 - 1* AP C - 16 * CD K6 - 8* CF TR - 1 * PT CH 1 - 2 2* CR E M - 9 * PT EN - 5* ATM - 26* PA H - 4 * M LH 3 - 3* TS C2 - 1 8* PM P2 2 - 2* KL K3 - 1 * 2.5 2 1.5 1 0.5 3 0 Tp 73 - 1 [HH A1 ] - 23 8n t MS H6 - 1 [HH A1 ] 3 28 nt VHL - 1 [H HA 1] - 26 5n t R AR B - 1 [H HA 1] - 4 53n t ES R1 - 5 [HH A1] - 3 01 nt CD KN 2A - 1 [HH A1 ] - 42 7n t PA X 5 1 [HH A 1] - 18 3nt KL LN - 1 [HH A1] - 19 1n t MG MT - 1 [HH A1 ] - 34 6n t MG MT - 1 [HH A1] - 3 46 nt PA X6 - 2 a [H HA 1] - 4 09 nt WT 1 - 1 [H HA 1] - 2 47n t CD 44 - 1 [HH A1] - 46 2n t GS TP 1 - 2 [HH A1 ] 2 73 nt AT M - 1 [H HA 1] - 16 0n t CA D M1 - 1 [H H A1 ] 36 4nt CH FR - 1 [HH A1 ] - 29 2n t BR CA 2 - 1 [H HA 1] - 1 48 nt R B1 - 1 [HH A 1] - 319 nt R B1 - 1 [HH A1 ] - 47 2n t TH BS 1 - 1 [H HA 1] - 3 55 nt PY CA RD - 1 [HH A1 ] - 39 8n t CD H1 3 - 1 [H HA 1] - 2 19 nt TP 53 - 1 [H H A1] - 168 nt BRC A1 - 1a [H H A1] - 14 0n t ST K 11 - 1 [HH A1 ] - 38 2n t GA TA 5 - 1 [HH A1 ] 43 4n t CA SR - 8 * 4 45 nt IL 2 - 1* - 3 37 nt AP C - 16 * - 31 0n t CD K6 - 8 * - 31 0n t CF TR - 1 * - 15 4n t PT CH 1 - 22 * - 17 5n t CR EM - 9 * - 13 6n t PT E N - 5* - 37 3n t AT M - 26 * - 41 8n t PA H - 4* - 2 29 nt M LH 3 - 3 * - 202 nt TS C2 - 1 8* - 28 1n t PMP 22 - 2 * 25 6n t KL K3 - 1 * - 39 0n t 2.5 2 1.5 1 0.5 3 0 Ra tio Ra tio Genes
Figure 2. Methylation-specific MLPA analysis of HT-29 cells. X-axis shows tumor suppressor genes (1–25) and reference
probes (26–40). Y-axis shows (A) copy number analysis of the tumor suppressor genes and (B) methylation profile of the tumor suppressor genes with respect to reference probes. The red line and blue line in panel A represent minimum normalized ratio with deletions and maximum normalized ratio with duplications in the regions, respectively. The red line and blue line in panel B represent minimum normalized ratio of unmethylated promoter regions and maximum normalized ratio of methylated regions, respectively. Promoter regions of RARβ, ESR1, PAX6, WT1, CADM1, CHFR, CDH13, and GATA5 genes were hypermethylated in HT-29 cell line.
100 90 80 70 40 30 60 50 0 20 10 1 2 3 6 13 25 50 100 Ce ll p ro lifera tio n (%) EGCG concentration (µM) MCF-7 HT-29 200 400
Figure 3. Effect of EGCG on the proliferation of MCF-7 and HT-29 cells after 48
h. Cell proliferation data are expressed as the percentage of untreated cell controls. EGCG was more cytotoxic to MCF-7 cells (blue line) than HT-29 cells (red line). Error bars represent standard error of means obtained from independent triplicates.
Promoter methylation is an important epigenetic change in cancer progression (Nystrom and Mutanen, 2009). We found that CDH13, GATA5, and RARβ genes are methylated in the MCF-7 cell line: in addition to these genes, ESR1, PAX6, WT1, CADM1, and CHFR were also hypermethylated in HT-29 cell line. EGCG is known to be an inhibitor of DNMT1 enzyme activity. It has also been reported to be a chromatin remodeling agent (Li and Tollefsboy, 2010). Whenever EGCG inhibits DNMT1 enzyme activity or affects chromatin remodeling in the promoter region of a gene, changes in gene expression occur, resulting in reactivation, as in the case of tumor suppressor genes. In this study, we investigated the demethylation effect of EGCG on the promoters of tumor suppressor genes in MCF-7 and HT-29 cell lines.
Different EGCG concentrations did not change the methylation status of the promoter regions, suggesting that it has no demethylating effect on the cell lines studied. Various factors including target availability, intracellular bioavailability dependent on cellular uptake, biotransformation or efflux, and EGCG application concentration might contribute to the present results obtained from cells of different histological origin. Meanwhile, the presence or abundance of other DNA methyltransferases (DNMT3a and DNMT3b) might influence the demethylating effect of EGCG on these cell lines via DNMT1. It should be noted that DNMT1 activity assays using nuclear extracts and analysis of gene expression levels are needed for broader conclusions. Results of the present study demonstrated that EGCG was more cytotoxic to MCF-7 cells than HT-29, i.e. IC50 was approximately 10-fold higher in MCF-7 cells. Differences in intracellular signaling pathways between HT-29 and MCF-7 cells may affect the cytotoxic potency of EGCG since it binds to EGFR and PDGFR (Liang et al., 1997; Sachinidis et al., 2000) and inhibits protein kinases (Chung et al., 1999, 2001). When studying cells of different histological origin, cytotoxic variations in response to test materials should be considered. We investigated the effect of EGCG on cell viability at different doses and found that the range of cell viability after all EGCG concentrations
tested was 50%–92% and 78%–93% in MCF-7 and HT-29 cell lines, respectively. However, we did not observe any changes in the DNA methylation status in the two cell lines after application of specified doses of EGCG. We conclude that the possible reasons are incubation doses that are below the DNMT1 inhibitory concentration or cell lines that are resistant to epigenetic effects of EGCG. In fact, according to previously reported data, nontoxic concentrations (<15% cell inhibition) of EGCG and catechin partially inhibited the methylation status of the promoter regions of the RARb gene (Lee et al., 2005) in breast cancer cells. In order to assess whether sublethal EGCG treatment may have caused the lack of demethylating effect on the cell lines tested, we also performed MS-MLPA analysis of MCF-7 cells treated with 50 and 100 µM EGCG, at which 8% and 4% cell viability was attained, respectively. Similar to the results demonstrated, we did not observe any significant changes in the DNA methylation status of the treated cells at these concentrations (data not shown).
EGCG is transported into the cell by passive diffusion and converted to the methylated metabolites and glucuronides. However, EGCG is pumped out by multidrug resistance-associated proteins (MRPs), as evidenced by increased EGCG accumulation in HT-29 cells in the presence of the MRP inhibitors indomethacin and probenecid (Hong et al., 2002). Both HT-29 and MCF-7 cells were found to express MRP1 (Alvarez et al., 1998; Kars et al., 2006).
In conclusion, although our study did not support the hypothesis that EGCG intake in early stages of colorectal and breast cancers could be preventive, especially when the importance of consuming dietary products in these tumors is taken into consideration, further studies could be designed on this basis with early-stage and numerous cancer cell lines.
Acknowledgments
This study was approved by the Başkent University Institu-tional Review Board (project no: DA09/21) and supported by the Başkent University Research Fund.
References
Alvarez M, Robey R, Sandor V, Nishiyama K, Matsumoto Y, Paull K, Bates S, Fojo T (1998). Using the National Cancer Institute anticancer drug screen to assess the effect of MRP expression on drug sensitivity profiles. Mol Pharmacol 54: 802–814. Arai M, Yokosuka O, Hirasawa Y, Fukai K, Chiba T, Imazeki F, Kanda
T, Yatomi M, Takiguchi Y, Seki N et al. (2006). Sequential gene expression changes in cancer cell lines after treatment with the demethylation agent 5-Aza-2’-deoxycytidine. Cancer 106: 2514–2525.
Arends MJ (2013). Pathways of colorectal carcinogenesis. Appl Immunohistochem Mol Morphol 21: 97–102.
Baylin SB, Herman JG (2000). DNA hypermethylation in tumorigenesis: epigenetics joins genetics. Trends Genet 16: 168–174.
Brooks J, Cairns P, Zeleniuch-Jacquotte A (2009). Promoter methylation and the detection of breast cancer. Cancer Causes Control 20: 1539–1550.
Chen D, Wan SB, Yang H, Yuan J, Chan TH, Dou QP (2011). EGCG, green tea polyphenols and their synthetic analogs and prodrugs for human cancer prevention and treatment. Adv Clin Chem 53: 155–177.
Cho YH, Yazici H, Wu HC, Terry MB, Gonzalez K, Qu M, Dalay N, Santella RM (2010). Aberrant promoter hypermethylation and genomic hypomethylation in tumor, adjacent normal tissues and blood from breast cancer patients. Anticancer Res 30: 2489–2496.
Chung J Y, Huang C, Meng X, Dong Z, Yang CS (1999). Inhibition of activator protein 1 activity and cell growth by purified green tea and black tea polyphenols in H-Ras-transformed cells: structure-activity relationship and mechanisms involved. Cancer Res 59: 4610–4617.
Chung JY, Park JO, Phyu H, Dong Z, Yang CS (2001). Mechanisms of inhibition of the Ras-MAP kinase signaling pathway in 30.7b Ras 12 cells by tea polyphenols (-)-epigallocatechin-3-gallate and theaflavin-3,3’-digallate. FASEB J 15: 2022–2024.
Colussi D, Brandi G, Bazzoli F, Ricciardiello L (2013). Molecular pathways involved in colorectal cancer: implications for disease behavior and prevention. Int J Mol Sci 14: 16365–16385. Fang MZ, Wang Y, Ai N, Hou Z, Sun Y, Lu H, Welsh W, Yang CS
(2003). Tea polyphenol (-)-epigallocatechin-3-gallate inhibits DNA methyltransferase and reactivates methylation-silenced genes in cancer cell lines. Cancer Res 63: 7563–7570.
Gao Z, Xu Z, Hung MS, Lin YC, Wang T, Gong M, Zhi X, Jablon DM, You L (2009). Promoter demethylation of WIF-1 by epigallocatechin-3-gallate in lung cancer cells. Anticancer Res 29: 2025–2230.
Hardy TM, Tollefsbol TO (2011). Epigenetic diet: impact on the epigenome and cancer. Epigenomics 3: 503–518.
Hong J, Lu H, Meng X, Ryu JH, Hara Y, Yang CS (2002). Stability, cellular uptake, biotransformation, and efflux of tea polyphenol (-)-epigallocatechin-3-gallate in HT-29 human colon adenocarcinoma cells. Cancer Res 62: 7241–7246.
Hsu YC, Liou YM (2011). The anti-cancer effects of (-)-epigallocatechin-3-gallate on the signaling pathways associated with membrane receptors in MCF-7 cells. J Cell Physiol 226: 2721–2730.
Kars MD, Iseri OD, Gündüz U, Ural AU, Arpaci F, Molnár J (2006). Development of rational in vitro models for drug resistance in breast cancer and modulation of MDR by selected compounds. Anticancer Res 26: 4559–4568.
Kornegoor R, Moelans CB, Verschuur-Maes AH, Hogenes MCh, de Bruin PC, Oudejans JJ, van Diest PJ (2012). Promoter hypermethylation in male breast cancer: analysis by multiplex ligation-dependent probe amplification. Breast Cancer Res 14: R101.
Lecumberri E, Dupertuis YM, Miralbell R, Pichard C (2014). Green tea polyphenol epigallocatechin-3-gallate (EGCG) as adjuvant in cancer therapy. Clin Nutr 32: 894–903.
Lee WJ, Shim JY, Zhu BT (2005). Mechanisms for the inhibition of DNA methyltransferases by tea catechins and bioflavonoids. Mol Pharmacol 68: 1018–1030.
Li Y, Tollefsbol TO (2010). Impact on DNA methylation in cancer prevention and therapy by bioactive dietary components. Curr Med Chem 17: 2141–2151.
Liang YC, Lin-shiau SY, Chen CF, Lin JK (1997). Suppression of extracellular signals and cell proliferation through EGF receptor binding by (-)-epigallocatechin gallate in human A431 epidermoid carcinoma cells. J Cell Biochem 67: 55–65. Moelans CB, Verschuur-Maes AH, van Diest PJ (2011). Frequent
promoter hypermethylation of BRCA2, CDH13, MSH6, PAX5, PAX6 and WT1 in ductal carcinoma in situ and invasive breast cancer. J Pathol 225: 222–231.
Moison C, Senamaud-Beaufort C, Fourrière L, Champion C, Ceccaldi A, Lacomme S, Daunay A, Tost J, Arimondo PB, Guieysse-Peugeot AL (2013). DNA methylation associated with polycomb repression in retinoic acid receptor β silencing. FASEB J 27: 1468–1478.
Nandakumar V, Vaid M, Katiyar SK (2011). (-)-Epigallocatechin-3-gallate reactivates silenced tumor suppressor genes, Cip1/p21 and p16INK4a, by reducing DNA methylation and increasing histones acetylation in human skin cancer cells. Carcinogenesis 32: 537–544.
Nystrom M, Mutanen M (2009). Diet and epigenetics in colon cancer. World J Gastroenterol 15: 257–263.
Pandey M, Shukla S, Gupta S (2010). Promoter demethylation and chromatin remodeling by green tea polyphenols leads to re-expression of GSTP1 in human prostate cancer cells. Int J Cancer 126: 2520–33.
Park SY, Kwon HJ, Lee HE, Ryu HS, Kim SW, Kim JH, Kim IA, Jung N, Cho NY, Kang GH (2011). Promoter CpG island hypermethylation during breast cancer progression. Virchows Arch 458: 73–84.
Sachinidis A, Seul C, Seewald S, Ahn H, Ko Y, Vetter H (2000). Green tea compounds inhibit tyrosine phosphorylation of PDGF b-receptor and transformation of A172 human glioblastoma. FEBS Lett 471: 51–55.
Singh PN, Fraser GE (1998). Dietary risk factors for colon cancer in a low-risk population. Am J Epidemiol 148: 761–774.
Xiang TX, Yuan Y, Li LL, Wang ZH, Dan LY, Chen Y, Ren GS, Tao Q (2013). Aberrant promoter CpG methylation and its translational applications in breast cancer. Chin J Cancer 32: 12–20.
Xu J, Shetty PB, Feng W, Chenault C, Bast RC Jr, Issa JP, Hilsenbeck SG, Yu Y (2012). Methylation of HIN-1, RASSF1A, RIL and CDH13 in breast cancer is associated with clinical characteristics, but only RASSF1A methylation is associated with outcome. BMC Cancer 12: 243.
Zeng L, Holly JMP, Perks CM (2014). Effects of physiological levels of the green tea extract epigallocatechin-3-gallate on breast cancer cells. Front Endocrinol (Lausanne) 5: 61.
Zhang X, Min KW, Wimalasena J, Baek SJ (2012). Cyclin D1 degradation and p21 induction contribute to growth inhibition of colorectal cancer cells induced by epigallocatechin-3-gallate. J Cancer Res Clin Oncol 138: 2051–2060.
Zheng R, Blobel GA (2010). GATA transcription factors and cancer. Genes Cancer 1: 1178–1188.