Doğuş Üniversitesi Dergisi, 16 (1) 2015, 79-90
THE EFFECTS OF ACQUISITIONS ON FIRM VALUE,
EVIDENCE FROM TURKEY
(1)SATIN ALMALARIN ŞİRKET DEĞERİ ÜSTÜNDEKİ ETKİSİ, TÜRKİYE ÖRNEĞİ
Fatma Büşra GÜNAY BENDAŞ
Washington and Lee UniversityABSTRACT: Acquisitions are assumed to create value for both the target and the acquiring firm. This paper analyzes the sources of value creation in acquisitions and examines the domestic acquisitions that took place in Turkey in 2013. By taking the overall market considerations into account, I measure the degree of value creation over different periods of time. I use the standard market value technique to calculate abnormal returns in stock prices of the acquiring firms and find that the increase in firm value is statistically significant in the long run but not in the short run.
Keywords: Acquisitions; Financial Markets; Event Studies JEL Classifications: C12; G00; G14; G34
ÖZET: Şirket satın almalarının hem satın alan hem de satılan firmanın piyasa
değerini arttırdığı varsayılır. Bu makalede, Türkiye'de 2013 yılında gerçekleşen yerli satın almalar, piyasaların genel trendini de göz önünde bulundurarak incelenmiştir. Standart Piyasa değeri tekniğini kullanarak, satın alan firmanin hisse senedi fiyatlarındaki anormal getiriler hesaplanmıştır . Satın almanin açıklandığı tarih öncesi ve sonrasının karşılaştırılması sonucunda, firma değerindeki artışın uzun vadede istatistiki olarak anlamlı olduğu, fakat kısa vadede anlamlı olmadığı bulunmuştur.
Anahtar Kelimeler: Şirket Satın Almaları; Finansal Piyasalar; Olay Çalışmaları
1. Introduction
According to Ernst & Young’s M&A Report, Turkey is the leading M&A market in number and in transaction size in 2012, in the Central and Southern Europe. Turkey experienced 297 merger and acquisitions, totaling a transaction volume of 18 billion. In such a market with a vast growth potential, it is crucial to understand the dynamics behind the value creation in mergers and acquisitions.
Acquisitions are theoretically supposed to create value for both the acquirer and the target firm. Even though empirical studies support value creation for the target firm,
the literature lacks empirical evidence of value creation for the acquirer.2 In this
paper, I argue that the time frame of the measurement may play an important role in determining the value creation. The literature assumes that the synergy, hence value creation, shows up right after the acquisition. But, as I demonstrate through the paper, it may take up to a few years to observe the full benefit of an acquisition.
1 This research has been done when the author was an assistant professor at Washington and
Lee University.
2 Bradley, Desai and Kim (1998) show that the value creation in contested acquisitions is
In this paper, I use the market model to estimate the value creation in the acquirer firm over different time frames. I consider 2 days, 5 days and 1-year stock market data. I find that the increase in firm value is statistically significant in the long run but not in the short run.
The rest of the paper is organized as follows: The next section examines previous research about the effect of acquisitions on the market value of the acquiring firms and about the measurement techniques used in the assessment of market value. Section 3 briefly explains the sources of firm value creation in acquisitions. Section 4 elaborates the methodology. Section 5 presents the data and the results. The last section concludes and explores further research opportunities.
2. Literature
The literature on the mergers and acquisitions has developed in two branches. Analysis of international mergers focuses on the firm profitability in multi-market settings where as the analysis of national mergers focuses on the comparison with international mergers in terms of value creation, competition and the measurement of degree of value creation. Horn and Persson (2001) compare international and domestic mergers. They find that the main advantage of national mergers for the firms is that by decreasing competition, they increase firm profitability. Analyzing international costs of transactions, they conclude that domestic mergers are more profitable in environments with higher trade costs. In the other branch of the literature, In a theoretical setting, Bjorvatn (2003) show that economic integration may facilitate international mergers. Since economic integration increases competitive pressure in the domestic market, mergers may become more profitable. The choice of the type of acquisitions critically depends on the assessment of the degree of value creation in international and domestic acquisitions. Therefore, it is crucial to determine the sources of value creation as well as to have a reliable assessment method to compute the values created. In this context; Deepak, Pinches and Narayanan (1992) analyze different methods of financing in mergers and acquisitions. They prove that stock financing is more beneficial in terms of value creation for both the acquirer and the target firm. They also consider the effect of the structure of the bidding firm and conclude that conglomerate acquisitions decrease the value of the acquiring firm. On the other hand, Seth (1990) looks at the sources of the value creation in terms of the relationship between the target and the acquiring firm. He finds that related acquisitions do not always have higher success in creating value, compared to unrelated acquisitions. In order to explain this surprising result, he argues that risk diversification may play an important role in value creation and firms, by acquiring unrelated firms, decreases their market risks, therefore may increase their market value. In another paper, Chatterjee (1986) classifies the factors that may affect the market value of the firms after acquisitions into three groups: financial synergy, operational synergy and collusive synergy. He finds that the advantages gained through decreased competition after the acquisition (i.e., collusive synergy) have the highest effect on the market value. The lowest effect is through the cost advantages of the acquisitions (i.e., operational synergy).
Once the possible factors affecting the market value after acquisitions are determined, the second crucial step is to find a method to empirically measure the change in the market value. MacKinlay (1997) summarizes event study methods and
The Effects of Acquisitions on Firm Value, Evidence From Turkey 81
gives an example from stock market where he calculates, at first, the normal performance and then abnormal returns and compares them to determine whether the event is statistically significant. In this paper, I follow his method to find our weather the event "acquisition" has statistically significant effect on the market value of the firm.
Besides their microeconomic effects such as the impact on the firm value and industry, the welfare effects of both domestic and international acquisitions and their policy implications are widely analyzed in the literature too. Horn and Levinsson (2001) discuss the role of international agreements on the choice of merger and acquisition type.
The literature on merger and acquisition activities in Turkey is limited compared to the international literature. Akben-Selcuk and Altiok-Yilmaz (2011) analyze the effect of mergers and acquisitions from both an economic and accounting perspective. They find that the acquirer firms are negatively affected by M&As. In another paper, Hekimoglu and Tanyeri (2011) compare the abnormal returns after acquisitions in Turkey with the ones in EU and US. They find that the abnormal returns in Turkey are positive but small compared to the returns in EU and US.
3. Sources of Value Creation in Acquisitions
Value-maximizing hypothesis of acquisitions states that acquisitions occur to maximize the combined market value of the firms. Therefore, acquisitions increase both the acquiring and the target firm's market value. Value creation is realized as a result of a process called "synergy", which provides a new and efficient allocation of firms' scarce resources after the acquisition. The synergy may happen at any stage of the market activity. These stages can be classified into 5 broad categories: Market power, economies of scale, economies of scope, coinsurance, and financial
diversification.3 By taking Seth (1997)'s classification into account, I group the
sources of value creation in acquisitions in 5 categories: 3.1. Market Power
Firms, by undertaking horizontal acquisitions, may decrease the competition in the market. Therefore, the price level and the profits increase, which positively affects
the value of the acquiring firm.4 For instance, Denizbank's acquisition of Citi Turkey
Retail Banking Division is expected to increase Denizbank's market power, thus its market value. Also, after the acquisition, the rivals may mutually decrease competition by entry deterrence. Since the acquiring firm is stronger after the acquisition, its market power increases, which influences the decision of its rivals. 3.2. Economies of Scale
In cases of acquisitions where the firms use similar raw materials, the cost of raw materials may decrease, which in turn increases profitability, hence market value. The firms may also undertake lower-cost inventory management techniques after the acquisition. In order to enjoy the synergy created by economies of scale, the firms must be related, either operating in the same market (horizontal merger and
3
Seth, Anju, "Value creation in acquisitions: A reexamination of performance issues.", Strategic Management Journal, 11.2, 1990, p102.
4
acquisitions) or sharing similar factors of production. As an example of the synergy created by economies of scale, we can give Urfar Pharmaceuticals' acquisition of Bilim Pharmaceuticals.
3.3. Economies of Scope
If a firm acquires a related firm (not operating in the same market), they may
experience economies of scope.5 The best example for this type of synergy is created
in vertical acquisitions where the final product of one firm is the raw material of the other. The combined market value of the firms will increase after the acquisition due to both increased sales and reduced production costs. Yıldız Holding's acquisition of Adapazarı Sugar factory is expected to decrease Yıldız Holding's production cost, which may cause an increase in Yıldız Holding's firm value.
3.4. Diversification of Risk
The firm undertaking the acquisition activity may benefit from decreased risk of bankruptcy, if he is not sharing the same risk environment with the target firm. For instance, in 2013, Torunlar Food acquired Başkent Natural Gas Distribution. By diversifying the risk associated with his main industry of operation, Torunlar Food decreased his risk of bankruptcy. After the acquisition, the acquiring firm may enjoy higher levels of debt capacity in case of bankruptcy, which further increases its market value.
Despite the empirical evidence for the synergy created through risk diversification, finance theory has shown that in perfectly competitive financial markets, diversification only decreases the total risk, not the systematic risk. Since asset pricing is affected only by systemic risk, firm values should not react to acquisitions. Levy and Sarnat (1970) propose that market imperfections such as indivisibility of assets and existence of frictional costs (transaction costs, cost of information and monitoring, etc.) create room for further diversification and decrease the systemic risk, which in turn increases the market value if the acquiring firm.
3.5. Characteristics of The Market for Corporate Control
The environment the firms are operating influence their decision making process. For instance, the foundation of the Competition Authority (Rekabet Kurumu) in Turkey has increased the regulatory pressure upon mergers and acquisitions. Even though further research is needed to prove the effect on firm values, by comparing with the 1968 Williams Amendment in the USA, we may expect firm values to be negatively affected by stricter regulations.
The number of bidders in an acquisition is also an important factor in determining the effect on the acquiring firm. As the number of bidders increases, the acquisition price rises, which is expected to affect the value of the acquiring firm negatively. The acquiring firm may finance the acquisition either through cash payment or stock issuance. Myers and Majluf (1984) argue that cash financing is better for both the acquiring and the target firm. He posits that issuance of stock provides negative signals to the market, whereby decreases the firm value.
5
Williamson (1981) claims that even unrelated firms can benefit from acquisitions through economies of scope due to firms sharing of monitoring and administrative costs.
The Effec
4. Meth
In order event stu defined abnorma where normal r Actual r defined their diff value. The esti window included Figure 1 calculate acquisiti 4.1. Esti The mar related t using an operation expected The retu Where R respectiv instead o the fluct estimate 6 See Sect cts of Acquisiti estim wihodology
to measure th udy approach as the return al return is: and E( |returns are line return is the r as the expect ference provid imation windo is the interva d in the event w 1 illustrates t ed based on ion. The annou
imation of Th rket model of o the return o n overall mark n of the acq d returns.6 urn of stock i a R and R ar vely. α , β , of an overall m tuations in ind for abnormal
tion 5 for furthe
-T... ions on Firm Va mation ndow he effect of the h by MacKin n after the acq
= | ) are actua early related t return of the ted return of t des a good est ow is set to al , . De window to cap the timing of the + uncement date Figure 1. Tim he Normal Re f security prici of the market. ket index, I u quiring firm. at time t is: R = α (ϵ ) = 0 re return of st
are the par market index, dustry is elim returns. The n er details. -τ1 alue, Evidence event wind e acquisition o nlay (1997). T quisition. For = − E( al and normal to market retu stock after th the stock if th timate for the
be T days p enote that − pture the effec f the estimat
observation e is denoted b
meline of the eturns
ing posits tha . Different fro use industry i
By this way
α + β R +
(ϵ tock i and the arameters of t ensures that t minated. There normal return 0 From Turkey dow on the acquirin The abnormal r firm i and | ) l returns respe rns, . he acquisition here was no a effect of the prior to the a days before ct of a possibl tion process. s prior to t by 0. e Acquisitions at the return o om the existin ndices specifi , I have a b ϵ ) = e return in the the model. U the part of the efore, I will h n is then, ng firm value, l return on a acquisition da ectively. I ass n and normal acquisition. T acquisition on acquisition. T e the announc e information Expected ret the announce s of a security is ng literature, i fic to the main better estimate industry of o Using industry return associ have a lower v 83 , I use the a stock is date t, the sume that return is Therefore, n the firm The event cement is n leakage. eturns are ement of s linearly instead of n area of e for the (1) operation, y indices iated with varianced
E( | ) = α + R where α and are OLS estimates of parameters α and β . 4.2. Estimation of The Abnormal Return
Now, we are ready to calculate abnormal returns of stock i at time t:
= − E( | )
Denote that the abnormal returns are actually the error terms in equation (1).
Abnormal returns are normally distributed with mean 0 and variance where
= + 1
τ + τ 1 +
− ̂
With as the estimate of the variance in equation (1) and ̂ as the mean return of
the industry during the event period.
In order to have a better estimate for the effect of the acquisition, I find the cumulative abnormal return over the event period, which is the sum of individual abnormal returns. The cumulative abnormal return of stock i is:
=
Under the null hypothesis H0 that the acquisition has no effect on the value of the
firm, the distribution of the abnormal returns is given by;
∼ (0 , )
Using individual variances of the abnormal return, the variance of the cumulative abnormal return is;
( ) = = + 2 ( , ) (2)
Therefore, the cumulative abnormal return of stock i is distributed normally;
∼ (0 , )
Now, we are ready to provide a t-statistic with n-1 degrees of freedom to test our null hypothesis, H0.
( ) =
√
The Effects of Acquisitions on Firm Value, Evidence From Turkey 85
5. Data and Results
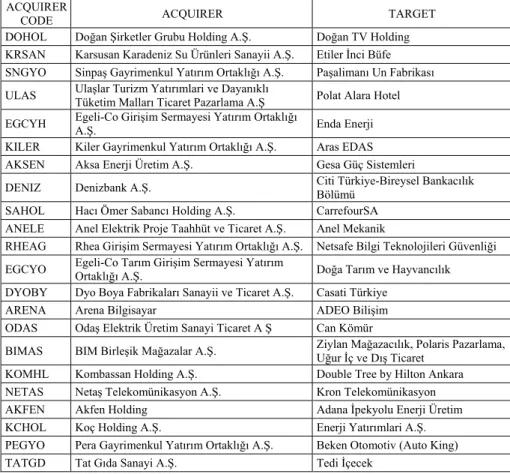
Data on M&A activities from Borsa Istanbul Daily Bulletins is used to identify 336 acquisitions that took place in Turkey in 2013. Out of 336, the ones with domestic acquirers whose shares are traded on Borsa Istanbul and who are involved only in 1 M&A activity are considered. Table (1) summarizes the resulting 22 acquisitions.
Table 1. Domestic Acquisitions in Turkey, 2013
ACQUIRER
CODE ACQUIRER TARGET
DOHOL Doğan Şirketler Grubu Holding A.Ş. Doğan TV Holding
KRSAN Karsusan Karadeniz Su Ürünleri Sanayii A.Ş. Etiler İnci Büfe
SNGYO Sinpaş Gayrimenkul Yatırım Ortaklığı A.Ş. Paşalimanı Un Fabrikası
ULAS Ulaşlar Turizm Yatırımlari ve Dayanıklı Tüketim Malları Ticaret Pazarlama A.Ş Polat Alara Hotel
EGCYH Egeli-Co Girişim Sermayesi Yatırım Ortaklığı A.Ş. Enda Enerji
KILER Kiler Gayrimenkul Yatırım Ortaklığı A.Ş. Aras EDAS
AKSEN Aksa Enerji Üretim A.Ş. Gesa Güç Sistemleri
DENIZ Denizbank A.Ş. Citi Türkiye-Bireysel Bankacılık Bölümü
SAHOL Hacı Ömer Sabancı Holding A.Ş. CarrefourSA
ANELE Anel Elektrik Proje Taahhüt ve Ticaret A.Ş. Anel Mekanik
RHEAG Rhea Girişim Sermayesi Yatırım Ortaklığı A.Ş. Netsafe Bilgi Teknolojileri Güvenliği
EGCYO Egeli-Co Tarım Girişim Sermayesi Yatırım Ortaklığı A.Ş. Doğa Tarım ve Hayvancılık
DYOBY Dyo Boya Fabrikaları Sanayii ve Ticaret A.Ş. Casati Türkiye
ARENA Arena Bilgisayar ADEO Bilişim
ODAS Odaş Elektrik Üretim Sanayi Ticaret A Ş Can Kömür
BIMAS BIM Birleşik Mağazalar A.Ş. Ziylan Mağazacılık, Polaris Pazarlama, Uğur İç ve Dış Ticaret
KOMHL Kombassan Holding A.Ş. Double Tree by Hilton Ankara
NETAS Netaş Telekomünikasyon A.Ş. Kron Telekomünikasyon
AKFEN Akfen Holding Adana İpekyolu Enerji Üretim
KCHOL Koç Holding A.Ş. Enerji Yatırımlari A.Ş.
PEGYO Pera Gayrimenkul Yatırım Ortaklığı A.Ş. Beken Otomotiv (Auto King)
TATGD Tat Gıda Sanayi A.Ş. Tedi İçecek
The estimation window is set to be 190 days7 before the acquisition date, omitting
the last 4 days to exclude the effect of information leakage. The total number of observations for each firm in the event window is therefore 380 (1 for each trading session).
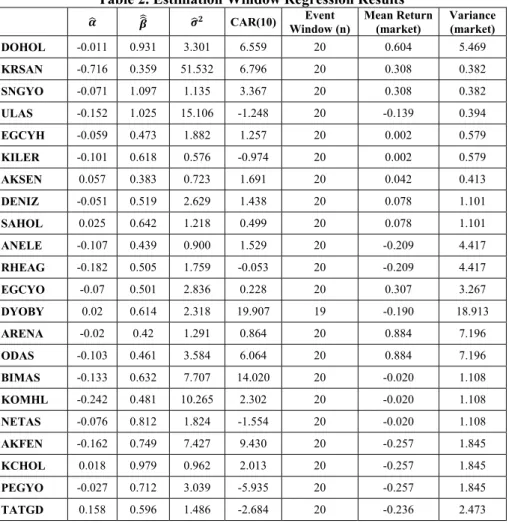
Using session returns in the estimation window, I calculate the parameters of the market model. The results are summarized in Table (2). Session Returns are
regressed against the relevant industry returns.8 As expected, session returns are
positively related to industry returns.
7
The estimation window is smaller for KRSAN, ULAS, ODAS, TATGD since the shares of these firms were not traded during some portion of the 190-day estimation window. 8
Table 2. Estimation Window Regression Results
CAR(10) Window (n) Event Mean Return (market) Variance (market)
DOHOL -0.011 0.931 3.301 6.559 20 0.604 5.469 KRSAN -0.716 0.359 51.532 6.796 20 0.308 0.382 SNGYO -0.071 1.097 1.135 3.367 20 0.308 0.382 ULAS -0.152 1.025 15.106 -1.248 20 -0.139 0.394 EGCYH -0.059 0.473 1.882 1.257 20 0.002 0.579 KILER -0.101 0.618 0.576 -0.974 20 0.002 0.579 AKSEN 0.057 0.383 0.723 1.691 20 0.042 0.413 DENIZ -0.051 0.519 2.629 1.438 20 0.078 1.101 SAHOL 0.025 0.642 1.218 0.499 20 0.078 1.101 ANELE -0.107 0.439 0.900 1.529 20 -0.209 4.417 RHEAG -0.182 0.505 1.759 -0.053 20 -0.209 4.417 EGCYO -0.07 0.501 2.836 0.228 20 0.307 3.267 DYOBY 0.02 0.614 2.318 19.907 19 -0.190 18.913 ARENA -0.02 0.42 1.291 0.864 20 0.884 7.196 ODAS -0.103 0.461 3.584 6.064 20 0.884 7.196 BIMAS -0.133 0.632 7.707 14.020 20 -0.020 1.108 KOMHL -0.242 0.481 10.265 2.302 20 -0.020 1.108 NETAS -0.076 0.812 1.824 -1.554 20 -0.020 1.108 AKFEN -0.162 0.749 7.427 9.430 20 -0.257 1.845 KCHOL 0.018 0.979 0.962 2.013 20 -0.257 1.845 PEGYO -0.027 0.712 3.039 -5.935 20 -0.257 1.845 TATGD 0.158 0.596 1.486 -2.684 20 -0.236 2.473
At first, the event period considered is 10 days and 5 days, and then, it is set to include all data available after the date of acquisition. By setting different event windows, I try to explain the effect of the time frame after the acquisition, on the firm value. It may take up to 2 years to fully see the synergy created by the M&A. Therefore, using a short time frame may not give accurate information about the effect of the acquisition.
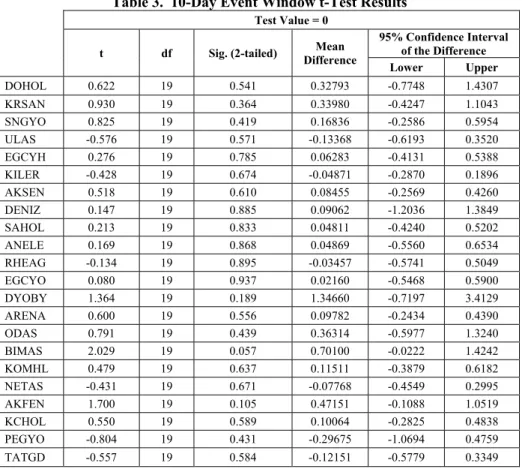
The cumulative abnormal returns for the 10-day event period are given in Table (2). These returns include the abnormal returns for 10 days around the date of
acquisition.9 Using CAR values and calculating its variance via equation (2), I
conduct a one-tail t test to check null hypothesis that the abnormal returns are zero. For the 10-day and 5 day event windows, the null hypothesis cannot be rejected. The results are summarized in Table (3) and Table (4).
9
The Effects of Acquisitions on Firm Value, Evidence From Turkey 87
Table 3. 10-Day Event Window t-Test Results
Test Value = 0 t df Sig. (2-tailed) Difference Mean
95% Confidence Interval of the Difference Lower Upper DOHOL 0.622 19 0.541 0.32793 -0.7748 1.4307 KRSAN 0.930 19 0.364 0.33980 -0.4247 1.1043 SNGYO 0.825 19 0.419 0.16836 -0.2586 0.5954 ULAS -0.576 19 0.571 -0.13368 -0.6193 0.3520 EGCYH 0.276 19 0.785 0.06283 -0.4131 0.5388 KILER -0.428 19 0.674 -0.04871 -0.2870 0.1896 AKSEN 0.518 19 0.610 0.08455 -0.2569 0.4260 DENIZ 0.147 19 0.885 0.09062 -1.2036 1.3849 SAHOL 0.213 19 0.833 0.04811 -0.4240 0.5202 ANELE 0.169 19 0.868 0.04869 -0.5560 0.6534 RHEAG -0.134 19 0.895 -0.03457 -0.5741 0.5049 EGCYO 0.080 19 0.937 0.02160 -0.5468 0.5900 DYOBY 1.364 19 0.189 1.34660 -0.7197 3.4129 ARENA 0.600 19 0.556 0.09782 -0.2434 0.4390 ODAS 0.791 19 0.439 0.36314 -0.5977 1.3240 BIMAS 2.029 19 0.057 0.70100 -0.0222 1.4242 KOMHL 0.479 19 0.637 0.11511 -0.3879 0.6182 NETAS -0.431 19 0.671 -0.07768 -0.4549 0.2995 AKFEN 1.700 19 0.105 0.47151 -0.1088 1.0519 KCHOL 0.550 19 0.589 0.10064 -0.2825 0.4838 PEGYO -0.804 19 0.431 -0.29675 -1.0694 0.4759 TATGD -0.557 19 0.584 -0.12151 -0.5779 0.3349
Table 4. 5-Day Event Window t-Test Results
Test Value = 0 t df Sig. (2-tailed) Difference Mean
95% Confidence Interval of the Difference Lower Upper DOHOL 0.750 9 0.472 0.74260 -1.4972 2.9824 KRSAN 0.619 9 0.551 0.13649 -0.3624 0.6354 SNGYO 0.183 9 0.859 0.04501 -0.5122 0.6022 ULAS -0.291 9 0.778 -0.09282 -0.8150 0.6294 EGCYH 0.887 9 0.398 0.21208 -0.3291 0.7532 KILER 0.206 9 0.841 0.02180 -0.2176 0.2612 AKSEN -1.802 9 0.105 -0.14893 -0.3359 0.0380 DENIZ 0.114 9 0.912 0.14074 -2.6643 2.9458 SAHOL 1.026 9 0.332 0.34299 -0.4135 1.0995 ANELE 0.281 9 0.785 0.10193 -0.7199 0.9238 RHEAG -0.274 9 0.790 -0.08422 -0.7789 0.6105 EGCYO 0.945 9 0.370 0.35853 -0.5001 1.2172 DYOBY -0.040 9 0.969 -0.01336 -0.7596 0.7329 ARENA 0.126 9 0.903 0.02688 -0.4573 0.5111 ODAS -0.540 9 0.602 -0.18370 -0.9533 0.5859 BIMAS 1.353 9 0.209 0.80554 -0.5409 2.1519
Table 4. Continues KOMHL 0.308 9 0.765 0.09000 -0.5705 0.7505 NETAS 0.039 9 0.970 0.01205 -0.6828 0.7069 AKFEN -0.653 9 0.530 -0.17119 -0.7640 0.4216 KCHOL 1.053 9 0.320 0.25669 -0.2947 0.8081 PEGYO -1.385 9 0.200 -0.67227 -1.7706 0.4260 TATGD -0.697 9 0.503 -0.17832 -0.7568 0.4002
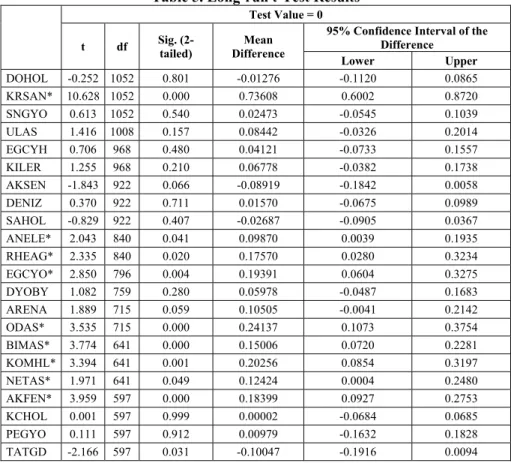
According to the long run event window results in Table (5), 9 out of 22 acquisitions
have created value for the acquirer firm in the long run.10 There is no significant
pattern in the type of these acquisitions. Both vertical and horizontal acquisitions have resulted an increase in firm value. This result is controversial to Akben-Selcuk and Altiok-Yilmaz (2011). The difference in the expected returns due to the use of industry indices instead of the market index as well as the difference in the event windows may be the reason for the results to differ from theirs.
Table 5. Long-run t-Test Results
Test Value = 0 t df Sig. (2-tailed) Difference Mean
95% Confidence Interval of the Difference Lower Upper DOHOL -0.252 1052 0.801 -0.01276 -0.1120 0.0865 KRSAN* 10.628 1052 0.000 0.73608 0.6002 0.8720 SNGYO 0.613 1052 0.540 0.02473 -0.0545 0.1039 ULAS 1.416 1008 0.157 0.08442 -0.0326 0.2014 EGCYH 0.706 968 0.480 0.04121 -0.0733 0.1557 KILER 1.255 968 0.210 0.06778 -0.0382 0.1738 AKSEN -1.843 922 0.066 -0.08919 -0.1842 0.0058 DENIZ 0.370 922 0.711 0.01570 -0.0675 0.0989 SAHOL -0.829 922 0.407 -0.02687 -0.0905 0.0367 ANELE* 2.043 840 0.041 0.09870 0.0039 0.1935 RHEAG* 2.335 840 0.020 0.17570 0.0280 0.3234 EGCYO* 2.850 796 0.004 0.19391 0.0604 0.3275 DYOBY 1.082 759 0.280 0.05978 -0.0487 0.1683 ARENA 1.889 715 0.059 0.10505 -0.0041 0.2142 ODAS* 3.535 715 0.000 0.24137 0.1073 0.3754 BIMAS* 3.774 641 0.000 0.15006 0.0720 0.2281 KOMHL* 3.394 641 0.001 0.20256 0.0854 0.3197 NETAS* 1.971 641 0.049 0.12424 0.0004 0.2480 AKFEN* 3.959 597 0.000 0.18399 0.0927 0.2753 KCHOL 0.001 597 0.999 0.00002 -0.0684 0.0685 PEGYO 0.111 597 0.912 0.00979 -0.1632 0.1828 TATGD -2.166 597 0.031 -0.10047 -0.1916 0.0094
The long run event window estimation results are consistent with the theoretical view that it takes time to observe the synergy created in acquisitions. But, empirical research conflicts with these findings. Malmendier, Moretti and Peters (2012) show
10
The increase in value of KRSAN, ANELE, RHEAG, EGCYO, ODAS, BIMAS, KOMHL, NETAS, AKFEN shares is statistically significant.
The Effects of Acquisitions on Firm Value, Evidence From Turkey 89
that the in a 3-year period after the acquisition, the winning bidder firm underperforms compared to other bidders. The answer to this contradictory result comes from Rau and Vermaelen (1998). They demonstrate that the market and the management over-extrapolate the bidder firms' past performance. Therefore, if the bidder's pre-acquisition price-to-book ratio is high (i.e, the firm is a glamour firm), the market overestimates the value of the acquisition, which may cause higher
abnormal returns in the short run compared to the abnormal returns of value firms11.
But in the long run, when the market corrects its belief, the value firms will have higher (positive) abnormal returns than the glamour firms.
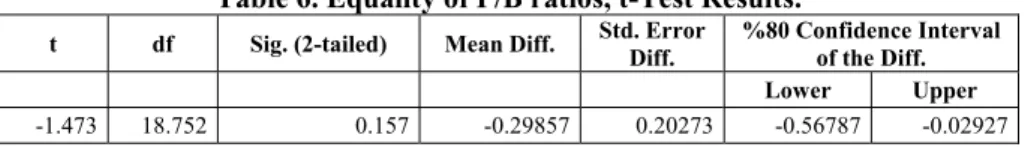
In order to check this proposition, I compare the average P/B ratio of the 9 firms whose abnormal returns are significantly greater than 0, with the P/B ratio of the remaining firms. The t-test results are shown on Table (6). The results support Malmendier, Moretti and Peters (2012). The firms with positive abnormal returns have lower P/B ratios. In other words, value firms have higher abnormal returns compared to others.
Table 6. Equality of P/B ratios, t-Test Results.
t df Sig. (2-tailed) Mean Diff. Std. Error Diff. %80 Confidence Interval of the Diff.
Lower Upper
-1.473 18.752 0.157 -0.29857 0.20273 -0.56787 -0.02927
6. Conclusions
This paper opposes the paradox that the acquirer firm loses value after the acquisition by extending the measurement period to cover the lag in synergy creation. Synergy created through economies of scale and economies of scope may take substantial amount of time. Therefore, in measuring the value creation, it is beneficial to consider longer time frames. I use the market model along with stock data from Borsa Istanbul to estimate the value creation in acquisitions in Turkey, in 2013.
The estimation results indicate no statistically significant value creation in the short run, but in the long run, 9 out of 22 acquisitions increased the value of the acquirer firm. In order to explain the difference in the long run results, I test the proposition that the market and the management over-extrapolate the bidder firms' past performance. In order to check this proposition, I compare the average P/B ratio of the 9 firms whose abnormal returns are significantly greater than 0, with the P/B ratio of the remaining firms. The results support Malmendier, Moretti and Peters (2012). The firms with positive abnormal returns have lower P/B ratios. In other words, value firms have higher abnormal returns compared to others.
The key limitation of this study along with all market model studies, is the complexity of the external factors affecting firm value. Even though this paper excludes effects of additional mergers and acquisitions, it is not possible to track down all other external factors and isolate the effect of the acquisitions. In this perspective, a sector analysis may be performed in future research to isolate the sectorial effects.
11
Also, in this paper, acquisitions are not differentiated in terms of payment method. Grouping the acquisitions in terms of payment method may be useful in tracking down the effect of cash and stock financing on the value creations in acquisitions.
7. References
AKBEN-SELÇUK, E., ALTIOK-YILMAZ, A. (2011). The impact of mergers and acquisitions on acquirer performance: Evidence from Turkey. Business and Economics
Journal, 22, 1-8.
BJORVATN, K. (2004). Economic integration and the profitability of cross-border mergers and acquisitions. European Economic Review, 48 (6), 1211-1226.
BRADLEY, M., DESAI, A., KIM, E.H. (1988). Synergistic gains from corporate acquisitions and their division between the stockholders of target and acquiring firms. Journal of
financial Economics, 21 (1), 3-40.
CHATTERJEE, S. (1986). Types of synergy and economic value: The impact of acquisitions on merging and rival firms. Strategic Management Journal, 7 (2), 119-139.
DATTA, D. K., PINCHES, G. E., NARAYANAN, V. K. (1992). Factors influencing wealth creation from mergers and acquisitions: A meta‐analysis. Strategic Management
Journal, 13 (1), 67-84.
Ernst & Young, Mergers And Acquisitions Report Turkey 2013. http://www.ey.com/ Publication/vwLUAssets/EY_Mergers_and_Acquistion_Report_2013/$FILE/EY M&A Report.
HEKİMOĞLU, M. H., TANYERİ, B. (2011). Türk şirket birleşmelerinin satın alınan şirketlerin hisse senedi fiyatları üzerindeki etkileri. İktisat İşletme ve Finans, 26 (308), 53-70.
HORN, H., LEVINSOHN, J. (2001). Merger policies and trade liberalisation. The Economic
Journal, 111 (470), 244-276.
HORN, H., PERSSON, L. (2001). The equilibrium ownership of an international oligopoly. Journal of International Economics, 53(2), 307-333.
LEVY, H., SARNAT, M. (1970). International diversification of investment portfolios. The
American Economic Review, 668-675.
MACKINLAY, A.C. (1997). Event studies in economics and finance. Journal of economic
literature, 13-39.
MALMENDIER, U., MORETTI, E., PETERS, F.S. (2012). Winning by losing: evidence on
the long-run effects of mergers (No. w18024). National Bureau of Economic Research.
MYERS, S.C., MAJLUF, N.S. (1984). Corporate financing and investment decisions when firms have information that investors do not have. Journal of financial economics, 13 (2), 187-221.
RAU, P.R., VERMAELEN, T. (1998). Glamour, value and the post-acquisition performance of acquiring firms. Journal of financial economics, 49 (2), 223-253.
SETH, A. (1990). Value creation in acquisitions: A re‐examination of performance issues. Strategic Management Journal, 11 (2), 99-115.
WILLIAMSON, O.E. (1981). The economics of organization: The transaction cost approach. American journal of sociology, 548-577.