RESEARCH ARTICLE
143
EXPERIMENTAL ANALYSIS OF THE AIR DEFROST PROCESS IN AN INDUSTRIAL COOLING SYSTEM
Süleyman ERTEN1, Meltem KOŞAN2,*, Furkan İŞGEN3, Mustafa AKTAŞ4 1 Nurdil Technical Cooling, Ankara, [email protected]
,
ORCID: 0000-0002-7811-6148
2 Gazi University, Technology Faculty, Energy Systems Engineering, Ankara, [email protected] ORCID:0000-0001-7311-9342
3 Gazi University, Technology Faculty, Energy Systems Engineering, Ankara, [email protected], ORCID:0000-0002-3299-6485
4 Gazi University, Technology Faculty, Energy Systems Engineering, Ankara, [email protected], ORCID:0000-0003-1187-5120
Received Date:02.07.2020 Accepted Date: 19.11.2020
ABSTRACT
Keeping product temperatures homogeneous is an important problem in defrosted industrial coolers. In this study, it is aimed to obtain findings that will shed light on researchers and producers by analyzing the defrosting process of the industrial cooler. For these reasons, the system was designed using R290 (propane), a new generation refrigerant with a single evaporator, double condenser and double compressor, in order to ensure homogeneous cooling. By keeping the cooled products in the range of – 1 ℃ and +5 ℃ as required by the standard, during the experiment, temperature-pressure measurements of the refrigerated products and cooling system equipment were taken from certain points every minute and test data were recorded. The average temperature and relative humidity values measured minute of the environment where the experimental setup is located was calculated as 25℃ ±1℃ and 60% ± 0.02%, respectively. During the experiment, eight defrost operations were performed, and it was observed that the average temperature values taken from the products during the 24 hours during defrosting changed to 3.07℃. During the experiment, the highest and lowest temperatures of the cooled products were measured as 4.22℃ and 2.02℃. Increased product temperatures and cooling stopped during defrosting increased the power consumption in the system. In order to observe the effect of the power consumption on system performance, COP values after each defrost time were calculated as 2.31, 2.30, 2.29, 2.60, 3.36, 3.29, 3.30, 3.49, respectively. When the defrost process of cooling system analyzed, it was seen that the products were successfully cooled at desired temperature ranges in the scope of TS EN ISO 23953-2.
Keywords: Defrost, Industrial Cooling, Efficiency, Heat Pump 1. INTRODUCTION
Vapor compression refrigeration systems are frequently used in terms of both energy efficiency and ease of application [1]. According to the source of the heat, there are vapor compression heat pump systems originating from ground, air and water. Among these, air-source heat pumps (ASHPs) are
Erten, et all., Journal of Scientific Reports-A, Number 45, 143-157, December 2020.
144
widely used in industrial systems. In an environment with 25℃ ± 1℃ temperature and 60% ± 0.02% relative humidity, the dew thermometer temperature of the air is 16.7℃. In this context, ice formation on the surface of the evaporator with a temperature of -10℃ is inevitable.When using an air-borne evaporator with a surface temperature of -10℃ in industrial refrigerators, icing is inevitable in the evaporator. The humid and hot air affects the ice formation rate and the ice thickness formed [2]. Zhu et al. (2015) observed that the ice formation rate increased with the increase of the temperature and relative humidity values of the environment whereas the relative humidity of the environment rather than temperature had a greater effect on the ice formation rate. In addition, they separated frost formation as light, medium and severe ice formation regions, respectively [3]. During the ice formation phase on the evaporator surface, Guo et al. (2008) have shown that the relative humidity of the ambient air develops at a constant rate of 10-15 minutes at an ice formation rate above 65%. They stated that there was a decrease in the ice formation rate in the next 5 minutes and that it developed very rapidly in the next time period [4].
The defrost layer, which increases over time in the evaporator wall, adversely affects the heat transfer due to the high heat transfer resistance of the ice. The increase in the thickness of the defrost layer causes Coefficient of Performance (COP) values of the ASHP unit to decrease and prevent the airflow outside the evaporator, causing high-pressure losses on the airside. Wang et al. (2019) observed that when the ice formation reached the severe ice formation zone, the defrosting time ranged from 20 minutes to 60 minutes in different temperature experiments and the air-side pressure drop varied between 36% to 86% [5]. High pressure drops occurring on the airside will cause an increase in fan power and will cause irregularities in the air circulation in the environment. Defrosting applied towards cooling systems will increase the system performance with heat transfer.
One of the methods commonly used for defrosting is to perform defrosting by operating the system in reverse with the 4-way valve to be used in the cooling system [6]. Although such an application seems to eliminate the problem, the interruption of the cooling process, changes in the ambient temperature during defrosting and the thermal loads released during defrosting cause a decrease in COP value in the cooling system. Therefore, different applications are encountered in the literature that aims to eliminate such effects occurring during defrosting. Byun et al. (2008) applied the defrost operation with by passing hot gas at 0%, 20%, 30%, and 40%, respectively, and examined the effects of these ratios on the system. The highest COP value was obtained when the hot gas by-pass rate was 20% [7]. In the cooling systems, there are also defrost applications performed by placing the external electrical resistance directly on the serpantine or by placing on the fan blowing air to the serpantine [2,8]. Long et al. (2014) carried out the defrosting process by making use of the waste heat of the compressor and achieved a 1.4% increase in the COP value [9]. Liu et al. (2017) stated that the defrost operation to be performed by storing the heat discharged from the condenser in the phase-changing material in the home type refrigerators will create 71% less energy consumption compared to the electric defrost application [10]. Ice melting in the evaporator where icing occurs, passing over other ice masses with the effect of gravity, both prolongs the defrost time and reduces the performance of the cooler. For this reason, proper removal of water dissolved during defrosting also increases cooling efficiency [11, 12].
In this study, analyzes were made that will shed light on the solution of the problems caused by the application of defrosting of the vapor compression refrigeration system, which is becoming
Erten, et all., Journal of Scientific Reports-A, Number 45, 143-157, December 2020.
145
increasingly common in food storage and industrial cooling and heating applications. However, in order to provide a homogeneous cooling in the system, a single evaporator, double condenser and double compressor are used. At the same time, the cooling system is designed using R290 (propane), which is one of the new generation refrigerants.
2. MATERIAL AND METHOD
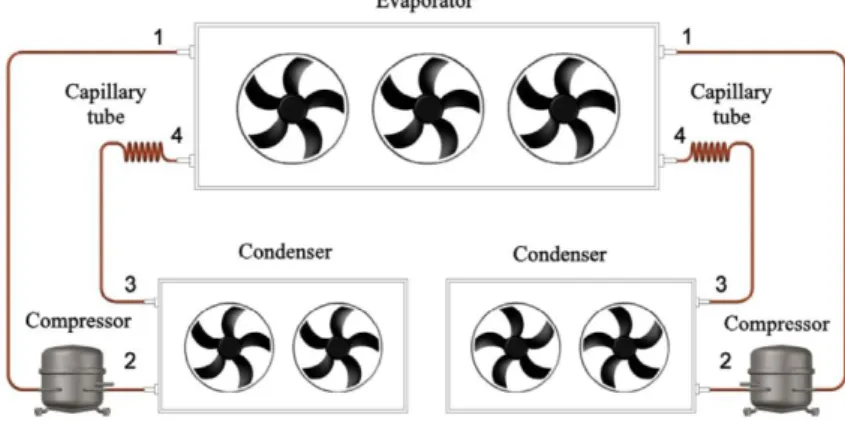
In this study, it is aimed to investigate the defrosting process in the air source industrial cooling system. Vapor compression industrial cooling system operating with vertical type open, positive, R290 (Propane) refrigerant was designed, manufactured and tested by calculating the cooling load. The cooling system has a single evaporator, double compressor and double condenser, as can be seen in Figure 1a. Thus, it was desired to provide homogeneous cooling on the products. The tests were carried out in the test room under Class-3 at 25 ℃ ±1℃ temperature and 60% ± 0.02% relative humidity (% RH).A visual of the experimental setup is shown in Figure 1b.
Figure 1a. Vapor compression refrigeration system.
Erten, et all., Journal of Scientific Reports-A, Number 45, 143-157, December 2020.
146
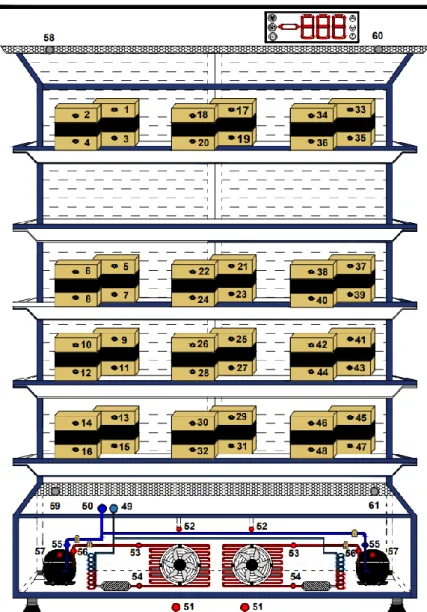
In the defrost system, it is planned to direct the ambient air to the evaporator surface through the fans for a period determined at certain time intervals, and defrosting is performed. In general, defrosting is repeated 8 times a day for 15-25 minutes in this type of cooler. In this experimental study, defrost was performed in the system every three hours. The experimental set-up and measurement points are shown in Figure 2.
Figure 2. Cooling system and measuring points.
1-48 Test package temperature values 56 Compressor discharge line temperature value
49 Evaporator inlet temperature value 57 Compressor body temperature value
Erten, et all., Journal of Scientific Reports-A, Number 45, 143-157, December 2020.
147
51 Condenser air inlet temperature value 59 Left side intake air temperature value
52 Condenser air outlet temperature value 60 Right side blowing air temperature value
53 Condenser gas inlet temperature value 61 Right side intake air temperature value
54 Condenser liquid output temperature value HP High pressure value
55 Compressor suction temperature value LP Low pressure value
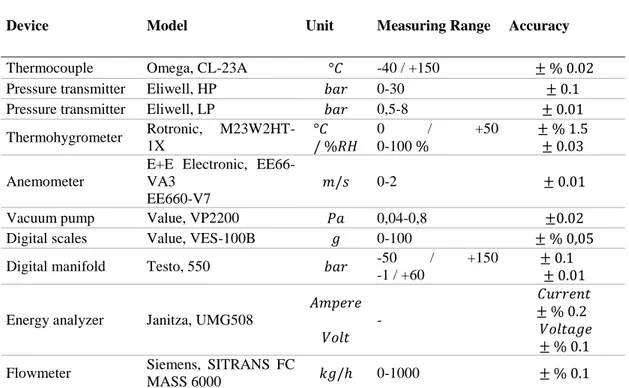
The experiments were carried out in the test room with calibrated test devices within the scope of TS EN ISO 23953-2 standard. Cooling performance of the system, energy consumption amount measurement, temperature measurements, pressure measurements and energy efficiency tests were performed. While performing these tests, temperature measurements were taken every minute by means of thermocouples from certain points of cooling systems equipment (compressor, condenser and evaporator inlet-outlet temperature values). Information on measurement equipment used in prototype production and tests is given in Table 1.
Table 1. Measurement devices and their technical features used in prototype production and tests.
Device Model Unit Measuring Range Accuracy
Thermocouple Omega, CL-23A °𝐶 -40 / +150 ± % 0.02
Pressure transmitter Eliwell, HP 𝑏𝑎𝑟 0-30 ± 0.1
Pressure transmitter Eliwell, LP 𝑏𝑎𝑟 0,5-8 ± 0.01
Thermohygrometer Rotronic, M23W2HT-1X °𝐶 / %𝑅𝐻 0 / +50 0-100 % ± % 1.5 ± 0.03 Anemometer
E+E Electronic, EE66-VA3
EE660-V7
𝑚/𝑠 0-2 ± 0.01
Vacuum pump Value, VP2200 𝑃𝑎 0,04-0,8 ±0.02
Digital scales Value, VES-100B 𝑔 0-100 ± % 0,05
Digital manifold Testo, 550 𝑏𝑎𝑟 -50 / +150
-1 / +60
± 0.1 ± 0.01 Energy analyzer Janitza, UMG508
𝐴𝑚𝑝𝑒𝑟𝑒 𝑉𝑜𝑙𝑡 - 𝐶𝑢𝑟𝑟𝑒𝑛𝑡 ± % 0.2 𝑉𝑜𝑙𝑡𝑎𝑔𝑒 ± % 0.1
Flowmeter Siemens, SITRANS FC
MASS 6000 𝑘𝑔/ℎ 0-1000 ± % 0.1
2.1. Defrost Process
Defrost is the name given in the cooling technique for the elimination or melting of the icing and snowing formed by the water vapor condensing on the cool surfaces of the coolers (evaporator). Ice or snow accumulating on the evaporator surface is undesirable and causes loss of efficiency while making heat transfer difficult. At the same time, the amount of energy spent on defrosting to solve ice or snowing in cooling systems reaches large sizes, as it is not effectively controlled. An additional
Erten, et all., Journal of Scientific Reports-A, Number 45, 143-157, December 2020.
148
cooling load is created by consuming energy for defrosting or by sending hot fluid from the outside to the cold room.
Defrost methods that can be applied in solid-state cooling systems of water vapors condensed on the cool surfaces (evaporator) of coolers; It can be classified as air (with fans), hot gas, electric resistance (resistance), water. The aqueous method is not very common. In practice, defrost methods with hot air fans, hot gas and electrical resistance are frequently used [2-12].
In industrial cooling systems, the heat is given to defrost during the defrosting process, the interruption of the cooling process causes heat to be stored on the ambient air and products. As these thermal loads are met, the compressor consumes more energy than it should be, increasing the energy consumption of the cooling system and thus the energy costs. The following practical approaches can be made in the selection of defrost methods.
Especially for positive cabinets with an ambient temperature above 0 ℃, air defrost can be preferred. In this method, when the compressor is stopped by the digital thermostat, the fans do not stop and defrost is performed with ambient air.
Hot gas defrost method can be preferred in cabinets with an ambient temperature of -10 ℃. However, in this method, a liquid trap should be added to the compressor return line to prevent the liquid refrigerant that will accumulate in the evaporator after defrosting.
In negative freezer cabinets with an ambient temperature of -18 ℃, hot gas may not be sufficient for defrosting and may become inefficient due to prolonged time. Therefore, in deep cooling applications, electric resistance defrosting should be preferred [13].
2.2. Theoretical Analysis
The amount of energy to be stored in the ice accumulated on the evaporator coil of the industrial cooler is calculated with the equation given below [14,15]:
𝑄 = 𝑚𝑖𝑐𝑒. . 𝐿 (1)
Evaporator capacity of the cooler can be calculated with the following equation:
𝑄̇𝑒= 𝑚̇𝑟 . (ℎ1− ℎ4) (2)
The compressor power that will meet the cooling load in the industrial cooler and create the desired pressure difference in the cooling system can be determined with the following equation:
𝑊̇𝑐 = 𝑚̇𝑟 . (ℎ2− ℎ1) (3)
Cooling coefficient of performance of the industrial refrigeration cycle [16,17]: 𝐶𝑂𝑃 = 𝑄̇𝑒
Erten, et all., Journal of Scientific Reports-A, Number 45, 143-157, December 2020.
149
Carnot coefficient of performance of the industrial refrigeration cycle can be calculated as below: 𝐶𝑂𝑃𝑐𝑎𝑟= 𝑇𝑇𝐿
𝐻−𝑇𝐿 (5)
The second law efficiency of the industrial cooling system can be found by the ratio of the coefficient of performance of cooling the system to the carnot coefficient of performance at the same conditions [18]:
𝜂 =𝐶𝑂𝑃𝐶𝑂𝑃
𝑐𝑎𝑟 (6)
Fan power to circulate the cool air blown through the evaporator [18]:
𝑊̇𝑓=
𝑉̇ . ∆𝑝 𝜂𝑓
(7)
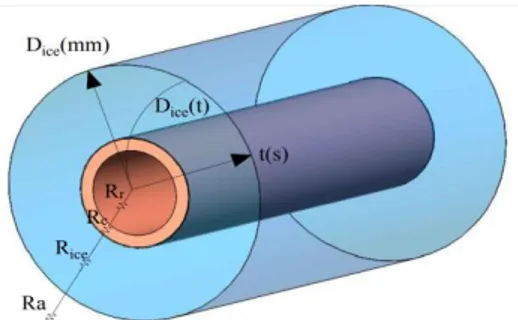
In calculating the total heat transfer coefficient in the evaporator, the Eq. (8) was created by taking into account the thermal resistances formed by the cooling fluid passing through the evaporator, the evaporator coil thickness, the ice increasing over time and the external air (Fig 3). Using this equation, the total transfer coefficient (U) can be calculated from the interior wall of the evaporator until ambient air is reached.
Figure 3.The icing on the evaporator and representation of the thermal resistance network.
1 𝑈. 𝐴= 1 𝐴 . ℎ𝑟+ 𝑙𝑛 (𝐷𝑜 𝐷𝑖) 2. 𝜋. 𝑙. 𝑘+ 𝑙𝑛 (∫ 𝐷𝑖𝑐𝑒(𝑡)𝑑𝑡 𝑡𝑠 𝑡𝑖 𝑡 . 𝐷𝑖𝑐𝑒 𝑖 ) 2. 𝜋. 𝑙. 𝑘𝑖𝑐𝑒 + 1 𝐴. ℎ𝑎𝑖𝑟 (8)
The logarithmic temperature difference can be calculated with the following equation [15]: ∆𝑇𝑙𝑛 =
∆𝑇1− ∆𝑇2
ln (∆𝑇1
∆𝑇2)
(9)
The equation used in determining the amount of heat extracted from the air per unit time with the evaporator is given below [15]:
Erten, et all., Journal of Scientific Reports-A, Number 45, 143-157, December 2020.
150
𝑄̇𝑒= 𝑈. 𝐴. [∆𝑇𝑙𝑛] (10)
3. RESULTS AND DISCUSSIONS
In the experimental setup shown in Figure 2 within the scope of TS EN ISO 23953-2 standard, the air defrost process was observed and tested 8 times. During the experiment, average air temperature and relative humidity values of the test room were measured as 25 ℃±1℃ and 60%±0.02%, respectively. Despite this measured temperature and relative humidity, the dew thermometer temperature was found to be 16.7 ℃ from the psychrometric diagram. This value indicated that the air with the measured conditions could create dehumidification on the surface where the water in the air hit when it hit a surface with a temperature of 16.7 ℃ or lower.
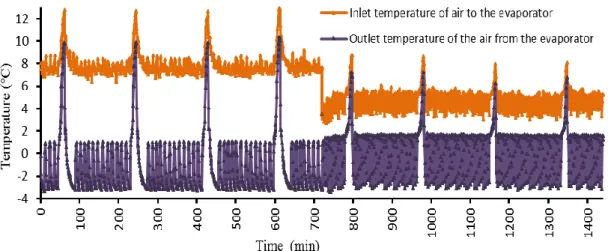
The variation of the evaporator inlet and outlet air temperature over time is shown in Figure 4. In the system, the change in the instantaneous power consumption of the compressor until the first defrost time is given in Figure 5, and the time-dependent change of the refrigerant's evaporator inlet temperature is given in Figure 6. As seen in Figure 4, the evaporator surface was below the dew point temperature with a temperature of 10.19℃ from the beginning, so dehumidification started on the surface. Despite the condensation of water, it is seen in Figure 7 that the formation of ice occurred after the evaporator surface temperature dropped below the freezing temperature of the water as a result of a 2-minute period in the experiment.
Figure 4. The variation of evaporator inlet and outlet air temperature over time.
As can be seen in Figure 4, the air passing through the evaporator has been subjected to temperature fluctuations caused by the start-stop of the compressor by controlling of the cooling system set temperature value. The effect of increased thermal resistance caused by ice formation in the experiment is understood by the increase in the temperature of the evaporator outlet air at the end of each cooling period. However, since the increased ice thickness on the evaporator surface could decrease the cross-sectional area where the air passed, it could increase the differential pressure in the airflow.
Erten, et all., Journal of Scientific Reports-A, Number 45, 143-157, December 2020.
151
Figure 5. The change in the instantaneous power consumption of the compressor during the first defrost period.
Increased temperatures of the products during defrost require more cooling power due to the increased temperatures. For this reason, as seen in Figure 5, after the defrosting of the compressor, it peaked in the power consumption at 185 minutes to meet the cooling load.
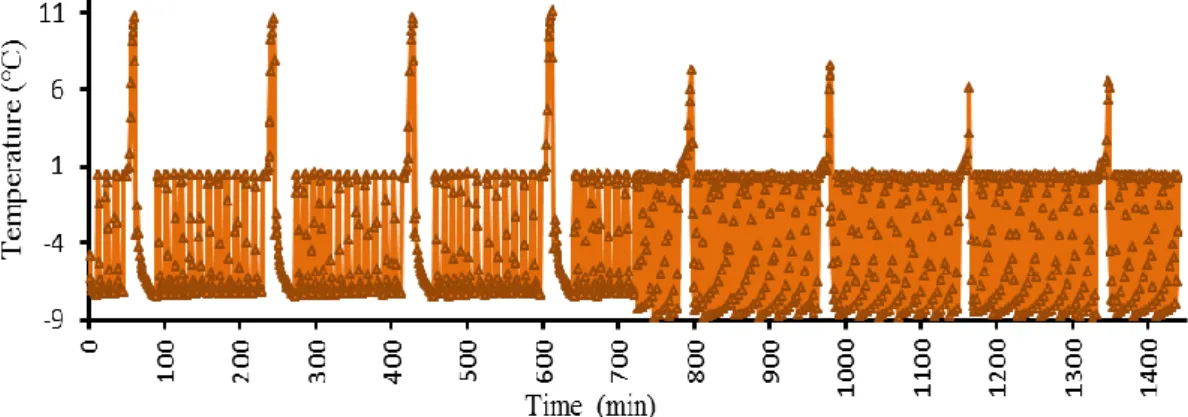
Figure 6. Time-dependent change of refrigerant temperature entering the evaporator.
It is noteworthy that in Figure 6 and Figure 7, where the inlet and outlet temperature values of the evaporator surface are given, the formation of ice on the evaporator surface increased rapidly as the temperature drops to -6 ℃ within a period of 10 minutes after the first defrost operation. The heat conduction coefficient of ice was low compared to the heat conduction coefficient of the material used in the evaporator. For this reason, it is known that the formation of ice, which increases the thickness of the surface over time, will be negatively affected by reducing the total heat transfer.
Erten, et all., Journal of Scientific Reports-A, Number 45, 143-157, December 2020.
152
Figure 7. Time dependent change of refrigerant outlet temperature from evaporator.
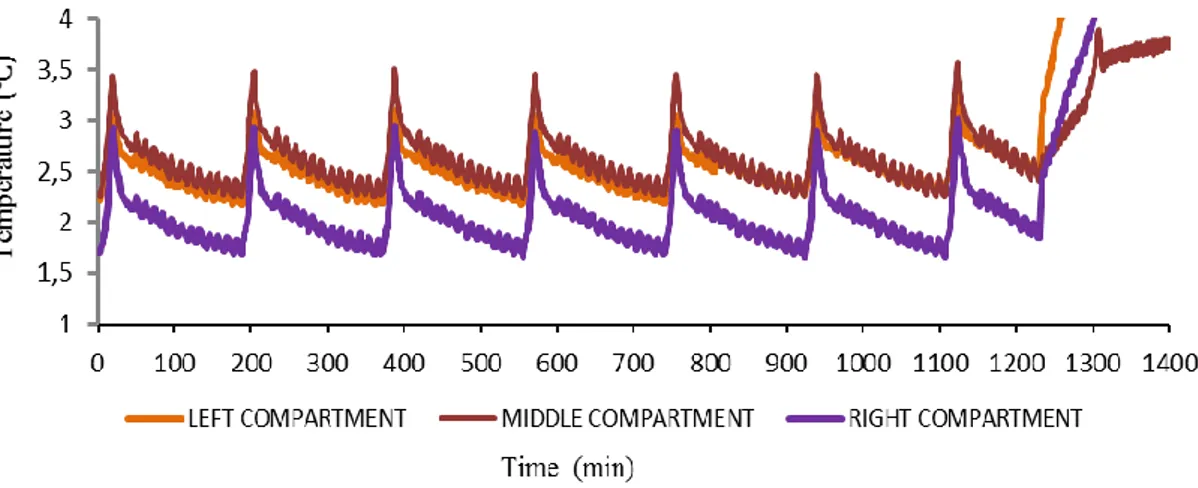
In the experiment, package temperatures of 48 products, which were located in different compartments of the industrial cooler, were measured with thermocouples. As a result of these measurements, the average temperature values of the products in the left, middle and right compartments were calculated as 2.92℃, 2.74℃ and 2.34℃, respectively. As can be seen in Figure 8, it is observed that the temperature values of the products in different compartments in the industrial cooler increased overtime during the defrosting process and then decreased again. This temperature change was measured as an average 3.07 ℃ on products.
Figure 8. Variations of the temperature values of the products placed in the industrial cooler over time.
Increasing power consumption after defrost operations can be seen in Figure 9 whereas COP value decreases as seen in Figure 10. When Figure 9 and Figure 10 are examined in more detail, it is seen that the power consumption and COP values change with each defrosts operation compared to the
Erten, et all., Journal of Scientific Reports-A, Number 45, 143-157, December 2020.
153
previous defrost operation. The reason for this is thought to be the most appropriate defrost time not being achieved in every defrost period.
Figure 9. Average power values calculated after each defrost.
Figure 10. Variations of COP values calculated after each defrost time.
In Figure 9, when the power value of the cooling system is evaluated an increase in the average power consumption is observed after the first defrost operations. This situation was caused by a 15-minutes interruption of cooling with the defrosting process; however, unmet heat gains during defrosting could be caused. It was observed that there was an increase in power value in the parts up to the fourth defrost operation of the compressor while a decrease in power value was seen in the final defrost operations. In the scope of TS EN ISO 23953-2standard, this, situation was caused that in the experimental setup, the first 12 hours of lighting and night curtains remained open, and in the next 12 hours, the power value of the system decreased as a result of closing the night curtain and lighting. Considering the changing values in the power value of the cooling system, as shown in Figure 10, the coefficient of performance of the system was affected by this change.
Erten, et all., Journal of Scientific Reports-A, Number 45, 143-157, December 2020.
154 4. CONCLUSION
In this study, an industrial refrigerant using R-290 refrigerant and air defrost method has been designed, manufactured and tested. It is aimed to obtain findings that will shed light on researchers and manufacturers by analyzing the effect of defrosting on cooling performance and on refrigerated products. As a result of the temperature measurements taken from 48 points on the experimental setup, the average temperature values of the cooled products in the left, middle and right compartments are 2.92 ℃, 2.74 ℃ and 2.34 ℃, respectively, and the average product temperature is 2.664 ℃. From the test data, an average of 3.07 ℃ changes in the temperature of the products cooled during the defrosting process was observed. Eight defrost operations were performed during the system operation, and the COP values calculated before each defrost operation were found as 2.13, 2.31, 2.30, 2.29, 2.60, 3.36, 3.29, 3.30, 3.49, respectively. In the designed and tested system, the products cooled in terms of the cooling technique of the defrosting process measured the highest temperature of 4.22℃ and the lowest 2.02℃ in the products during the experiment, and the results were found to comply with the TS EN ISO 23953-2 standard M1 class. The suggestions given below can be presented regarding the air defrost process.
Despite the changing ambient conditions in cooling systems, performing defrosting at the appropriate defrost time will increase the COP value of the cooling system while reducing energy consumption. Intelligent systems that can determine the defrost time according to the conditions of the defrost application in the cooling system will increase the performance of the cooling system.
Energy efficiency can be achieved for defrosting by using the heat delivered in the condenser to the environment with the usage of this heat during defrost. Evaporator design is important for the melting of ice and the flow of air. With its vertical or horizontal positioning the design of the evaporator coil can significantly affect the heat transfer, which will shorten the defrost time. In future studies, more effective defrost methods can be developed instead of stopping the compressor during defrost.
ACKNOWLEDGEMENTS
We would like to thank Nurdil Teknik Cooling Inc. for its contributions to this work.
REFERENCES
[1] Qu, M., Xia, L., Deng, S., & Jiang, Y. (2012). An experimental investigation on reverse-cycle defrosting performance for an air source heat pump using an electronic expansion valve. Applied Energy, 97, 327–333.
[2] Kwak, K. and Bai, C., (2010), A study on the performance enhancement of heat pump using electric heater under the frosting condition: Heat pump under frosting condition, Applied Thermal Engineering, 30(6-7), 539–543.
[3] Zhu, J.H., Sun, Y.Y., Wang, W., Deng, S.M., Ge, Y.J. and Li, L.T., (2015), Developing a new frosting map to guide defrosting control for air-source heat pump units, Applied Thermal Engineering, 90, 782-791.
Erten, et all., Journal of Scientific Reports-A, Number 45, 143-157, December 2020.
155
[4] Guo, X.M., Chen, Y.G., Wang, W.H. and Chen, C.Z, (2008), Experimental study on frost growth and dynamic performance of air source heat pump system, Applied Thermal Engineering, 28 (17-18), 2267–2278.
[5] Wang, W., Zhang, S., Li, Z., Sun, Y., Deng, S. and Wu, X., (2019), Determination of the optimal defrosting initiating time point for an ASHP unit based on the minimum loss coefficient in the nominal output heating energy, Energy, 191, 116505.
[6] Hewitta, N. and Huang, M.J., (2008), Defrost cycle performance for a circular shape evaporator air source heat pump, International Journal of Refrigeration, 31, 444–452.
[7] Byun, J.S., Lee, J. and Jeon, C.D., (2008), Frost retardation of an air-source heat pump by the hot gas bypass method, International Journal of Refrigeration, 31, 328–334.
[8] Egelandsdal, B., Abie, S.M., Bjarnadottir, S., Zhu, H., Kolstad, H., Bjerke, F., Martinsen, O.G., Mason. A. and Münch, D., (2019), Detectability of the degree of freeze damage in meat depends on analytic-tool selection. Meat Science, 152, 8-19.
[9] Long, Z., Jiankai, D., Yiqiang, J. and Yang, Y., (2014), A novel defrosting method using heat energy dissipated by the compressor of an air source heat pump, Applied Energy, 133, 101–111. [10] Liu, Z., Li, A., Wang, Q., Chi, Y. and Zhang, L., (2017), Experimental study on a new type of
thermal storage defrosting system for frost-free household refrigerators, Applied Thermal Engineering, 118, 256–265.
[11] Song, M., Pan, D., Li, N. and Deng, S., (2015), An experimental study on the negative effects of downwards flow of the melted frost over a multi-circuit outdoor coil in an air source heat pump during reverse cycle defrosting, Applied Energy, 138, 598–604.
[12] Mengjie, S., Deng, S., Pan, D. and Ning, M., (2014), An experimental study on the effects of downwards flowing of melted frost over a vertical multi-circuit outdoor coil in an air source heat pump on defrosting performance during reverse cycle defrosting, Applied Thermal Engineering, 67(1-2), 258–265.
[13] Green T, Luckmann E, The secret behind danfoss adaptive defrost (BE327320541044en-000101). Danfoss: 2020.
[14] Aktaş, M., Koşan, M., Arslan, E. and Tuncer, A.D., (2019), Designing a novel solar-assisted heat pump system with modification of a thermal energy storage unit, Proc IMechE Part A: J Power and Energy, 233(5): 588-603.
[15] Tuncer, A.D., Mavuş, R., Gökçe, C., Koşan, M. and Aktaş, M., (2019), Efficient Energy Systems Models for Sustainable Food Processing, Turkish Journal of Agriculture: Food Science and Technology, 7, 1138-1145.
Erten, et all., Journal of Scientific Reports-A, Number 45, 143-157, December 2020.
156
[16] Koşan, M., Demirtaş, M., Aktaş, M. and Dişli, E., (2020), Performance analyses of sustainable PV/T assisted heat pump drying system, Solar Energy, 199: 657-672.
[17] Caner, M., Duman, N., Buyruk, E. and Kılınç F., (2019), Performance Analysİs of Horizontal Ground Source Heat Pump System in Sıvas, Journal of Science and Technology of Dumlupinar University, 42, 47-53.
[18] Cengel, Y.A. and Boles, M.A., (2014), Thermodynamics: An Engineering Approach, McGraw-HillHigher Education.
NOMENCLATURE Acronyms
ASHP Air source heat pump COP Coefficient of Performance Symbols
Q Energy required to melt ice (kJ) Q̇ Evaporator capacity (kW) 𝑚 Mass of melting ice (kg) L Latent heat of melting (kJ/kg) ṁ Refrigerant mass flow rate (kg/s) Ẇ power input (kW)
T temperature (oC)
η efficiency
V̇ Volumetric flow rate of air (m3/s)
∆p Air side pressure drop across an evaporator (Pa) RH Relative humidity (%)
HP Compressor discharge pressure (Pa) LP Compressor suction pressure (Pa) U Total heat transfer coefficient (W/m2.K) h Heat transfer coefficient (W/m2.K)
𝑙 Serpantine length of evaporator condition (m) 𝑡 Defrosting time (s)
∆𝑇 Temperature difference (oC)
𝐴 Area (m2) ℎ Enthalpy (kJ/kg)
𝑘 Heat conduction coefficient (W/m.K)
D Diameter (m) R Thermal resistance (W/m.K) Subscripts 𝑎 air 𝑠 surface 𝑙𝑚 logarithmic mean L low H high
Erten, et all., Journal of Scientific Reports-A, Number 45, 143-157, December 2020.
157 4 evaporator refrigerant inlet
1 evaporator refrigerant outlet or compressor refrigerant inlet 2 compressor refrigerant outlet
𝑜 outer
𝑖 inner
𝑟 refrigerant
𝑖𝑐𝑒 ice formed in the evaporator𝑖𝑐𝑒 𝑜 ice outer diameter 𝑖𝑐𝑒 𝑖 ice inner diameter
𝑐 compressor
e evaporator
𝑓 fan