Comparison of Anisotropic Analytical Algorithm and
Acuros XB Calculation Algorithms on Intensity-modulated
Radiotherapy and Volumetric Modulated Arc Therapy
Techniques for Nasal Cavity and Paranasal Sinus Tumors:
Effects on Integral Radiation Dose
Received: August 19, 2019 Accepted: August 27, 2019 Online: October 27, 2019 Accessible online at: www.onkder.org
Aydın ÇAKIR,1 Züleyha AKGÜN2
1İstanbul Bilgi University, Vocational School, İstanbul-Turkey
2Department of Radiation Oncology, Memorial Şişli Hospital, İstanbul-Turkey
OBJECTIVE
This study aims to investigate the dosimetric effects of Acuros XB (AXB) and Anisotropic Analytical algorithms (AAA) on intensity-modulated radiotherapy (IMRT) and volumetric modulated arc therapy (VMAT) techniques for nasal cavity and paranasal sinus tumors.
METHODS
This study included 10 patients with the nasal cavity and paranasal sinus tumors, and 7-field non-copla-nar IMRT plan and VMAT plans were generated with 6-MV photon beams specially selected for each patient anatomy. The effects on planning target volume (PTV) and organ-at-risk (OAR) were evaluated using AXB and AAA in each treatment technique to compare the accuracy of the calculation.
RESULTS
Conformity Index (CI) values for PTV were found to be 1.02±0.02 and 1.03±0.03 for VMATAAA and VMATAXB plans, respectively and 1.18±0.03 and 1.20±0.02 for IMRTAAA and IMRTAXB plans, respectively. Regarding heterogeneity index (HI) values, VMATAAA and VMATAXB plans (0.025±0.02; 0.029±0.02) were found to have better HI values than IMRTAAA and IMRTAXB plans (0.246±0.02; 0.335±0.03). De-pending on the technique and algorithm used, a dose difference of 4%-14% was detected between PTV Dmin values.
CONCLUSION
The selection of AXB algorithm in treatment regions with high tissue heterogeneity will give more ac-curate dose calculation results for PTV and healthy tissues.
Keywords: Anisotropic analytical algorithm; Acuros XB; nasal cavity, radiotherapy for paranasal sinus; integral dose. Copyright © 2019, Turkish Society for Radiation Oncology
Introduction
Radiotherapy significantly contributes to reducing the risk of postoperative local recurrence in the treatment of nasal cavity tumors. The application of
radiother-apy for nasal cavity tumors is very difficult due to the presence of critical organs and large air cavity in the treatment site. The build-up effect seen in the transi-tion from air to tissue encounters a secondary build-up effect in the nasal region. It is very difficult to achieve
Dr. Aydın ÇAKIR İstanbul Bilgi Üniversitesi, Meslek Yüksekokulu, İstanbul-Turkey
E-mail: [email protected]
OPEN ACCESS This work is licensed under a Creative Commons Attribution-NonCommercial 4.0 International License.
accurate approach to patient dose calculation with het-erogeneities like air, lung, bone, and implants with dif-ferent density. Linear Boltzmann Transport Equation describes the macroscopic behavior of the radiation beam in the medium through which it passes.[7–8]
To our knowledge, in the relevant literature, there are no studies emphasizing the importance of using calculation algorithms using VMAT and IMRT tech-niques for nasal cavity and paranasal sinus tumors. The most recent study on nasal cavity and paranasal sinus tumors was conducted by Jeong et al.[3] in 2014. They compared the dosimetric results of VMAT and IMRT techniques which were compared only regarding PTV and critical organ doses.
To contribute to the literature, the present study aims to investigate the effects of the calculation al-gorithm on treatment plans made using IMRT and VMAT techniques in radiotherapy of nasal cavity tu-mors. This study investigated the effects of calculation differences between AXB and AAA algorithms on PTV and critical organ doses for nasal and paranasal sinus tumors with large air mass.
Materials and Methods
Eclipse Treatment Planning System
Eclipse™ Treatment Planning System version 13.0 (Varian, Palo Alto, California, USA) is designed for three-dimensional conformal radiotherapy (3D CRT), IMRT, VMAT, stereotactic radiosurgery (SRS)/stereo-tactic body radiotherapy (SBRT) and electron plan-ning. The Eclipse treatment planning system used in our clinic includes dose-volume optimizer (DVO), plan geometry optimization (PGO), progressive reso-lution optimizer (PRO), multi-resoreso-lution dose calcula-tion (MRDC), pencil beam convolucalcula-tion (PBC), AAA and AXB algorithms.
Analytical Anisotropic Algorithm
The AAA dose calculation model is a three-dimen-sional (3D) pencil beam and convolution superpo-sition algorithm consisting of separate models for primary photons, scattered photons, and electrons scattered from beam regulating devices (primary colli-mator, beam straightening filter, and wedge filter). The functional forms forming the basic physical quantities initiate a process by considering the device properties. This usually results in a significant reduction in the computational time required for such algorithms. Tis-sue heterogeneities are anisotropically taken into ac-count in the 3-dimensional neighborhood using mul-homogenous dose distribution within the planned
target volume (PTV). The surrounding tissues are ex-posed to high integral doses to remove the cold spots in the PTV.[1–3]
The integral dose (ID) is the volume integral of the dose stored in a medium and is equal to the average dose received by the medium multiplied by its volume. It is also the area under the differential absolute dose-volume histogram curve. Published studies suggest that a large number of beam and monitor units (MU) used in intensity-modulated radiotherapy (IMRT) may cause an increase in ID and high-energy photon beams substantially reduce ID. D’Souza et al. reported that the change in ID with four or more beams is a function of the number of beams. High-energy beams reduce the ID as expected. The reduction rate was reported to be 1.5%-1.7% for the nasopharynx, 0.9%-1.0% and 0.3% for the pancreas and 0.4% for the prostate. In differ-ent beam-weighted two, four, and eight-field plans, ID was reported as 1.4%-2.1% for the nasopharynx, 0.2%-1.3% for the pancreas and 0.5% for the prostate. These results show that the ID decreases with increasing tu-mor size for similar anatomical dimensions, whereas it increases with the increasing size of the anatomical region for similar tumor sizes.[4]
There are chemical structural elements in the hu-man body, and it is, therefore, a medium with different density. Air, bone, adipose tissue and lungs measure about -1000 Hounsfield unit (HU), +1000 HU, -50-100 HU and -500 HU, respectively. The reduction of radi-ation in the tissue is calculated with the help of com-puted tomography (CT) data and calibration curves using HU values obtained from CT and tables specific to predefined density ranges. The accuracy of the algo-rithms (dose calculation mechanisms) that can include tissue composition in determining the dose in each or-gan may be different.
In Eclipse™ Treatment Planning System version 13.0 (Varian Medical Systems, Palo Alto, CA), the an-alytical anisotropic algorithm (AAA) method is widely used for the calculation of dose distributions.
There are studies in the literature reporting that the dose calculation made using AAA was significantly in-accurate. In particular, it has been observed that it cal-culates the dose inaccurate when near the two media during the transition from tissue to air.[5–6] Recently, a new dose calculation algorithm called Acuros XB (AXB) has been introduced by Varian (Varian Medical Systems, Palo Alto, CA) to fix this situation. Acuros XB uses a complex technique to solve Linear Boltz-mann Transport Equation (LBTE) and provides an
tiple lateral photon scattering kernels. The final dose distribution occurs by overlapping the contribution of photon and electron beams. The AAA algorithm calculates the dose behind the airspace to some extent due to an error that arises from modelling the scattered dose.[9–11]
Acuros XB Algorithm
The AXB algorithm was developed for two strategic needs–accuracy and speed–in external photon beam treatment planning. Acuros XB uses a complex tech-nique to solve Linear Boltzmann Transport Equation (LBTE) and fully exploits patient dose calculation for heterogeneities due to lung, bone, air and non-biolog-ical implants.[7]
Instead of Boltzman Transport Equation (BTE), which describes the macroscopic behaviour of radia-tion particles, LBTE – its linear form – assumes that interaction in the environment where radiation par-ticles penetrate occurs without the parpar-ticles contact-ing with each other in the medium and without an external magnetic field.[7–8] There are two solution approaches that try to explain LBTE. One of the ap-proaches is the Monte Carlo method, which does not clearly solve LBTE and produces indirect solutions for LBTE. The second approach is solving LBTE using nu-merical methods.
Although Monte Carlo and LBTE solution meth-ods provide similar results, they cannot produce clear solutions and result in errors. Monte Carlo errors are random and result from that a limited number of par-ticles are simulated. Systematic errors may occur when the Monte Carlo method uses precise techniques to speed up solution time.
The source model of the AXB algorithm used in the Eclipse TPS uses the existing AAA source model. This model includes primary photons, out-of-focus pho-tons, contaminant electrons and scattered photons.
Fogliata et al.[9] reported that a lower dose of 3% to 6% was obtained with AXB on critical organs com-pared to AAA. They reported that a lower dose (3.6% to 3.7%) was obtained with AXB in the same volume of lungs receiving V5 and V20 doses.
The AXB algorithm can calculate the dose more accurately than the AAA using the mass density in-formation obtained from the CT images in each voxel for the dose calculation. The calculation difference between the two algorithms is affected by parameters, such as the energy of the incoming beam, the field size and the electron density of the medium.
Treatment Planning of Nasal Cavity and Paranasal Sinus Tumors
In this study, CT data with a 2 mm cross-sectional thickness of 10 patients with the nasal cavity and paranasal sinus tumors admitted to our clinic were used. Varian TrueBeam STx using 6 MV beams was used for treatment planning. Non-coplanar IMRT and VMAT plans were made through the Eclipse treatment planning system.
The selected dose calculation algorithm and tech-niques were compared. In the IMRT technique, model
IMRTAAA was created for the AAA algorithm, and
model IMRTAXB was created for the AXB algorithm.
Similarly, in the VMAT technique, model VMATAAA
was created for the AAA algorithm, and model VMATAXB was created for the AXB algorithm.
a- IMRT Planning Technique
For each patient’s anatomy and tumor location, 7-field non-coplanar treatment areas were selected. Table angle was chosen as 90° for non-coplanar areas in a way that the selected treatment areas were not paral-lel to each other. A collimator angle of 5-10° was used to minimize the tongue-and-groove effect created by treatment areas.
b- VMAT Planning Technique
The beam angles were selected as follows: counter-clockwise from 179.90-180.10 with a collimator angle
of 300, a couch angle of 0° and clockwise from 180.10-
179.90 with a collimator angle of 330°, a couch angle
of 0°.
Treatment planning was performed for each pa-tient using AAA and AXB algorithms. In all planning, the calculation grid size (CGS) of 1 mm was selected to reduce the effects of CGS on dose distribution.
Dosimetric Evaluation of the Treatment Plans
Each treatment plan was evaluated in terms of PTV and organ-at-risk (OAR) using dose-volume his-tograms (DVH) and taking into account the criteria of the Radiation Therapy Oncology Group (RTOG). In each treatment planning, 95% of PTV was ensured to receive at least 50 Gy as the primary dose limitation. The followings were calculated: PTVD98, which was considered a low dose zone for PTV, PTV D2, which was a high dose zone for PTV, minimum dose of PTV (PTV Dmin), mean dose values received by PTV (PTV Dmean), and heterogeneity index (HI) and conformality index (CI) for PTV.
In terms of PTV Dmin doses, the highest difference
was observed between the IMRTAAA and VMATAXB
plans, which was 14%. The least difference was between the IMRTAAA and VMATAAA plans, which was 4%. This difference was due to the calculation algorithm, not the treatment technique used.
Concerning PTV Dmean doses, the highest
dif-ference was found to be between the IMRTAAA and
IMRTAXB plans, which was 4%, and the least differ-ence was between the IMRTAAA and VMATAAA plans, which was <1%.
Regarding PTV D2 doses, the highest difference
was between the IMRTAAA and VMATAXB plans, which
was 6%, and the least difference was between the IMRTAAA and VMATAAA plans, which was <1%.
In terms of PTV D98 doses, the highest difference was between the IMRTAAA and IMRTAXB plans, which
was 3%, and the least difference was between the IMRTAAA and VMATAAA plans, which was <1%. There was a difference between VMATAAA and VMATAXB.
When evaluated in terms of left and right op-tic nerve, there was a significant difference between
IMRT and VMAT in all plans (IMRTAAA, IMRTAXB,
VMATAAA, VMATAXB).
When evaluated concerning optic chiasm doses, there was a significant difference between IMRT and VMAT in all plans (IMRTAAA, IMRTAXB, VMATAAA,
VMATAXB).
Concerning the left eye, there was a significant
difference between VMATAXB and IMRTAAA plans
Quality Assurance of the Treatment Plans
Arc CHECK (Sun Nuclear Corporation, FL-USA) phantom providing 3D comparison was used for qual-ity assurance (QA) of the patient treatment plans. Four different QA plans were prepared for each patient treat-ment plan using the IMRT and VMAT techniques. Dose difference (DD) and distance-to-agreement (DTA) were selected as 2% and 2 mm in gamma analysis.
Results
a- Evaluation of Dose-Volume Histograms
The dosimetric results for the treatment plans made using two different algorithms are shown in Table 1. Table 1 presents the PTVD98 that was considered a low
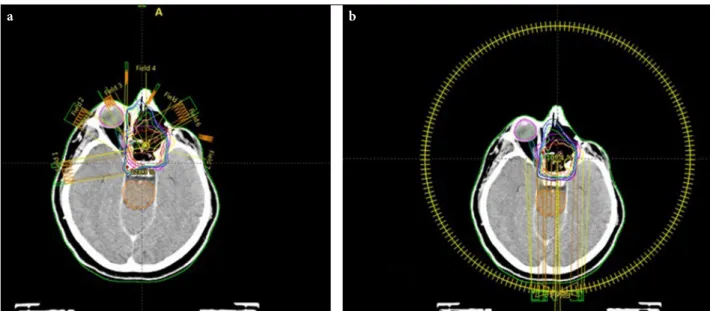
dose zone for PTV, PTV D2 that was a high dose area for PTV, PTV Dmin, and PTV Dmean. Furthermore, CI and HI values in PTV for both treatment techniques and calculation algorithms are shown. When the CI and HI values of the treatment plans were examined, CI and HI values were found to be higher in the treatment plans made using the VMAT technique compared to the IMRT technique. An example of a treatment plan calculated for two different algorithms using IMRT and VMAT treatment techniques is shown in Figure 1 a-b, and comparative mean DVH for this study is shown in Figure 2 a-j.
When Table 1 is examined, it is seen that there is a significant difference between the two techniques con-cerning HI and CI values for PTV.
Fig. 1. (a) An example of the treatment plan for the IMRT technique. (b) An example of the treatment plan for VMAT
technique.
(p=0.027), whereas no significant difference was
observed between VMATAXB and IMRTAXB plans
(p=0.062).
In terms of the right eye, there was a significant
difference between VMATAXB and IMRTAAA plans
(p=0.039), whereas no significant difference was Fig. 2. Dose-Volume Histogram of the IMRT and VMAT treatment plans produced using two different algorithms: (a)
Planning target volume (PTV) (b) Left optic nerve (c) Right optic nerve (d) Optic chiasm (e) Left eye (f) Right eye (g) Left lens (h) Right lens (i) Brainstem (j) Spinal cord.
IMRTAAA: Dose-volume histogram of the IMRT treatment plan produced using AAA algorithm. IMRTAXB: Dose-volume histogram of the IMRT treatment plan produced using AXB algorithm. VMATAAA: Dose-volume histogram of the VMAT treatment plan produced using AAA algorithm. VMATAXB: Dose-volume histogram of the VMAT treatment plan produced using AXB algorithm.
a c d b e f g h i j
observed between VMATAXB and IMRTAXB plans (p=0.058).
Left and right lens doses were found to be higher in VMAT technique than in IMRT technique. In both tech-niques, the AXB algorithm determined a higher dose than AAA. This increase was due to the increase in small doses in the VMAT technique, which leads to some dose increase on critical organs with a small volume.
It can be further seen in Table 1 that there is some increase in the brainstem and spinal cord doses in the VMAT technique.
b- Evaluation of the Quality Assurance of the Patient Treatment Plans
Four different QA plans were prepared for each
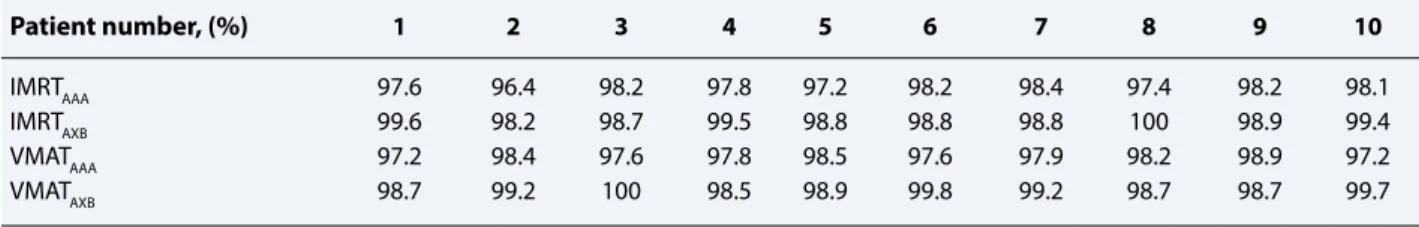
pa-tient treatment plan using the IMRT and VMAT tech-niques. Dose difference (DD) and distance-to-agree-ment (DTA) were selected as 2% and 2 mm in gamma analysis. Gamma analysis evaluations are shown in Table 2.
When Table 2 is examined, the choice of AXB instead of the AAA algorithm as the calculation al-gorithm in the IMRT and VMAT techniques had a significant effect on the results of gamma analysis evaluation. In both techniques, selecting the calcula-tion algorithm as AXB increased the gamma passing rate to over 98%. The AXB algorithm increased the consistency between the dose calculated on the treat-ment planning computer and the dose measured on the treatment device.
Table 1 Dosimetric results of treatment plans: IMRTAAA: IMRT treatment plan produced using AAA algorithm. IMRTAXB: IMRT
treatment plan produced using the AXB algorithm. VMATAAA: VMAT treatment plan produced using AAA algorithm. VMATAXB: Dosimetric results of VMAT treatment plan produced using AXB algorithm.
Parameter IMRTAAA IMRTAXB VMATAAA VMATAXB p ( VMATAXB)
Dose (cGy) Dose (cGy) Dose (cGy) Dose (cGy)
IMRTAAA IMRTAXB VMATAAA
Mean±SD Mean±SD Mean±SD Mean±SD
PTV Dmin 4549±137 3931±110 4344±423 3948±269 0.011 0.440 0.021 PTV Dmean 5176±108 5286±229 5178±132 5369±105 0.035 0.048 0.022 PTV D2 5298±148 5479±298 5332±121 5609±28 0.012 0.024 0.017 PTV D98 4931±16 4793±101 4918±25 4810±74 0.033 0.067 0.032 HI 0.335±0.03 0.246±0.02 0.025±0.02 0.029±0.02 0.012 0.032 0.025 CI 1.18±0.03 1.20±0.025 1.02±0.02 1.03±0.03 0.024 0.021 0.044 Left optic nerve 3057±230 3200±218 2648±177 3005±178 0.048 0.034 0.001 Right optic nerve 3113±258 3216±251 3098±267 3351±270 0.028 0.034 0.021 Optic chiasm 2265±235 2414±225 2346±239 2506±217 0.018 0.038 0.032 Left eye 1846±188 1910±182 1785±173 2013±180 0.027 0.062 0.018 Right eye 2951±306 2992±318 2833±301 2970±293 0.039 0.058 0.033 Left lens 306±150 327±125 560±153 613±136 0.002 0.001 0.045 Right lens 325±162 372±172 553±161 594±163 0.001 0.002 0.048 Brainstem 1633±210 1650±150 1717±148 1710±189 0.110 0.141 0.069 Spinal cord 586±175 593±178 617±195 624±181 0.064 0.087 0.174
Table 2 Gamma evaluation for treatment plans: IMRTAAA: IMRT treatment plan produced using the AAA algorithm.
IMRTAXB: IMRT treatment plan produced using the AXB algorithm. VMATAAA: VMAT treatment plan produced using AAA algorithm. VMATAXB: Treatment plan quality control of the VMAT treatment plan produced using the AXB algorithm. The comparison of gamma index passing rates of the IMRT and VMAT planning at 2% dose difference (DD) and 2 mm distance to agreement (DTA) criteria.
Patient number, (%) 1 2 3 4 5 6 7 8 9 10
IMRTAAA 97.6 96.4 98.2 97.8 97.2 98.2 98.4 97.4 98.2 98.1
IMRTAXB 99.6 98.2 98.7 99.5 98.8 98.8 98.8 100 98.9 99.4
VMATAAA 97.2 98.4 97.6 97.8 98.5 97.6 97.9 98.2 98.9 97.2
Discussion
There are many studies on dosimetric phantom that aim to determine the calculation accuracy of treat-ment planning systems. Studies have shown that the AXB algorithm provides more accurate results than the AAA algorithm in heterogeneous environments. One of the factors affecting calculation accuracy is the selected CGS.[12–15] In our previous study, dose es-timation has been shown to be correlated with CGS. Our study highlights a very important point that there is a 5% difference between AAA plans with 1-mm CGS
and AXB plans with 1-mm CGS regarding PTV Dmin
values. There was a 4% difference between AAA plans with 1-mm CGS and AAA plans with 2.5-mm CGS, whereas there was a 1% difference between AXB plans with 1-mm CGS and AXB plans with 2.5-mm CGS. A significant improvement was observed in the dose ac-curacy of AXB plans with 1-mm CGS. The smaller CGS results in a better sampling of the structure voxels.[13]
In the phantom study with 6 MV photon beams by Bush et al.,[6] they showed that there was a 4.5% differ-ence between AXB and Monte Carlo algorithms in the transition from air to tissue, which increased to 13% with AAA algorithm. In parallel with this study, Kan et al.[16] reported in their dosimetric phantom study that there was a 3% difference between the measurement and the calculated dose by AXB algorithm in the tran-sition from air to tissue and this difference increased to 10% with AAA. In a phantom study by Suresh et al. on esophageal cancer, the dose of PTV Dmin was calculated to be lower by 2.5% in AXB and by 9.1% in AAA.[17]
In our study that investigated the effects of the AAA algorithm and AXB algorithm on critical organ doses in breast radiotherapy, the findings showed that AAA calculated 2%, 2%, 8%, and 4% more dose for the left lung, heart, contralateral breast, and contralateral lung, respectively.[18]
In a study conducted by Padmanaban et al.,[19] AAA and AXB algorithms were compared using 3D conformal, and VMAT techniques in the treatment of esophageal cancer and the AXB algorithm was found to determine a low dose in PTV (0.5-1.3 Gy) compared to AAA. They showed that the low dose in PTV ob-tained for AXB was not related to the technique used.
The most remarkable side of our study was that the dose of PTV, which started after the air cavity, was cal-culated higher with the AAA algorithm. There was a 14% between AAA plans and AXB plans in determin-ing PTV Dmin dose. A higher dose than should be in the build-up area between air and tissue was obtained
with the AAA algorithm. The higher dose in PTV will increase the maximum dose effect in the hot dose re-gions as a result of the normalization of the plan to the treatment dose.
The literature review has shown that there are no studies emphasizing the importance of using calcula-tion algorithms with the VMAT and IMRT techniques for nasal cavity and paranasal sinus tumors. The most recent study on nasal cavity and paranasal sinus tu-mors was conducted by Jeong et al. in 2014 in which the dosimetric results of the VMAT and IMRT tech-niques were compared. In this study, the IMRT and VMAT treatment techniques were compared only in terms of PTV and critical organ doses.[3]
Compared to the IMRT technique, the VMAT technique provides great convenience concerning optimization. Variable gantry speeds, simultaneous multi-leaf collimator (MLC) motion, and dose rate variability allow the dose to be adjusted at the desired site. However, the VMAT technique shows an increase in some low dose sites compared to the IMRT tech-nique. This increase leads to an increase in critical or-gan doses, particularly in healthy tissues with a small volume.[20]
Conclusion
The present study has revealed that the calculation dif-ferences between AXB and AAA algorithms used in the radiation therapy for nasal cavity and paranasal si-nus cancers caused significant differences in the stored integral doses on critical organs. The AAA algorithm calculates the dose behind the airspace to some extent due to an error resulting from modelling the scattered dose.
In daily patient set-ups, two-dimensional (2D) image registration using kV–kV/MV–kV or image-guided radiation therapy (IGRT) methods like three--dimensional cone beam computerized tomography (CBCT) allow the correction of changes to occur in patient anatomy. The applicability of non-coplanar IMRT plans is more difficult than the VMAT tech-nique. There is no possibility of image acquisition for each treatment area and table angle. Taking these dif-ficulties into consideration, the VMAT technique will be more appropriate for both patient positioning and treatment.
In conclusion, radiotherapy for nasal cavity tumors and the accuracy of dose delivery are quite difficult due to the anatomical structure of the region, where we are pushing critical dose limits for critical organs, and
different density tissues. Similar to the different tissue densities within the treatment area, many devices in-creasing the dosimetric uncertainty due to the patient stabilizing devices also affect the dose in the patient. It should be noted that treatment planning algorithms do not have the ability to accurately calculate the dose during air-to-tissue transitions. The AAA algorithm calculates the dose behind the airspace to some extent due to an error resulting from modelling the scattered dose. It should be further kept in mind that the VMAT technique provides similar and even better results with the IMRT technique regarding HI and CI evaluation. The selection of the AXB algorithm in the VMAT tech-nique is of great importance for the accuracy of the cal-culation and for evaluating the doses to be received by the critical organs.
Peer-review: Externally peer-reviewed. Conflict of Interest: None declared. Financial Support: None declared.
Authorship contributions: Concept – A.Ç., Z.A..; Design
– A.Ç., Z.A.; Supervision – A.Ç., Z.A.; Materials – A.Ç., Z.A.; Data collection &/or processing – A.Ç., Z.A.; Analysis and/ or interpretation – A.Ç., Z.A.; Literature search – A.Ç., Z.A.; Writing – A.Ç., Z.A.; Critical review – A.Ç., Z.A.
References
1. Huang D, Xia P, Akazawa P, Akazawa C, Quivey JM, Verhey LJ, et al. Comparison of treatment plans using intensity-modulated radiotherapy and three--dimensional conformal radiotherapy for paranasal sinus carcinoma. Int J Radiat Oncol Biol Phys 2003;56(1):158−68.
2. Sheng K, Molloy JA, Larner JM, Read PW. A dosimet-ric comparison of non-coplanar IMRT versus Helical Tomotherapy for nasal cavity and paranasal sinus cancer. Radiother Oncol 2007;82(2):174−8.
3. Jeong Y, Lee SW, Kwak J, Cho I, Yoon SM, Kim JH, et al. A dosimetric comparison of volumetric modu-lated arc therapy (VMAT) and non-coplanar intensity modulated radiotherapy (IMRT) for nasal cavity and paranasal sinus cancer. Radiat Oncol 2014;9:193. 4. D’Souza WD, Rosen II. Nontumor integral dose
vari-ation in conventional radiotherapy treatment plan-ning. Med Phys 2003;30(8):2065−71.
5. Vassiliev O, Wareing T, McGhee J, Failla G, Saleh-pour M, Mourtada F. Validation of a New Grid Based Blotzmann Equation Solver for Dose Calculation in Radiotherapy with Photon Beams. Phys Med Biol 2010;55(3):581−98.
6. Bush K, Gagne IM, Zavgorodni, Ansbacher S, Beck-ham W. Dosimetric Validation of Acuros XB with Monte Carlo Methods for Photon Dose Calculations. Med Phys 2011;38(4):2208−21.
7. Hoffmann L, Jørgensen MB, Muren LP, Petersen JB. Clinical Validation of the Acuros XB Photon Dose Calculation Algorithm, a Grid-Based Boltzmann Equation Solver. Acta Oncol 2012;51(3):376−85. 8. Han T, Mikell J, Salehpour M, Mourtada F.
Dosimet-ric Comparison of Acuros XB Deterministic Radia-tion Transport Method with Monte Carlo and Model Based Convolution Methods in Heterogeneous Me-dia. Med Phys 2011;38(5):2651−64.
9. Fogliata A, Nicolini G, Clivio A, Vanetti E, Cozzi L. Critical appraisal of Acuros XB and Anisotropic An-alytic Algorithm dose calculation in advanced non-small-cell lung cancer treatments. Journ Clin Oncol 2012;83(5):1587−95.
10. Fogliata A, Nicolini G, Clivio A, Vanetti E, Cozzi L. On the dosimetric impact of inhomogeneity manage-ment in the Acuros XB algorithm for breast treatmanage-ment. Radiat Oncol 2011;6(1):103.
11. Han T, Mourtada F, Kisling K, Mikell J, Followill D, Howell R. Experimental Validation of Deterministic Acuros XB Algorithm for IMRT and VMAT Dose Calculation with Radiological Physics Center’s Head and Neck Phantom. Med Phys 2012;39(4):2193−2202. 12. Huang B, Wu L, Lin P, Chen C. Dose calculation of
Acuros XB and Anisotropic Analytical Algorithm in lung stereotactic body radiotherapy treatment with flattening filter free beams and the potential role of calculation grid size. Radiat Oncol 2015;10:53.
13. Cakir A. Dosimetric comparison of Anisotropic Ana-lytical Algorithm and Acuros XB in Stereotactic Body Radiotherapy and effect of calculation grid size. Turk J Oncol 2017;32(3):100–5.
14. Chung H, Jin H, Palta J, Suh TS, Kim S. Dose vari-ations with varying calculation grid size in head and neck IMRT. Phys Med Biol 2006;51(19):4841−56. 15. Mittauer K, Lu B, Yan G, Kahler D, Gopal A, Amdur
R, et al. A study of IMRT planning parameters on planning efficiency, delivery efficiency, and plan qual-ity. Med Phys 2013;40(6):061704.
16. Kan M, Leung L, Yu P. Verification and Dosimetric Impact of Acuros XB Algorithm on Intensity Mo-dulated Stereotactic Radiotherapy for Locally Per-sistent Nasopharyngeal Carcinoma. Med Phys 2012; 39(8):4705−14.
17. Suresh R, Kevin R, Shyam P, Terry L, Daniel R, Christopher B. Acuros XB Algorithm vs. Anisotropic Analytical Algorithm: A Dosimetric study using het-ergeneous phantom and computed tomography (CT) data sets of esophageal cancer patients. Journal of Cancer Therapy 2013;4(1):138−44.
18. Cakir A, Akgun Z. Dosimetric comparison of integral radiation dose: Anisotropic Analytical Algorithm and Acuros XB in Breast Radiotherapy. Int Journ of Med-ical Phys, Clin Eng and Radiat Oncol 2019;8:57−67. 19. Padmanaban S, Warren S, Walsh A, Partridge M,
Hawkins A. Comparison of Acuros (AXB) and Anisotropic Analytical Algorithm (AAA) for dose
cal-culation in treatment of oesophageal cancer: effects on modelling tumour control probability. Radiat Oncol 2014;9:286.
20. Guckenberger M, Richter A, Krieger T, Wilbert J, Baier K, Flentje M. Is a single arc sufficient in volumetric-modulated arc therapy (VMAT) for complex-shaped target volumes? Radiother Oncol 2009; 93(2):259−65.