JHEP11(2015)172
Published for SISSA by SpringerReceived: September 18, 2015 Accepted: November 3, 2015 Published: November 24, 2015
Measurement of the t¯
tW and t¯
tZ production cross
sections in pp collisions at
√
s = 8 TeV with the
ATLAS detector
The ATLAS collaboration
E-mail: [email protected]Abstract: The production cross sections of top-quark pairs in association with massive vector bosons have been measured using data from pp collisions at√s = 8 TeV. The dataset corresponds to an integrated luminosity of 20.3 fb−1 collected by the ATLAS detector in 2012 at the LHC. Final states with two, three or four leptons are considered. A fit to the data considering the t¯tW and t¯tZ processes simultaneously yields a significance of 5.0σ (4.2σ) over the background-only hypothesis for t¯tW (t¯tZ) production. The measured cross sections are σt¯tW = 369+100−91 fb and σt¯tZ = 176+58−52fb. The background-only hypothesis with
neither t¯tW nor t¯tZ production is excluded at 7.1σ. All measurements are consistent with next-to-leading-order calculations for the t¯tW and t¯tZ processes.
Keywords: Electroweak interaction, Hadron-Hadron scattering, Top physics
JHEP11(2015)172
Contents
1 Introduction 1
2 The ATLAS detector 2
3 Simulated event samples 3
4 Object reconstruction 5
5 Event selection and background estimation 7
5.1 Opposite-sign dilepton channel 7
5.2 Same-sign dilepton channel 9
5.3 Trilepton channel 14
5.4 Tetralepton channel 16
6 Systematic uncertainties 19
6.1 Uncertainties on reconstructed objects 20
6.2 Uncertainties on signal modelling 20
6.3 Uncertainties on background modelling 21
7 Results 23
8 Conclusion 25
The ATLAS collaboration 32
1 Introduction
The top quark is the heaviest known elementary particle, and its large coupling to the Higgs boson suggests that it might be closely connected to electroweak (EW) symmetry breaking. Despite the fact that the top quark was discovered two decades ago [1,2] some of its properties, in particular, its coupling to the Z boson, have never been directly measured. Several extensions of the Standard Model, such as technicolour [3–7] or other scenarios with a strongly coupled Higgs sector [8] modify the top quark couplings.
With the centre-of-mass energy and integrated luminosity of the collected data sam-ples at the Large Hadron Collider (LHC), the processes in which the electroweak Standard Model bosons (γ, Z, W and H) are produced in association with top quarks become ex-perimentally accessible. Measurements of the t¯tZ, t¯tγ and t¯tH processes provide a means of directly determining top quark couplings to bosons [9–11], while the t¯tW process is a Standard Model (SM) source of same-sign dilepton events, which are a signature of many
JHEP11(2015)172
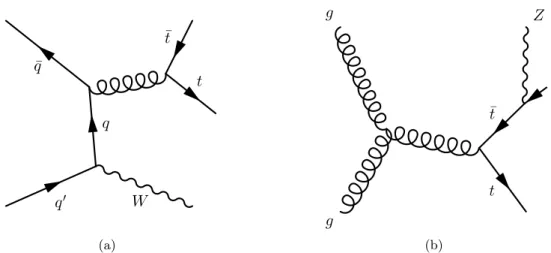
q0 q W ¯ q t ¯ t (a) t ¯ t g g Z (b)Figure 1. Example leading-order Feynman diagrams for (a) t¯tW and (b) t¯tZ production.
models of physics beyond the SM. Example leading-order Feynman diagrams for t¯tW and t¯tZ production at the LHC are shown in figure 1. Previous searches for t¯tW and t¯tZ production at the LHC have been carried out by the CMS collaboration at √s = 7 TeV and √s = 8 TeV [12,13].
This paper presents measurements of the t¯tW and t¯tZ cross sections based on an analysis of 20.3 fb−1 of proton-proton (pp) collision data at √s = 8 TeV collected by the ATLAS detector. Depending on the decays of the top quarks, W and Z bosons, between zero and four prompt, isolated leptons1 may be produced. Channels with two (both with
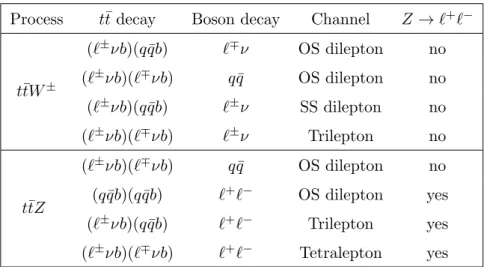
same-sign and opposite-sign charge), three, and four leptons are considered in this analysis. The opposite-sign (OS) dilepton, trilepton and tetralepton channels are mostly sensitive to t¯tZ production, while the same-sign (SS) dilepton channel targets t¯tW production. Table1 lists the analysis channels and the targeted decay modes of the t¯tW and t¯tZ processes. Each channel is divided into multiple analysis regions in order to enhance the sensitivity to the signal. A simultaneous fit is performed to all signal regions and selected control regions in the four channels to extract cross sections for t¯tW and t¯tZ production.
2 The ATLAS detector
The ATLAS detector [14] consists of four main subsystems: an inner tracking system, electromagnetic (EM) and hadronic calorimeters, and a muon spectrometer. The inner detector provides tracking information from pixel and silicon microstrip detectors in the pseudorapidity2 range |η| < 2.5 and from a transition radiation tracker (TRT) covering
1
In this paper, lepton is used to denote electron or muon, including those coming from leptonic tau decays.
2
ATLAS uses a right-handed coordinate system with its origin at the nominal interaction point (IP) in the centre of the detector and the z-axis coinciding with the axis of the beam pipe. The x-axis points from the IP to the centre of the LHC ring, and the y-axis points upward. Cylindrical coordinates (r,φ) are used in the transverse plane, φ being the azimuthal angle around the beam pipe. The pseudorapidity is defined in terms of the polar angle θ as η = − ln tan(θ/2), and the distance between two objects in η − φ space is measured in terms of ∆R ≡p(∆η)2+ (∆φ)2.
JHEP11(2015)172
Process t¯t decay Boson decay Channel Z → `+`−
t¯tW± (`±νb)(q ¯qb) `∓ν OS dilepton no (`±νb)(`∓νb) q ¯q OS dilepton no (`±νb)(q ¯qb) `±ν SS dilepton no (`±νb)(`∓νb) `±ν Trilepton no t¯tZ (`±νb)(`∓νb) q ¯q OS dilepton no (q ¯qb)(q ¯qb) `+`− OS dilepton yes (`±νb)(q ¯qb) `+`− Trilepton yes (`±νb)(`∓νb) `+`− Tetralepton yes
Table 1. List of t¯tW and t¯tZ decay modes and analysis channels targeting them. The last column indicates whether a final state lepton pair is expected from a Z boson decay.
|η| < 2.0, all immersed in a 2 T magnetic field provided by a superconducting solenoid. The EM sampling calorimeter uses lead and liquid argon (LAr) and is divided into bar-rel (|η| < 1.475) and endcap (1.375 < |η| < 3.2) regions. Hadron calorimetry is pro-vided by a steel/scintillator-tile calorimeter, segmented into three barrel structures in the range |η| < 1.7, and two copper/LAr hadronic endcap calorimeters that cover the region 1.5 < |η| < 3.2. The solid angle coverage is completed with forward copper/LAr and tung-sten/LAr calorimeter modules, optimised for EM and hadronic measurements respectively, and covering the region 3.1 < |η| < 4.9. The muon spectrometer measures the deflection of muon tracks in the range |η| < 2.7 using multiple layers of high-precision tracking cham-bers located in toroidal magnetic fields of approximately 0.5 T and 1 T in the central and endcap regions of ATLAS, respectively. The muon spectrometer is also instrumented with separate trigger chambers covering |η| < 2.4.
3 Simulated event samples
Monte Carlo (MC) samples are used to optimise the event selection and the choice of signal regions, and to model all signal and certain background processes. In the following, the simulation of signal and background events is described in detail. For all MC samples, the top quark mass is taken to be mt = 172.5 GeV, and the Higgs boson mass is set to
125 GeV.
The t¯tV (V = W, Z) process is simulated using the Madgraph5 leading-order (LO) generator [15] with up to one additional parton, using the CTEQ6L1 [16] parton distri-bution function (PDF) set. Pythia 6.425 [17] with the AUET2B underlying-event set of tunable parameters (tune) [51] is used to simulate showering and hadronisation. The t¯tV samples are normalised to the inclusive next-to-leading-order (NLO) cross-section pre-dictions, using Madgraph5 aMC@NLO [19], including the off-shell t¯tZ/γ∗ contribution and interference. An invariant mass of at least 5 GeV is required for any opposite-sign, same-flavour pair of leptons appearing in the matrix element. The obtained cross sections
JHEP11(2015)172
are σt¯tW = 232 ± 32 fb and σt¯tZ = 215 ± 30 fb, compatible with other NLO QCD calcu-lations [20, 21]. The quoted uncertainties include renormalisation and factorisation scale and PDF uncertainties, including αS variations.
The Alpgen v2.14 [22] LO generator and the CTEQ6L1 PDF set are used to simulate W/Z production. Parton showers and hadronisation are modelled with Pythia 6.425. The W/Z samples are generated with up to five additional light partons, separately for W/Z, W/Z+b¯b, W/Z+c¯c and W c, and normalised to the respective inclusive next-to-next-to-leading-order (NNLO) theoretical cross sections [23]. To avoid double-counting of partonic configurations generated by both the matrix-element calculation and the parton-shower evolution, a parton-jet matching scheme (MLM matching) [24] is employed. The overlap between W/Z+Q ¯Q (Q = b, c) events generated from the matrix-element calculation and those generated from parton-shower evolution in the W/Z+light-jet samples is avoided via an algorithm based on the distance in η–φ space between the heavy quarks: if ∆R(Q, ¯Q) > 0.4, the matrix-element prediction is used, otherwise the parton-shower prediction is used. Diboson samples are generated using the Sherpa 1.4.1 [25] generator with the CT10 PDF set [26], with massive b- and c-quarks and with up to three additional partons in the LO matrix element. Samples are normalised to their NLO QCD theoretical cross sections [27]. Alternative models for the diboson background are provided by the POWHEG-BOX 2.0 [28–30] generator, which implements the NLO matrix elements, in-terfaced with Pythia 6.425 or Pythia 8.1 [31].
Simulated t¯t and single-top-quark backgrounds corresponding to the t-channel, W t and s-channel production mechanisms are generated using the POWHEG-BOX generator, with the CT10 PDF set. All samples are interfaced with Pythia 6.425 with the CTEQ6L1 PDF set and the Perugia2011C [32] underlying event tune. Overlaps between the t¯t and W t final states are removed through the diagram removal scheme [33]. The t¯t sample is normalised to the Top++2.0 [34] theoretical calculation performed at NNLO in QCD that includes resummation of next-to-next-to-leading logarithmic soft gluon terms [35–39]. The single-top-quark samples are normalised to the approximate NNLO theoretical cross sections [40–42] calculated using the MSTW2008 NNLO PDF set [43,44].
The production of a single top quark in association with a Z boson through the t- and s-channels, of the W tZ process, and of a top quark pair in association with a W boson pair (t¯t W W ) are simulated with Madgraph5 LO and the CTEQ6L1 PDF set. Madgraph is interfaced with Pythia 6.425 using the AUET2B tune and the CTEQ6L1 PDF set. The relevant samples are normalised to the NLO theoretical predictions calculated with Madgraph5 aMC@NLO [19]. The production of three vector bosons that decay to three or four leptons is also simulated with Madgraph5 and Pythia 6.425. The LO cross section obtained from the generator is used to normalise the samples. The production of two W bosons with the same charge is modelled using the Sherpa generator, including diagrams of order α4
EW and α2EWα2S. The LO cross section obtained from the generator is used to
normalise the samples. The four-top-quark process (t¯tt¯t) is simulated with Madgraph5 interfaced with Pythia 8.1.
Associated t¯tH production is simulated using NLO matrix elements obtained from the HELAC-Oneloop package [45]. The POWHEG-BOX program served as an interface
JHEP11(2015)172
for shower MC programs [46]. Samples were produced using the CT10NLO PDF set and showered with Pythia 8.1 with the CTEQ6L1 PDF and the AU2 underlying-event tune [47]. The t¯tH cross section and Higgs boson decay branching fractions are taken from the theoretical calculations collected in ref. [48]. The process gg → H → 4` is modelled using the POWHEG-BOX program interfaced with Pythia 8.1. W H and ZH production are modelled using Pythia 8.1. The samples are normalised to the NNLO QCD cross sections with NLO electroweak corrections [48].
All simulated samples produced with Pythia use Photos 2.15 [49] to simulate pho-ton radiation and Tauola 1.20 [50] to simulate τ decays. Events from minimum-bias interactions from the same bunch crossing as the hard-scattering process and in neighbour-ing bunch crossneighbour-ings, known as pile-up, are simulated with the Pythia 8.1 generator with the MSTW2008 LO PDF set and the AUET2 [18] tune. These are superimposed on the simulated hard-scatter events in a manner which reproduces the luminosity profile of the recorded data.
All samples are processed through a simulation of the detector geometry and re-sponse [52] either using Geant4 [53], or Geant4 with a fast simulation of the calorimeter response [54]. All samples are processed by the same reconstruction software as the data. Simulated events are corrected so that the object identification, reconstruction and trig-ger efficiencies, energy scales and energy resolutions match those determined from data control samples.
4 Object reconstruction
The final states of interest in this analysis contain electrons, muons, jets, b-jets and missing transverse momentum.
Electron candidates [55] are reconstructed from energy deposits (clusters) in the EM calorimeter that are associated with reconstructed tracks in the inner detector. The elec-trons are required to have |ηcluster| < 2.47, where ηcluster is the pseudorapidity of the
calorimeter energy deposit associated with the electron candidate. Candidates in the EM calorimeter barrel/endcap transition region 1.37 < |ηcluster| < 1.52 are excluded. The
electron identification relies on a likelihood-based selection [56].
To reduce the background from misidentified or non-prompt (labelled as “fake” throughout this paper) electrons, i.e. from decays of hadrons (including heavy flavour), electron candidates are required to be isolated. In the opposite-sign dilepton and tetralep-ton channels, in which such background is small, the electron isolation is defined using only tracking information. In the opposite-sign dilepton channel, the ratio of p∆R<0.3
T ,
the sum of track transverse momenta in a cone of size ∆R = 0.3 around the electron track, excluding the electron track itself, to the transverse momentum (pe
T) of the electron
is required to be less than 0.12. In the tetralepton channel, the requirement is loosened to p∆R<0.3
T /peT < 0.18. In the trilepton and same-sign dilepton channels, in which the
background with fake leptons is more prominent, additional requirements are imposed on the electron isolation. For electrons with pe
T < 50 GeV, both the ratio of the additional
calorimeter energy within a cone of ∆R = 0.2 around the electron (E∆R<0.2
T ) to the p
e T of
JHEP11(2015)172
the electron, and p∆R<0.3
T /p
e
T are required to be less than 0.12. For peT ≥ 50 GeV, both
ET∆R<0.2 and p∆R<0.3T are required to be less than 6 GeV.
Muon candidates are reconstructed from track segments in the various layers of the muon spectrometer, and matched with tracks identified in the inner detector [57]. The final muon candidates are refitted using the complete track information from both detector systems, and are required to have |η| < 2.5. Additionally, muons are required to be separated by ∆R > 0.4 from any jet and to satisfy a pT-dependent track-based isolation
requirement [58] that has good performance under high pile-up conditions. This requires that the scalar sum of the track transverse momenta in a cone of variable size ∆R = (10 GeV/pµT) around the muon (excluding the muon track itself) must be less than 0.05pµT. For both the electrons and muons, the track longitudinal impact parameter with re-spect to the primary vertex,3z
0, is required to be less than 2 mm. In the same-sign dilepton
channel, in which backgrounds from fake leptons are dominant, it is also required to satisfy |z0sin θ| < 0.4 mm, and the significance of the transverse impact parameter d0 is required
to satisfy |d0/σ(d0)| < 3, where σ(d0) is the uncertainty on d0.
Jets are reconstructed with the anti-ktalgorithm [59–61] with radius parameter R = 0.4
from calibrated topological clusters [14] built from energy deposits in the calorimeters. Prior to jet finding, a local cluster calibration scheme [62, 63] is applied to correct the topological cluster energies for the effects of non-compensating calorimeter response, dead material and out-of-cluster leakage. The jets are calibrated to restore the jet energy scale to that of jets reconstructed from stable simulated particles, using energy- and η-dependent calibration factors derived from simulations. Additional corrections to account for residual differences between simulation and data are applied [64]. After calibration, jets are required to have pT > 25 GeV and |η| < 2.5. To avoid selecting jets from pile-up interactions, an
additional requirement, referred to as the jet vertex fraction criterion (JVF), is imposed on jets with pT < 50 GeV and |η| < 2.4. It requires that at least 50% of the scalar sum
of the transverse momenta of tracks with pT > 1 GeV, associated with a jet, comes from
tracks compatible with originating from the primary vertex. During jet reconstruction, no distinction is made between identified electrons and jet energy deposits. Therefore, if any of the jets lie within ∆R = 0.2 from an electron, the closest jet is discarded in order to avoid double counting of electrons as jets. After this overlap removal, electrons and muons which lie within ∆R = 0.4 from any remaining jet are removed.
Jets containing b-hadrons are tagged by an algorithm (MV1) [65] that uses multivariate techniques to compute weights by combining information from the impact parameters of displaced tracks as well as topological properties of secondary and tertiary decay vertices reconstructed within the jet. Larger weights indicate that a jet is more likely to contain b-hadrons. The working point used for this measurement corresponds to 70% efficiency to tag a b-quark jet, as determined for b-jets with pT> 20 GeV and |η| < 2.5 in simulated t¯t
events. The rejection factors for light-jets and c-quark jets are approximately 130 and 5, respectively. The efficiency of b-tagging in simulation is corrected to that in data using a t¯t based calibration [66].
3
A primary vertex candidate is defined as a vertex with at least five associated tracks, consistent with the beam collision region. If more than one such vertex is found, the vertex candidate with the largest sum
JHEP11(2015)172
The missing transverse momentum pmiss
T , with magnitude ETmiss, is reconstructed [67]
as the negative sum of transverse momenta of all electrons, muons, jets and calibrated calorimeter energy clusters not associated with any of these objects.
5 Event selection and background estimation
The measurements presented here are based on data collected by the ATLAS experiment in pp collisions at√s = 8 TeV in 2012. The corresponding integrated luminosity is 20.3 fb−1.
Only events collected using a single-electron or single-muon trigger under stable beam conditions, that satisfy the standard data quality criteria, are accepted. The trigger pT
thresholds are 24 or 60 GeV for electrons and 24 or 36 GeV for muons: the triggers with the lower pT thresholds include isolation requirements on the candidate lepton, resulting
in inefficiencies at high pT that are recovered by the triggers with higher pT thresholds.
Events are required to have at least one reconstructed primary vertex. In all selections considered, at least one lepton with pT > 25 GeV is required to match (∆R < 0.15) a
lepton with the same flavour, reconstructed by the trigger algorithm.
Four channels are defined based on the number and charges of the reconstructed lep-tons, which are sorted according to their transverse momentum in decreasing order. For the opposite-sign dilepton channel, two leptons with opposite charge and pT > 15 GeV
are required. In the sign dilepton channel, events are required to contain two same-sign leptons with pT > 25 GeV. In both dilepton channels, events containing additional
leptons with pT > 15 GeV are rejected. For the trilepton channel, events are required to
contain three leptons with pT > 15 GeV. For the tetralepton channel, exactly four
lep-tons with pT > 7 GeV are required. Events satisfying both the trilepton and tetralepton
channel selections are attributed to the trilepton channel and removed from the tetralep-ton channel. The dileptetralep-ton channels are not explicitly required to be orthogonal with the tetralepton channel, but the overlap is found to be negligibly small in simulated samples and non-existent in data.
Background events containing well-identified prompt leptons are modelled by simula-tion. The normalisations used for the backgrounds in this category are taken from data control regions if the resulting normalisation uncertainty is lower than that from the the-oretical prediction. The yields in the data control regions are extrapolated to the signal regions using the simulation. Background sources involving one or more incorrectly iden-tified lepton, e.g. instrumental backgrounds, are modelled using data events from control regions, except in the opposite-sign dilepton channel, where this background is very small. The following sections describe additional selection requirements and the background evaluation in each of the four channels.
5.1 Opposite-sign dilepton channel
In the opposite-sign dilepton channel, events are required to have at least three jets, one or two of which are b-tagged. Two orthogonal selections are defined to separate t¯tW and t¯tZ final states. The first (2`-noZ) selects different-flavour lepton (DF) events with the scalar sum of the pT of leptons and jets, HT, above 130 GeV, and same-flavour lepton
JHEP11(2015)172
(SF) events that are not compatible with Z boson or low-mass resonance production, by requiring |m``− mZ| > 10 GeV, m`` > 15 GeV and ETmiss> 40 GeV. The 2`-Z selection
contains SF events within the mass window |m``− mZ| < 10 GeV. In both selections
an additional requirement on the average distance between two jets, calculated using all possible jet pairs in the event, ∆Rjjave> 0.75, is applied to remove the low-dijet-mass region
where the Alpgen+Pythia simulation does not provide a good description of the Z boson background [68].
For 2`-noZ events, the t¯tV signal contribution originates mainly from the t¯t dilepton final state accompanied by a hadronic W/Z boson decay and from the t¯t single-lepton final state with a leptonic W boson decay. For 2`-Z events, the contribution of t¯tW production is negligible while the t¯tZ contribution comes from the fully hadronic t¯t final state with a leptonic Z boson decay.
After event selection the dominant backgrounds are t¯t and Z production in 2`-noZ and 2`-Z respectively, and the extraction of the signal relies on discriminating it from these backgrounds, based on well-modelled event kinematics. To improve the modelling of the t¯t background, the simulated t¯t events are reweighted to account for the observed differences in the top quark pT and the t¯t system pT between data and Powheg+Pythia
simulation in measurements of differential cross sections at √s = 7 TeV [69]. To improve Z background modelling, the simulation is reweighted to account for the difference in the Z pT spectrum between data and simulation [68], and the ZQ ¯Q (Q = b, c) component
of the Z background is adjusted to match data in a ZQ ¯Q-dominated control region with at least one b-tagged jet. Small background contributions arise from single-top-quark W t channel production, diboson (W W , W Z, ZZ) processes, the associated production of a Higgs boson and a t¯t pair, the associated production of a W W and a t¯t pair, and the associated production of a single top quark and a Z boson. All of these backgrounds are determined from simulation.
In the 2`-noZ region, W boson, t¯t (with a single lepton in the final state) and t- and s-channel single-top-quark production processes can satisfy the selection requirements due to fake leptons. These backgrounds are a small fraction of the total estimated background, and their yields are estimated using simulation and cross-checked with a data-driven technique based on the selection of a same-sign lepton pair.
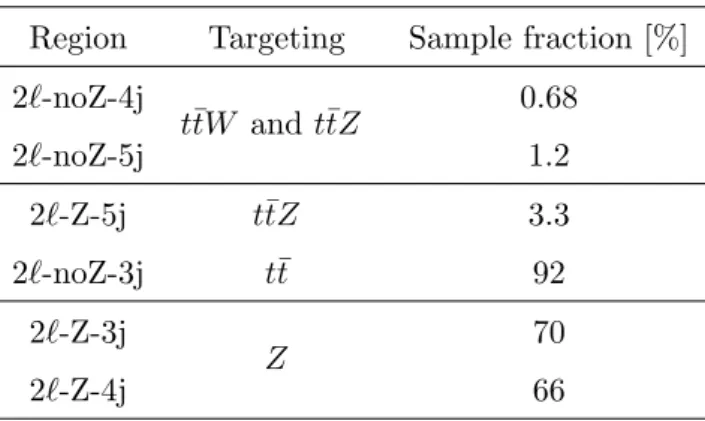
Events are categorised according to the number of jets and the number of b-tagged jets. In the 2`-noZ selection, events with one or two b-tagged jets are separated into three exclusive regions according to the jet multiplicity, with three (2`-noZ-3j), four (2`-noZ-4j), and five or more (2`-noZ-5j) jets. In the 2`-Z selection, events with exactly two b-tagged jets are separated into three regions according to the same scheme: 2`-Z-3j, 2`-Z-4j and 2`-Z-5j.
A neural network (NN) discriminant built using the NeuroBayes [70] package is used to separate the combined t¯tW and t¯tZ signal from the background in the signal-rich regions 2`-noZ-4j, 2`-noZ-5j and 2`-Z-5j. The other regions considered in the opposite-sign dilepton channel have lower sensitivity and are used as control regions; event counting is used in the 2`-noZ-3j region, while the scalar sum of the jet transverse momenta (Hhad
T ) is used as
JHEP11(2015)172
Region Targeting Sample fraction [%]
2`-noZ-4j t¯tW and t¯tZ 0.68 2`-noZ-5j 1.2 2`-Z-5j t¯tZ 3.3 2`-noZ-3j t¯t 92 2`-Z-3j Z 70 2`-Z-4j 66
Table 2. Signal and control regions of the opposite-sign dilepton channel, together with the processes targeted and the expected fraction of the sample represented by the targeted process.
control regions, enriched in t¯t or Z backgrounds, in the fit used to extract the t¯tV signals, strongly constrains the normalisation uncertainties of these backgrounds. This in turn improves the background predictions in the signal-rich regions. The signal and control regions are summarised in table 2.
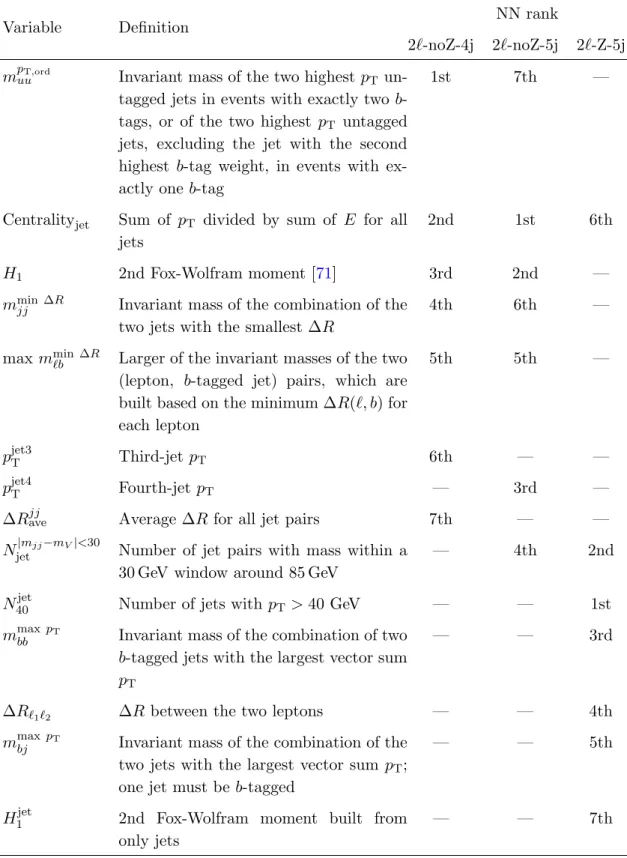
The set of variables used as input to the NN discriminant is chosen separately for each signal region, based on the ranking procedure implemented in the NeuroBayes package which takes into account the statistical separation power of the variables and the corre-lations between them. All variables used for the NN training are required to show good agreement between data and background expectation in the control regions. Seven vari-ables are selected in each signal region. The list of selected varivari-ables and their ranking is shown in table 3.
Figure2illustrates the discrimination between the t¯tV signal and background provided by the NN discriminants. Since in the 2`-noZ region the contributions from both t¯tW and t¯tZ production are comparable in size and have similar kinematics, they result in a similar NN discriminant shape and are thus fitted together. In the 2`-Z region, the t¯tW contribution is negligible, and thus the NN discriminant shape is driven by the t¯tZ signal.
The expected sample compositions in each of the three signal and three control re-gions are summarised in table 4 along with the number of events observed in data. The distributions of discriminants in the control regions are shown in figure 3. The data and simulation agree within the expected uncertainties.
5.2 Same-sign dilepton channel
The same-sign dilepton channel targets the t¯tW process. Events are required to have Emiss
T > 40 GeV, HT> 240 GeV and to contain at least two b-tagged jets. The same-sign
dilepton channel is divided into three orthogonal regions based on the flavour combination of the lepton pair: 2e-SS, eµ-SS, and 2µ-SS. In the 2e-SS region, an additional requirement on the dilepton mass removing events with 75 GeV < mee < 105 GeV is imposed to reduce
the contamination by Z → ee events where the charge of one electron is misidentified. A similar requirement is not imposed on the eµ-SS or 2µ-SS regions, since the probability for the muon charge to be misidentified is found to be negligible, and Z+jets is not a dominant background in the eµ region.
JHEP11(2015)172
Variable Definition NN rank
2`-noZ-4j 2`-noZ-5j 2`-Z-5j mpT,ord
uu Invariant mass of the two highest pT
un-tagged jets in events with exactly two b-tags, or of the two highest pT untagged
jets, excluding the jet with the second highest b-tag weight, in events with ex-actly one b-tag
1st 7th —
Centralityjet Sum of pT divided by sum of E for all
jets
2nd 1st 6th
H1 2nd Fox-Wolfram moment [71] 3rd 2nd —
mmin ∆R
jj Invariant mass of the combination of the
two jets with the smallest ∆R
4th 6th —
max mmin ∆R
`b Larger of the invariant masses of the two
(lepton, b-tagged jet) pairs, which are built based on the minimum ∆R(`, b) for each lepton
5th 5th —
pjet3T Third-jet pT 6th — —
pjet4T Fourth-jet pT — 3rd —
∆Rjjave Average ∆R for all jet pairs 7th — —
N|mjj−mV|<30
jet Number of jet pairs with mass within a
30 GeV window around 85 GeV
— 4th 2nd
N40jet Number of jets with pT> 40 GeV — — 1st
mmax pT
bb Invariant mass of the combination of two
b-tagged jets with the largest vector sum pT
— — 3rd
∆R`1`2 ∆R between the two leptons — — 4th
mmax pT
bj Invariant mass of the combination of the
two jets with the largest vector sum pT;
one jet must be b-tagged
— — 5th
H1jet 2nd Fox-Wolfram moment built from
only jets
— — 7th
Table 3. Definitions and rankings of the variables considered in each of the regions where a NN is used in the opposite-sign dilepton channel.
JHEP11(2015)172
Events / bin 0 200 400 600 800 1000 1200 1400 1600 Data ttV norm W t t ttZ Top ZRare SM Total unc.
ATLAS -1 = 8 TeV, 20.3 fb s 2L-noZ-4j NN output -0.8 -0.6 -0.4 -0.2 0 0.2 0.4 0.6 0.8 Data / SM 0.5 0.75 1 1.25 1.5 0 (a) Events / bin 0 100 200 300 400 500 600 700 800 Data ttV norm W t t ttZ Top Z
Rare SM Total unc.
ATLAS -1 = 8 TeV, 20.3 fb s 2L-noZ-5j NN output -0.8 -0.6 -0.4 -0.2 0 0.2 0.4 0.6 Data / SM 0.5 0.75 1 1.25 1.5 0 (b) Events / bin 0 20 40 60 80 100 120 140 160 Data ttV norm W t t ttZ Top Z
Rare SM Total unc.
ATLAS -1 = 8 TeV, 20.3 fb s 2L-Z-5j NN output -0.8 -0.6 -0.4 -0.2 0 0.2 0.4 0.6 0.8 Data / SM 0.5 0.75 1 1.25 1.5 0 (c)
Figure 2. The NN output distributions for the three signal regions in the opposite-sign dilepton channel, before the fit to data. The distributions are shown in the (a) 2`-noZ-4j, (b) 2`-noZ-5j and (c) 2`-Z-5j regions. The orange dashed lines show the t¯tV signal normalised to the background yield. “Rare SM” comprises the diboson, single-top, tZ, W tZ, t¯tH processes and the fake lepton background. The hatched area corresponds to the total uncertainty on the predicted yields. The “Data/SM” plots show the ratio of the data to the total Standard Model expectation.
Events / bin 0 10000 20000 30000 40000 50000 60000 Data ttW Z t t Top Z Rare SM Total unc. ATLAS -1 = 8 TeV, 20.3 fb s 2L-noZ-3j Normalisation 0 1 Data / SM 0.5 0.75 1 1.25 1.5 0 (a) Events / bin 0 200 400 600 800 1000 Data ttW Z t t Top Z Rare SM Total unc. ATLAS -1 = 8 TeV, 20.3 fb s 2L-Z-3j [GeV] had T H 100 200 300 400 500 600 700 Data / SM 0.5 0.75 1 1.25 1.5 0 (b) Events / bin 0 50 100 150 200 250 300 Data ttW Z t t Top Z Rare SM Total unc. ATLAS -1 = 8 TeV, 20.3 fb s 2L-Z-4j [GeV] had T H 100 200 300 400 500 600 700 Data / SM 0.5 0.75 1 1.25 1.5 0 (c)
Figure 3. Control region distributions in the opposite-sign dilepton channel, before the fit to data. The distributions are shown in the (a) 2`-noZ-3j, (b) 2`-Z-3j and (c) 2`-Z-4j regions. For the 2`-noZ-3j region only the event count is used in the fit. The hatched area corresponds to the total uncertainty on the predicted yields. “Rare SM” comprises the diboson, single-top, tZ, W tZ, t¯tH processes and the fake lepton background. The “Data/SM” plots show the ratio of the data to the total expected Standard Model expectation.
Signal events from the t¯tW process are produced when the associated W boson decays leptonically and the t¯t system decays in the `+jets channel.
A smaller contribution from t¯tZ comes from a leptonic decay of the Z boson where one lepton is not reconstructed, together with a leptonic decay of one of the two W bosons coming from the top quark decays.
JHEP11(2015)172
Region t + X Bosons Fake leptons Total expected t¯tW t¯tZ Data
charge misID background
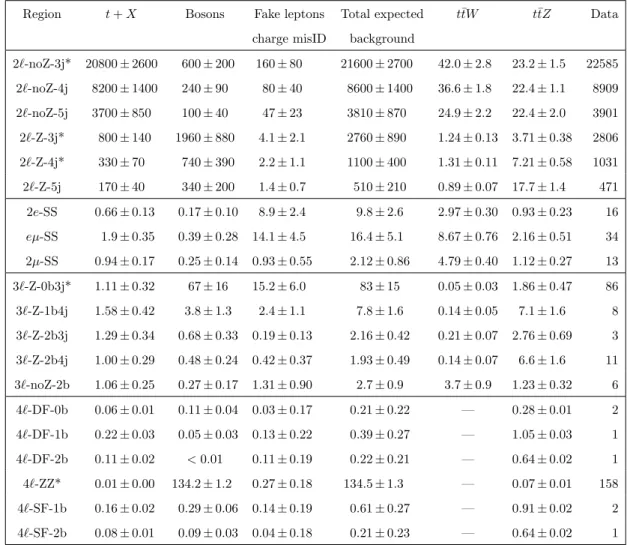
2`-noZ-3j* 20800 ± 2600 600 ± 200 160 ± 80 21600 ± 2700 42.0 ± 2.8 23.2 ± 1.5 22585 2`-noZ-4j 8200 ± 1400 240 ± 90 80 ± 40 8600 ± 1400 36.6 ± 1.8 22.4 ± 1.1 8909 2`-noZ-5j 3700 ± 850 100 ± 40 47 ± 23 3810 ± 870 24.9 ± 2.2 22.4 ± 2.0 3901 2`-Z-3j* 800 ± 140 1960 ± 880 4.1 ± 2.1 2760 ± 890 1.24 ± 0.13 3.71 ± 0.38 2806 2`-Z-4j* 330 ± 70 740 ± 390 2.2 ± 1.1 1100 ± 400 1.31 ± 0.11 7.21 ± 0.58 1031 2`-Z-5j 170 ± 40 340 ± 200 1.4 ± 0.7 510 ± 210 0.89 ± 0.07 17.7 ± 1.4 471 2e-SS 0.66 ± 0.13 0.17 ± 0.10 8.9 ± 2.4 9.8 ± 2.6 2.97 ± 0.30 0.93 ± 0.23 16 eµ-SS 1.9 ± 0.35 0.39 ± 0.28 14.1 ± 4.5 16.4 ± 5.1 8.67 ± 0.76 2.16 ± 0.51 34 2µ-SS 0.94 ± 0.17 0.25 ± 0.14 0.93 ± 0.55 2.12 ± 0.86 4.79 ± 0.40 1.12 ± 0.27 13 3`-Z-0b3j* 1.11 ± 0.32 67 ± 16 15.2 ± 6.0 83 ± 15 0.05 ± 0.03 1.86 ± 0.47 86 3`-Z-1b4j 1.58 ± 0.42 3.8 ± 1.3 2.4 ± 1.1 7.8 ± 1.6 0.14 ± 0.05 7.1 ± 1.6 8 3`-Z-2b3j 1.29 ± 0.34 0.68 ± 0.33 0.19 ± 0.13 2.16 ± 0.42 0.21 ± 0.07 2.76 ± 0.69 3 3`-Z-2b4j 1.00 ± 0.29 0.48 ± 0.24 0.42 ± 0.37 1.93 ± 0.49 0.14 ± 0.07 6.6 ± 1.6 11 3`-noZ-2b 1.06 ± 0.25 0.27 ± 0.17 1.31 ± 0.90 2.7 ± 0.9 3.7 ± 0.9 1.23 ± 0.32 6 4`-DF-0b 0.06 ± 0.01 0.11 ± 0.04 0.03 ± 0.17 0.21 ± 0.22 — 0.28 ± 0.01 2 4`-DF-1b 0.22 ± 0.03 0.05 ± 0.03 0.13 ± 0.22 0.39 ± 0.27 — 1.05 ± 0.03 1 4`-DF-2b 0.11 ± 0.02 < 0.01 0.11 ± 0.19 0.22 ± 0.21 — 0.64 ± 0.02 1 4`-ZZ* 0.01 ± 0.00 134.2 ± 1.2 0.27 ± 0.18 134.5 ± 1.3 — 0.07 ± 0.01 158 4`-SF-1b 0.16 ± 0.02 0.29 ± 0.06 0.14 ± 0.19 0.61 ± 0.27 — 0.91 ± 0.02 2 4`-SF-2b 0.08 ± 0.01 0.09 ± 0.03 0.04 ± 0.18 0.21 ± 0.23 — 0.64 ± 0.02 1
Table 4. Expected event yields for signal and backgrounds, and the observed data in all signal and control regions (marked with an asterisk) used in the fit to extract the t¯tW and t¯tZ cross sections. The quoted uncertainties on expected event yields represent systematic uncertainties including MC statistical uncertainties. The t¯t, single-top, tZ, W tZ, t¯tH and t¯tt¯t processes are denoted t + X. The Z, W W , W Z, ZZ, t¯tW W and W±W± processes are denoted ‘Bosons’.
The main backgrounds vary depending on the lepton flavour: events containing a lepton with mis-identified charge are dominant in the 2e-SS region and prevalent in the eµ-SS region, whereas events with a fake lepton contribute significantly in all regions, but are dominant in the 2µ-SS region. Backgrounds from the production of prompt leptons with correctly identified charge come primarily from W Z production, but these are small compared to the instrumental backgrounds.
Processes featuring an opposite-sign lepton pair, like t¯t and Z boson production, can enter this channel through the misidentification of the electron charge. Charge misiden-tification rates, parameterised in pT and |η| of the electrons, are measured in a control
region containing events with two electrons with 75 < mee < 105 GeV, which is divided
into same-sign and opposite-sign subregions with non-Z → ee backgrounds subtracted. A likelihood function is constructed relating the number of observed events in the two
subre-JHEP11(2015)172
Missing transverse momentum [GeV]
0 20 40 60 80 100 120 140 Events / 10 GeV 0 10 20 30 40 50 60 70 80 90 Data W t t Z t t Charge misID Fake leptons Rare SM Total unc. ATLAS -1 = 8 TeV, 20.3 fb s 2e-SS-CR (a)
Missing transverse momentum [GeV]
0 20 40 60 80 100 120 140 Events / 10 GeV 0 5 10 15 20 25 Data W t t Z t t Charge misID Fake leptons Rare SM Total unc. ATLAS -1 = 8 TeV, 20.3 fb s -SS-CR µ e (b)
Missing transverse momentum [GeV]
0 20 40 60 80 100 120 140 Events / 10 GeV 0 1 2 3 4 5 6 7 8 Data W t t Z t t Fake leptons Rare SM Total unc. ATLAS -1 = 8 TeV, 20.3 fb s -SS-CR µ 2 (c)
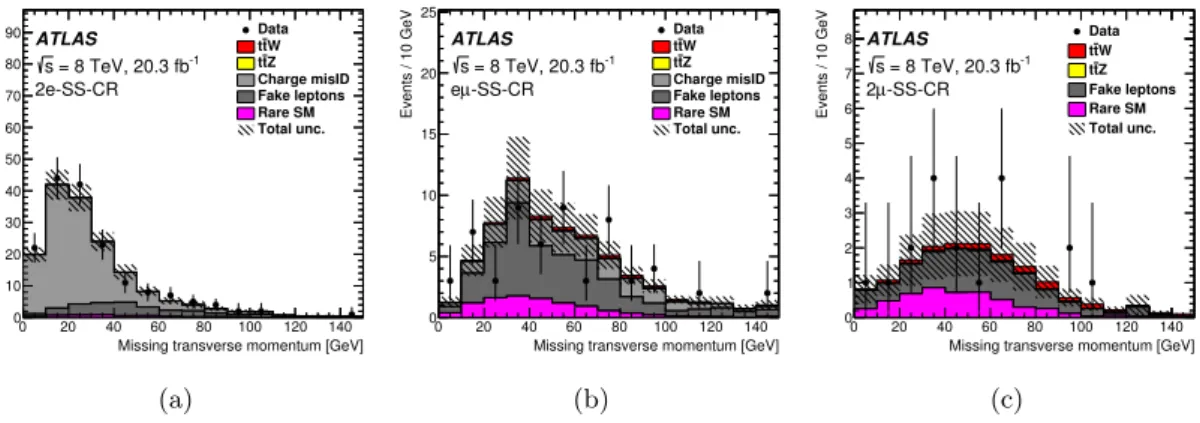
Figure 4. Distributions of Emiss
T for events in a same-sign dilepton control region with HT <
240 GeV and at least one b-tagged jet for the different lepton flavour combinations, (a) ee, (b) eµ and (c) µµ. “Rare SM” contains small background contributions mainly consisting of the W W and W Z processes. The predictions are shown before fitting to data in the control region. The instrumental backgrounds, including fake leptons and leptons with misidentified charge are predicted using data-driven methods. The hatched area corresponds to the total uncertainty on the predicted yields. The last bin in each histogram includes the overflow.
gions with the probability for an electron falling in a given (pT, |η|) bin to be reconstructed
with the wrong charge, and maximised to obtain the charge misidentification rates. A template is then constructed using opposite-sign data with event selection identical to that used in the signal region except for the requirement on the charge of the leptons. A weight given by
w = ε1+ ε2− 2ε1ε2 1 − (ε1+ ε2− 2ε1ε2)
(5.1) is applied to each event and used to construct the template, where the charge misidentifi-cation rates for the two leptons are ε1,2. These are set to zero in the case of muons.
To estimate the background from fake leptons in the same-sign dilepton channel a set of scale factors are measured. The scale factors are defined as f = NT/NL, the ratio of the
number of observed tight leptons, i.e. leptons satisfying all selection criteria, to the number of loose leptons. Loose leptons differ from tight leptons in that they are required to fail isolation requirements; loose muons additionally have relaxed selection criteria, requiring |z0| < 2 mm with no requirement on d0. The scale factors are measured in a control region
(2`-SS-CR) containing two same-sign leptons (vetoing events with a third lepton, as is done in the signal region), at least one b-tagged jet, and HT < 240 GeV. The missing transverse
momentum distributions in this control region are shown in figure 4. A template for fake lepton backgrounds is constructed in the control region from the loose lepton sample, using the expression Nfake= X NLT f1+ X NTL f2− X NLL f1f2 data − X NLT f1+ X NTL f2− X NLL f1f2 MC,prompt , (5.2)
where NTL is the number of events in which the first lepton is a tight lepton and the second
JHEP11(2015)172
2 ≥ jets > 40 GeV, n miss T E Events 0 5 10 15 20 25 30 35 Data W t t Z t t Charge misID Fake leptons Rare SM Total unc. ATLAS -1 = 8 TeV, 20.3 fb s 2e-SS (a) [2,3] ∈ jets n miss T Low-E 4 ≥ jets n miss T Low-E [2,3] ∈ jets n miss T High-E 4 ≥ jets n miss T High-E Events 0 5 10 15 20 25 Data W t t Z t t Charge misID Fake leptons Rare SM Total unc. ATLAS -1 = 8 TeV, 20.3 fb s -SS µ e (b) [2,3] ∈ jets n miss T Low-E 4 ≥ jets n miss T Low-E [2,3] ∈ jets n miss T High-E 4 ≥ jets n miss T High-E Events 0 2 4 6 8 10 12 Data W t t Z t t Fake leptons Rare SM Total unc. ATLAS -1 = 8 TeV, 20.3 fb s -SS µ 2 (c)Figure 5. Event yields in the same-sign dilepton signal regions according to the binning used in the final likelihood fit in the (a) 2e-SS (b) eµ-SS and (c) 2µ-SS regions. The distributions are shown before the fit. The bins labelled “Low-Emiss
T ” correspond to E miss
T ∈ (40, 80) GeV, and those labelled
“High-Emiss
T ” correspond to ETmiss≥ 80 GeV. “Rare SM” contains small background contributions
mainly consisting of the t¯tH and W Z processes. Instrumental backgrounds, including fake leptons and leptons with misidentified charge are predicted using data-driven methods. The hatched area corresponds to the total uncertainty on the predicted yields.
first and second leptons. A subtracted term, shown in the brackets labelled “MC, prompt” is included to remove contamination from prompt lepton production in the loose lepton sample. This subtraction accounts for about 2–3% of the total estimate. The background template for fake leptons is fitted to data in the control region in bins of lepton pT to
obtain the scale factors fi, which are measured separately for electrons and muons and
also binned in lepton pT. With the measured scale factors, the background templates are
produced in the signal region according to eq. (5.2).
Potential overlap between the estimates of charge misidentification and fake leptons is taken into account with an additional subtraction step. A background template for fake leptons is produced for opposite-sign events (using a selection and binning otherwise the same as the signal region), and the charge misidentification rates are applied to this template to obtain a representation of the overlap of these two backgrounds. This new template is then subtracted from the total estimate of the fake lepton background. This subtraction represents about 2–5% of the total yield.
To improve the separation of the t¯tW signal from backgrounds, events in the eµ-SS and 2µ-SS regions are further divided into four bins based on jet multiplicity and missing transverse momentum. Events are classified as low-Njets (Njets = 2 or 3) or high-Njets
(Njets ≥ 4) and low-EmissT (40 < ETmiss < 80 GeV) or high-ETmiss (ETmiss ≥ 80 GeV).
No further event classification is used in the 2e-SS region. The expected and observed contributions in each of the three dilepton flavour regions are summarised in table 4 and plotted in figure 5.
5.3 Trilepton channel
In the trilepton channel two preselections are considered, referred to as 3`-Z and 3`-noZ. The 3`-Z region targets the t¯tZ process, while 3`-noZ aims at measuring the t¯tW process. In the region 3`-Z, at least one pair of leptons is required to have the opposite sign and
JHEP11(2015)172
same flavour (OSSF) and have an invariant mass within 10 GeV of the Z boson mass. Region 3`-noZ contains the remaining trilepton events with a requirement that the leptons must not all have the same sign.
The trilepton channel signal regions are determined as follows. First, the preselected samples are split into categories according to the jet multiplicity and the number of b-tagged jets. The categories with similar predicted signal-to-background ratio (S/B) and systematic uncertainties are grouped together. The final selection in each group is optimised for maximal expected significance, including both the statistical and systematic uncertainties, using requirements on Emiss
T and lepton pT. It is found that optimal significance is obtained
without a requirement on Emiss
T .
Four signal regions are defined as a result of the grouping and optimisation: 3`-Z-1b4j, 3`-Z-2b3j, 3`-Z-2b4j and 3`-noZ-2b. In the 3`-Z-1b4j region, at least four jets are required, exactly one of which is b-tagged. In the 3`-Z-2b3j region, exactly three jets with at least two b-tagged jets are required. In the 3`-Z-2b4j region at least four jets are required, of which at least two jets are b-tagged. In the 3`-noZ-2b region at least two and at most three jets are required, of which at least two jets are b-tagged. For events in which the third leading lepton is an electron, the minimum pT requirement on the third lepton is
raised to 20 GeV in the 3`-Z-1b4j, 3`-Z-2b3j and 3`-Z-2b4j regions, and to 25 GeV in the 3`-noZ-2b region.
The 3`-Z preselection is dominated by W Z events, with a significant contribution from events with fake leptons. To constrain the W Z background, a control region called 3`-Z-0b3j is defined and included in the fit. In this region, the presence of exactly three jets, with exactly zero b-tags, is required in addition to the requirements of the 3`-Z preselection. The normalisation correction for the W Z background with respect to the Standard Model expectations is obtained from the fit and found to be 0.98 ± 0.20. The quoted uncertainty includes both the statistical and systematic components. The modelling of W Z production in association with heavy-flavour jets is further validated in a control region 3`-Z-1b-CR, defined by requiring the presence of one to three jets, exactly one of which is b-tagged.
The fake lepton background is estimated by using the so-called matrix method [72], which makes use of an orthogonal control region in which lepton isolation and electron iden-tification criteria are relaxed. The efficiencies for real and fake leptons used in the matrix method are measured in events containing two leptons and one b-tagged jet. To validate the estimate of the background containing fake leptons, a control region 3`-noZ-1b-CR is defined by requiring exactly one jet to be b-tagged in addition to the requirements of the 3`-noZ region. Figure 6 shows distributions of Emiss
T and third-lepton pT in the
3`-noZ-1b-CR and 3`-Z-1b-CR regions, respectively. The level of agreement between data and expectation is good.
The signal and control regions of the trilepton channel used in the fit are summarised in table 5. The expected and observed yields in the signal and control regions are shown in table4. Event yields summarising the signal regions with different lepton flavour com-binations (3`-Z-SR) and the distribution of the minimum invariant mass of jet triplets (minimum mjjj) for events in the 3`-Z-2b4j region are shown in figure 7. Considering the
JHEP11(2015)172
[GeV] miss T E 0 20 40 60 80 100 120 140 160 Events / 20 GeV 0 5 10 15 20 25 30 35 40 3L-noZ-1b-CR ATLAS -1 = 8 TeV, 20.3 fb sData Total unc.
Z t t ttW ZZ WZ Top Rare SM tZ Fake leptons (a) [GeV] T p Third Lepton 20 25 30 35 40 45 50 55 60 65 70 Events / 5 GeV 0 5 10 15 20 25 30 35 3L-Z-1b-CR ATLAS -1 = 8 TeV, 20.3 fb s
Data Total unc.
Z t t ttW ZZ WZ Top Rare SM tZ Fake leptons (b)
Figure 6. Distributions of (a) Emiss
T in the 3`-noZ-1b region and (b) third-lepton pTin the 3`-Z-1b
region. “Rare SM” contains small background contributions consisting of the W W W , W W Z, H → ZZ and t¯tW W processes. The hatched area corresponds to the total uncertainty on the predicted yields. The distributions are shown before the fit. The last bin in each histogram includes the overflow.
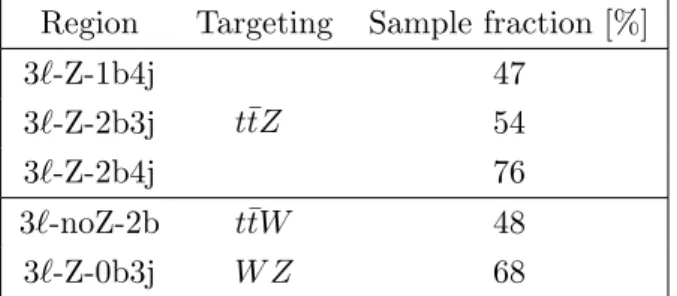
Region Targeting Sample fraction [%] 3`-Z-1b4j t¯tZ 47 3`-Z-2b3j 54 3`-Z-2b4j 76 3`-noZ-2b t¯tW 48 3`-Z-0b3j W Z 68
Table 5. Signal and control regions of the trilepton channel used in the fit, together with the processes targeted and the expected fraction of the sample represented by the targeted process.
is found to give a powerful estimate of the hadronically decaying top direction. Good agreement between data and expectation is observed.
5.4 Tetralepton channel
The tetralepton channel targets the t¯tZ process for the case where both W bosons resulting from top quark decays and the Z boson decay leptonically, and uses an event counting approach in five signal regions. Events with two pairs of opposite-sign leptons are selected, among which at least one pair is same flavour. The OSSF lepton pair with reconstructed invariant mass closest to mZis attributed to the Z boson decay and denoted in the following
as Z1. The two remaining leptons are used to define Z2. The signal regions are defined
according to the relative flavour of the two remaining leptons, different or same flavour, and the number of b-tagged jets: zero, one, or at least two (0b, 1b, 2b). The signal regions are thus 4`-DF-0b, 4`-DF-1b, 4`-DF-2b, 4`-SF-1b and 4`-SF-2b. The ZZ background mostly affects the SF regions and therefore events with a Z2 SF lepton pair and no b-tagged jets
JHEP11(2015)172
eee eµµ µee µµµ Events 0 2 4 6 8 10 12 14 16 3L-Z-SR ATLAS -1 = 8 TeV, 20.3 fb sData Total unc.
Z t t ttW ZZ WZ Top Rare SM tZ Fake leptons (a) [GeV] jjj m Minimum 50 100 150 200 250 300 350 400 Events / 50 GeV 0 2 4 6 8 10 3L-Z-2b4j ATLAS -1 = 8 TeV, 20.3 fb s
Data Total unc.
Z t t ttW ZZ WZ Top Rare SM tZ Fake leptons (b)
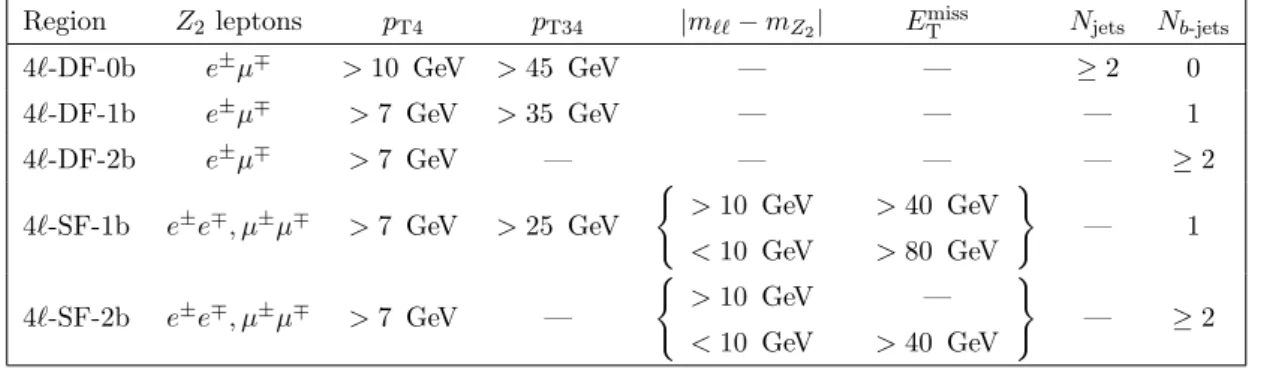
Figure 7. (a) Event yields in the trilepton channel summarising the signal regions with different lepton flavour combinations and (b) the minimum three-jet invariant mass for events in the 3`-Z-2b4j signal region. “Rare SM” contains small background contributions consisting of the W W W , W W Z, H → ZZ and t¯tW W processes. The distributions are shown before the fit. The hatched area corresponds to the total uncertainty on the predicted yields. The last bin in (b) includes the overflow. Region Z2 leptons pT4 pT34 |m``− mZ2| E miss T Njets Nb-jets 4`-DF-0b e±µ∓ > 10 GeV > 45 GeV — — ≥ 2 0 4`-DF-1b e±µ∓ > 7 GeV > 35 GeV — — — 1 4`-DF-2b e±µ∓ > 7 GeV — — — — ≥ 2 4`-SF-1b e±e∓, µ±µ∓ > 7 GeV > 25 GeV ( > 10 GeV < 10 GeV > 40 GeV > 80 GeV ) — 1 4`-SF-2b e±e∓, µ±µ∓ > 7 GeV — ( > 10 GeV < 10 GeV — > 40 GeV ) — ≥ 2
Table 6. Definitions of the five signal regions in the tetralepton channel.
Further requirements are applied in each signal region such that the expected statistical uncertainty on the measured t¯tZ signal cross section is minimised. Events in the 4`-SF-1b region are rejected if they are compatible with a ZZ event, i.e. if Emiss
T < 80 (40) GeV for
mZ2 inside (outside) a 10 GeV region centred at the Z boson mass. This requirement on
Emiss
T is relaxed by 40 GeV for the 4`-SF-2b region. The impact of events with fake leptons
decreases with the number of reconstructed b-tagged jets. To suppress these backgrounds, additional requirements on the scalar sum of the transverse momenta of the third and fourth leptons (pT34) are imposed in the lower b-tag multiplicity regions. In the 4`-SF-1b,
4`-DF-1b and 4`-DF-0b regions events are required to satisfy pT34 > 25 GeV, pT34 >
35 GeV and pT34 > 45 GeV, respectively. In the 4`-DF-0b region the requirement on the
fourth lepton is raised to pT> 10 GeV and at least two jets must be reconstructed in the
event. In all regions, the invariant mass of any two reconstructed OS leptons is required to be larger than 10 GeV. The definitions of the signal regions are summarised in table 6.
JHEP11(2015)172
Events 2 − 10 1 − 10 1 10 2 10 3 10 ATLAS 4L-ZZ -1 =8 TeV, 20.3 fb sData Total unc. Fake leptons ZZ Rare SM ttZ Number of jets 0 1 2 3 Data / SM 0 1 2 (a) Events 2 − 10 1 − 10 1 10 2 10 3 10 ATLAS 4L-ZZ -1 =8 TeV, 20.3 fb s
Data Total unc. Fake leptons ZZ Rare SM ttZ
Number of b-tagged jets
0 1 Data / SM 0 1 2 (b)
Figure 8. Distributions of (a) the number of jets and (b) the number of b-tagged jets in the ZZ control region of the tetralepton channel 4`-ZZ. The hatched area corresponds to the total uncertainty on the predicted yields. The distributions are shown before the fit. “Rare SM” contains small background contributions mainly consisting of the W tZ and t¯tH processes. The “Data/SM” plots show the ratio of the data events to the total Standard Model expectation.
The ZZ background is large in the tetralepton channel, and therefore a control region, 4`-ZZ, is defined to constrain the ZZ normalisation in the SF region, and is included in the fit. Both lepton pairs are required to satisfy |mZ1,2 − mZ| < 10 GeV, and events
are retained if Emiss
T < 50 GeV. The fitted normalisation correction with respect to the
Standard Model expectation is 1.16 ± 0.12. The quoted uncertainties include both the statistical and systematic components. The number of jets and b-tagged jets in the 4`-ZZ region are shown in figure 8. Data distributions agree with expectations from simulation.
The tetralepton channel backgrounds with at least one fake lepton are estimated using simulation, where the prediction is corrected with a constant factor to improve agreement in control regions with enhanced fraction of single fake leptons. By probing the fake muon and electron background in a Z+fake-lepton-candidate control region and in a t¯ t+fake-lepton-candidate region, two equations per lepton flavour f can be constructed and the correction factors cCR
f for these two processes can be determined: ct¯et= 1.23 ± 0.13, ct¯µt= 1.25 ± 0.09,
cZ
e = 1.35±0.05, and cZµ = 1.61±0.05. The quoted uncertainties include systematic effects.
The control regions are required to contain three leptons and are either Z- or t¯t-like. In the first case an OSSF lepton pair is required together with Emiss
T < 30 GeV. In addition,
the transverse mass of the non-Z1 lepton ` is required to satisfy mT < 35 GeV, where mT
is defined as
mT =
q 2p`
TETmiss− 2p`T· pmissT . (5.3)
The non-Z1 lepton is then used as the fake lepton candidate. In the second case an OS
JHEP11(2015)172
Number of jets 0 2 4 6 Events 0 1 2 3 4 5 6 7 Data Z t t ZZ Rare SM Fake leptons Total unc. ATLAS s= 8 TeV, 20.3 fb-1 4L-SR (a)Number of b-tagged jets
0 1 2 3 Events 0 1 2 3 4 5 6 7 Data Z t t ZZ Rare SM Fake leptons Total unc. ATLAS s= 8 TeV, 20.3 fb-1 4L-SR (b) [GeV] Z1 m 60 80 100 120 Events / 5 GeV 0 1 2 3 4 5 6 7 Data Z t t ZZ Rare SM Fake leptons Total unc. ATLAS s= 8 TeV, 20.3 fb-1 4L-SR (c) [GeV] Z2 m 0 50 100 150 200 250 300 Events / 30 GeV 0 1 2 3 4 5 6 7 Data Z t t ZZ Rare SM Fake leptons Total unc. ATLAS s= 8 TeV, 20.3 fb-1 4L-SR (d)
Figure 9. Distributions of (a) number of jets, (b) number of b-tagged jets, invariant mass of the (c) Z1 and (d) Z2 dilepton pair for the tetralepton signal region selection. The distributions are
shown before the fit. The distributions of the seven observed events are compared to expectation. The hatched area corresponds to the total uncertainty on the predicted yields. “Rare SM” contains small background contributions mainly consisting of the W tZ and t¯tH processes.
an OSSF lepton pair are rejected. The lowest-pT same-sign lepton is then used as the
candidate. The background from events with two fake leptons is evaluated from simulation with relaxed requirements and extrapolated in several steps into the signal region. The total background yield and its uncertainty are dominated by the estimate extracted from simulation of trilepton events with only one additional fake lepton.
The expected sample composition of the six tetralepton regions is summarised in table4 along with the number of events observed in data. Seven events are observed in the five signal regions (4L-SR). Figure 9 shows good agreement between data and expectation for the distributions of the number of jets, number of b-tagged jets, as well as the invariant masses of the two pairs of leptons.
6 Systematic uncertainties
Several sources of systematic uncertainty are considered that can affect the normalisation of signal and background in each channel and/or the shape of the discriminant distributions in the opposite-sign dilepton channel.
JHEP11(2015)172
The luminosity estimate has an uncertainty of 2.8%, determined using beam-separation scans [73]. This systematic uncertainty is assigned to all background contributions obtained from MC simulation.
6.1 Uncertainties on reconstructed objects
Uncertainties associated with the lepton selection arise from the imperfect knowledge of the trigger, reconstruction, identification and isolation efficiencies, and lepton momentum scale and resolution. The uncertainty on the electron identification efficiency is the largest systematic uncertainty in the trilepton channel and among the most important ones in the tetralepton channel.
Uncertainties associated with the jet selection arise from the jet energy scale (JES), JVF requirement, jet energy resolution (JER) and jet reconstruction efficiency. The JES and its uncertainty are derived combining information from test-beam data, collision data and simulation [64]. JES uncertainty components arising from the in-situ calibration and the jet flavour composition are among the dominant uncertainties in the opposite-sign dilepton, same-sign dilepton and trilepton channels. The uncertainties in the JER and JVF have a significant effect at low jet pT. The JER uncertainty is the second largest
uncertainty in the trilepton channel while the JVF uncertainty is not negligible in the opposite-sign dilepton, trilepton and tetralepton channels.
The efficiency of the flavour tagging algorithm is measured for each jet flavour using control samples in data and in simulation. From these measurements, correction factors are defined to correct the tagging rates in the simulation. In the case of b-jets, correction factors and their uncertainties are estimated based on observed and simulated b-tagging rates in t¯t dilepton events [66]. In the case of c-jets, they are derived based on jets with identified D∗ mesons [74]. In both cases the correction factors are parameterised as a function of jet pT. In the case of light-flavour jets, correction factors are derived using dijet events,
and are parameterised as a function of jet pT and η [74]. Sources of uncertainty affecting
the b- and c-tagging efficiencies are considered as a function of jet pT, including bin-to-bin
correlations [66]. An additional uncertainty is assigned to account for the extrapolation of the b-tagging efficiency measurement from the pT region used to determine the scale
factors to regions with higher pT. For the light-jet tagging efficiency the dependence of the
uncertainty on the jet pT and η is considered. These systematic uncertainties are taken as
uncorrelated between b-jets, c-jets, and light-flavour jets.
The treatment of the uncertainties on reconstructed objects is common to all four channels, and thus these are considered as correlated among different regions.
6.2 Uncertainties on signal modelling
To assess the factorisation and renormalisation scale uncertainties on t¯tV modelling, the scales are varied up and down by a factor of two in a correlated manner. Radiation uncertainties are assessed by simultaneously varying the scale of the momentum transfer Q in the running strong coupling αS(Q2) in the matrix-element calculation and in the Pythia
JHEP11(2015)172
In addition, the jet pT matching threshold and the amount of radiation in the parton
shower are independently varied up and down by a factor of two. The dominant systematic uncertainty comes from the variation of Q in αS(Q2) in the matrix element calculation and
in the Pythia parton shower. This variation has a significant effect on the distribution of the number of jets in t¯tV events.
Systematic uncertainties due to the choice of PDF are evaluated using the uncertainty sets of the CT10 NLO, MSTW2008 68% confidence level (CL) NLO and NNPDF 2.3 NLO [76] PDFs following the PDF4LHC recommendations [77].
The uncertainties on the t¯tV modelling are among the dominant ones in the tetralepton channel but they have a negligible impact in all other channels. Signal modelling and PDF uncertainties are treated as correlated among channels.
6.3 Uncertainties on background modelling
Uncertainties on the background modelling differ significantly among the channels due to large differences in the background composition.
Z boson background: this dominates in the 2`-Z regions of the opposite-sign dilepton channel. Four sources of uncertainty are considered: those associated with the cross section, the Z boson pT correction, the scale choice for parton emission, and the choice of generator,
evaluated by comparing the nominal Alpgen sample to a Sherpa sample generated using Sherpa 1.4.1 with up to three additional partons in the LO matrix element and the CT10 PDF set.
t¯t background: this dominates in the 2`-noZ regions of the opposite-sign dilepton chan-nel. A number of systematic uncertainties affecting the modelling of the t¯t process are considered in this channel: those due to the uncertainty on the cross section which amount to +5%/−6%, due to the choice of parton shower and hadronisation model (evaluated by comparing events produced by Powheg interfaced with Pythia or Herwig [78]), due to the choice of generator (evaluated by comparing a sample generated using Madgraph interfaced with Pythia to the default t¯t sample), and due to the reweighting procedure applied to correct the t¯t MC modelling. An additional 50% normalisation uncertainty is assigned to t¯t + heavy-flavour jets production to account for limited knowledge of this pro-cess.
Single-top background: this is small and affects only the opposite-sign dilepton chan-nel. An uncertainty of 6.8% is assigned to the cross section for single-top production [42], corresponding to the theoretical uncertainty on W t production, the only process contribut-ing to this final state. An additional contribution arises from the comparison of predictions using different schemes to account for interference between W t and t¯t.
Diboson background: in the trilepton and same-sign dilepton channels the diboson background is dominated by W Z production, while in the tetralepton channel ZZ pro-duction is dominant. In the opposite-sign dilepton channel the diboson background in-cludes W W , W Z and ZZ production and the uncertainties are assigned to the sum of these processes.
JHEP11(2015)172
In the trilepton and same-sign dilepton channels, the normalisation of the W Z back-ground is treated as a floating parameter in the fit used to extract the t¯tV signal. The uncertainty on the extrapolation of the W Z background estimate from the control region to signal regions with specific jet and b-tag multiplicities is evaluated by comparing the nominal Sherpa sample to the prediction of Powheg, as well as by using variations of the simulation parameters. The uncertainty amounts to 20–35%.
In the tetralepton, trilepton and same-sign dilepton channels the normalisation of the ZZ background is treated as a floating parameter in the fit used to extract the t¯tV signal. In the tetralepton channel, several uncertainties on the ZZ background estimate are considered. They arise from the extrapolation from the 4`-ZZ control region (corresponding to on-shell ZZ production) to the signal region (with off-shell ZZ background) and from the extrapolation from the control region without jets to the signal region with at least one jet. Using data-driven techniques, these uncertainties are found to be 30% and 20%, respectively. An additional uncertainty of 10–30% is assigned to the normalisation of the heavy-flavour content of the ZZ background based on a data-to-simulation comparison of events with one Z boson and additional jets, and cross-checked with a comparison between different ZZ simulations.
In the opposite-sign dilepton channel, in which the diboson background is small, a 20% uncertainty is assigned to the W Z and ZZ background normalisation. This is estimated from the level of agreement between data and prediction in the 3`-Z-0b3j control region. t¯tH background: an uncertainty of 12% is assigned to the t¯tH production cross sec-tion [48] in all channels. Additional uncertainties that affect t¯tH kinematics are assigned in the opposite-sign dilepton channel and are negligible for the other channels. These uncer-tainties come from the choice of factorisation and renormalisation scales, and the functional form of the scale in t¯tH samples.
tZ and W tZ background: in the opposite-sign dilepton and trilepton channels, tZ and W tZ backgrounds are summed and an uncertainty of 20% is assigned to their cross section. An additional uncertainty on the shape of this background is considered in the trilepton channel for which this background is important. The shape uncertainty is evaluated by varying the factorisation and renormalisation scales and αS in simulation up and down by
a factor of two with respect to the nominal value, in a correlated manner. The αS variation
has the largest effect, ranging from 10% to 20% depending on the number of jets and b-jets. The W tZ background is important in the tetralepton channel. An uncertainty of 10% is assigned to the cross section, coming from the variation of renormalisation and factorisation scales. An additional uncertainty arises from the modelling of the additional jet in W tZ events. It is evaluated by varying parameters in simulation as described above. Other prompt lepton backgrounds: uncertainties of 20% are assigned to the normal-isations of the W H and ZH processes, based on calculations from ref. [79]. An uncertainty of 100% is considered for triboson and same-sign W W processes.
Misidentified lepton charge background: this affects mainly the 2e-SS and eµ-SS regions. Uncertainties on it arise from a variety of statistical and systematic effects. The
JHEP11(2015)172
main uncertainty comes from the limited statistical precision in the measurement of charge misidentification rates. These are treated as correlated among all pT and |η| bins, but
un-correlated between the 2e-SS and eµ-SS regions. This approach is comparable to treating each binned rate measurement as uncorrelated. Additional systematic uncertainties arise from the background subtraction in the Z → ee sample used to measure charge misidenti-fication rates and from the difference in charge misidentimisidenti-fication rates between Z → ee and t¯t events. The latter are evaluated by measuring charge misidentification rates in Z → ee MC events, assigning them to t¯t simulated events and comparing the prediction to the number of true charge-misidentified events in the t¯t sample. This uncertainty is found to be 10%.
Fake lepton background: this is important in the same-sign dilepton, trilepton, and tetralepton channels. The uncertainty on this background is estimated by propagating the statistical uncertainty on the measurement of the fake lepton efficiencies. Additionally, the normalisation of backgrounds in the control regions (from prompt leptons or charge-misidentified electrons) is varied to estimate a systematic uncertainty on these efficiencies. The variation assigned (20–25%) depends on the composition of each control region, and is chosen to conservatively cover the largest uncertainty on the backgrounds. In the trilepton channel an additional uncertainty is considered by measuring the rates of real and fake leptons in two orthogonal regions, one with three or more jets and the other with one or two jets. In the same-sign dilepton channel, statistical uncertainties are dominant and no further systematic uncertainties are considered. All uncertainties associated with fake leptons are considered to be uncorrelated among analysis channels and regions.
In the opposite-sign dilepton channel the fake lepton background is small compared to the other background contributions. An uncertainty of 50% is assigned to the fake lepton yield across all regions in this channel to cover the maximum difference between yields obtained from the simulation and from same-sign dilepton events in data. An additional uncertainty is assigned to cover the difference in shape of the distribution of the scalar sum of the transverse momenta of all reconstructed jets and charged leptons in the simulated and same-sign data events.
7 Results
The observed yields in the 15 signal and 5 control regions are shown together with the expected numbers of events in table 4.
The production cross sections σt¯tW and σt¯tZ are determined simultaneously using a
binned maximum-likelihood fit over all regions and discriminant bins considered in the analysis. The fit is based on the profile likelihood technique, in which the systematic uncer-tainties are treated as nuisance parameters with prior unceruncer-tainties that can be constrained by the fit. The calculation of confidence intervals and hypothesis testing is performed us-ing a modified frequentist method as implemented in RooStats [80, 81]. Significance is calculated using the asymptotic formula of ref. [82].
A summary of the fit to all four channels with their corresponding fit regions used to measure the t¯tW and t¯tZ production cross sections is shown in figure 10. The
normali-JHEP11(2015)172
3j 1-2b noZ 3j 2b Z 4j 2b Z ZZ 3j 0b Z 4j 1-2b noZ 5j+ 1-2b noZ 5j+ 2b Z Events / channel 1 10 2 10 3 10 4 10 5 10 6 10CR
2LOS
ATLAS -1 = 8 TeV, 20.3 fb sData Total unc. Top Charge misID VV Fake leptons Rare SM ttZ Z ttW 2b+ ee 2b+ µ e 2b+ µ µ 0 10 20 30 40 50
2LSS
4j+ 1b Z 3j 2b+ Z 4j+ 2b+ Z 2-3j 2b+ noZ 0 2 4 6 8 10 12 14 16 18 203L
0b DF 1b DF 2b+ DF 1b SF 2b+ SF 0 1 2 3 4 54L
Figure 10. Expected yields after the fit compared to data in the five control regions (CR), used to constrain the t¯t, Z, ZZ and W Z backgrounds, the three signal regions in the opposite-sign dilepton channel (2LOS), the three signal regions in the same-sign dilepton channel (2LSS), the four signal regions in the trilepton channel (3L) and the five signal regions in the tetralepton channel (4L). In the two dilepton channels the fit also includes shape information. The “Rare SM” background summarises all other backgrounds described in section3and mainly consists of the t¯tH, tZ and W tZ processes, which are the largest contributions to this background category in the dilepton, trilepton and tetralepton channels, respectively. The hatched area corresponds to the total uncertainty on the predicted yields.
sations of the W Z and ZZ processes are determined as well, as described in sections 5.3 and 5.4.
Table7provides a breakdown of the total uncertainties on the measured t¯tW and t¯tZ cross sections, determined by fitting each signal individually with the other fixed to its expected SM value. For both processes, the precision of the measurement is dominated by statistical uncertainties. For the t¯tW fit, the dominant systematic uncertainty source is the modelling of fake leptons and background processes with misidentified charge. For the t¯tZ fit, the dominant systematic uncertainty source is the modelling of backgrounds from simulation.
The sensitivity to the t¯tW process is dominated by the same-sign dilepton channel, while the t¯tZ process is mainly measured in the trilepton and tetralepton channels. The result of the simultaneous fit of the t¯tW and t¯tZ processes using all four channels is summarised in table 8. The observed (expected) significance of the measurements are 5.0σ (3.2σ) for the t¯tW process and 4.2σ (4.5σ) for the t¯tZ process. The background-only hypothesis with neither t¯tZ nor t¯tW production is excluded at 7.1σ (5.9σ).
The result of the combined simultaneous fit to the two parameters of interest is σt¯tW = 369+86−79(stat.) ± 44 (syst.) fb = 369+100−91 fb (7.1)
and
σt¯tZ = 176+52−48(stat.) ± 24 (syst.) fb = 176+58−52fb. (7.2)
Figure 11 provides a comparison of these measurements with NLO QCD theoretical cal-culations using Madgraph5 aMC@NLO.