INSTITUTIONAL FOUNDATIONS OF ECONOMIC GROWTH
IN THE UK
İngiltere’de Ekonomik Büyümenin Kurumsal Temelleri
Can VERBERİ1
1 Arş. Gör., Şırnak Üniversitesi İktisadi ve İdari Bilimler Fakültesi, İktisat Bölümü, [email protected], ORCID: 0000-0003-4876-8564
İktisadi ve İdari Yaklaşımlar Dergisi 2020, Cilt 2, Sayı 1, s. 60-72. Araştırma Makalesi e-ISSN 2687-6159 Administrative Approaches 2020, Vol. 2, No. 1, pp. 60-72. Research Article
Verberi, C. (2020). “Instıtutıonal Foundatıons Of Economıc Growth In The Uk”. İktisadi ve İdari Yaklaşımlar Dergisi, 2 (1), s. 60-72.
ABSTRACT
In recent years, economies that focused on long-term stable growth rates have made institutions an important variable to be examined because institutions are key determinants of long-term growth. The first view is that the institutional structure is essential for growth, while the second view is that economic development paves the way for institutional development. This study investigates the relationship between institutions and growth in the UK by employing the Johansen Cointegration Test, Vector Error Correction Model (VECM) and the VAR Granger Causality Test. According to the analysis results, property rights, legal constraints on executive and democracy affect positively GDP in the long run. VECM estimation results show that there is a long-run causality between property rights, legal constraints on executive, democracy and GDP. In addition, there is causality from GDP to property rights and legal constraints on executive, and there is a bilateral causality from democracy to GDP. Based on the causality relationship between GDP and property rights and legal constraints on executive, the second view is valid for the UK. Interpreted the results for causality way between democracy and GDP, it is shown that both views are valid for the UK.
Keywords: Growth, Institutions, Democracy ÖZET
Son yıllarda, uzun vadeli istikrarlı büyüme oranlarına odaklanan ekonomiler, kurumları uzun vadeli büyümenin kilit belirleyicisi olduğu için incelenecek önemli bir değişken haline getirmiştir. Kurumlar ve büyüme arasındaki ilişki hakkında iki yaygın görüş vardır. İlk görüş kurumsal yapının büyüme için gerekli olduğu, ikinci görüş ise ekonomik kalkınmanın kurumsal gelişmenin yolunu açtığı yönündedir. Bu çalışma, Johansen Eşbütünleşme Testi, Vektör Hata Düzeltme Modeli (VECM) ve VAR Granger Nedensellik Testini kullanarak İngiltere’de kurumlar ve büyüme arasındaki ilişkiyi araştırmaktadır. Analiz sonuçlarına göre, mülkiyet hakları, yürütme üzerindeki yasal kısıtlamalar ve demokrasi uzun vadede GSYİH’i olumlu etkilemektedir. VECM tahmin sonuçları mülkiyet hakları, yürütme üzerindeki yasal kısıtlamalar, demokrasi ve GSYİH arasında uzun vadeli bir nedensellik olduğunu göstermektedir.
INSTITUTIONAL FOUNDATIONS OF ECONOMIC GROWTH
IN THE UK
İngiltere’de Ekonomik Büyümenin Kurumsal Temelleri
Can VERBERİ1
1 Arş. Gör., Şırnak Üniversitesi İktisadi ve İdari Bilimler Fakültesi, İktisat Bölümü, [email protected], ORCID: 0000-0003-4876-8564
İktisadi ve İdari Yaklaşımlar Dergisi 2020, Cilt 2, Sayı 1, s. 60-72.
Araştırma Makalesi e-ISSN 2687-6159
Journal of Economic and Administrative Approaches 2020, Vol. 2, No. 1, pp. 60-72.
Research Article
Verberi, C. (2020). “Instıtutıonal Foundatıons Of Economıc Growth In The Uk”. İktisadi ve İdari Yaklaşımlar Dergisi, 2 (1), s. 60-72.
ABSTRACT
In recent years, economies that focused on long-term stable growth rates have made institutions an important variable to be examined because institutions are key determinants of long-term growth. The first view is that the institutional structure is essential for growth, while the second view is that economic development paves the way for institutional development. This study investigates the relationship between institutions and growth in the UK by employing the Johansen Cointegration Test, Vector Error Correction Model (VECM) and the VAR Granger Causality Test. According to the analysis results, property rights, legal constraints on executive and democracy affect positively GDP in the long run. VECM estimation results show that there is a long-run causality between property rights, legal constraints on executive, democracy and GDP. In addition, there is causality from GDP to property rights and legal constraints on executive, and there is a bilateral causality from democracy to GDP. Based on the causality relationship between GDP and property rights and legal constraints on executive, the second view is valid for the UK. Interpreted the results for causality way between democracy and GDP, it is shown that both views are valid for the UK.
Keywords: Growth, Institutions, Democracy ÖZET
Son yıllarda, uzun vadeli istikrarlı büyüme oranlarına odaklanan ekonomiler, kurumları uzun vadeli büyümenin kilit belirleyicisi olduğu için incelenecek önemli bir değişken haline getirmiştir. Kurumlar ve büyüme arasındaki ilişki hakkında iki yaygın görüş vardır. İlk görüş kurumsal yapının büyüme için gerekli olduğu, ikinci görüş ise ekonomik kalkınmanın kurumsal gelişmenin yolunu açtığı yönündedir. Bu çalışma, Johansen Eşbütünleşme Testi, Vektör Hata Düzeltme Modeli (VECM) ve VAR Granger Nedensellik Testini kullanarak İngiltere’de kurumlar ve büyüme arasındaki ilişkiyi araştırmaktadır. Analiz sonuçlarına göre, mülkiyet hakları, yürütme üzerindeki yasal kısıtlamalar ve demokrasi uzun vadede GSYİH’i olumlu etkilemektedir. VECM tahmin sonuçları mülkiyet hakları, yürütme üzerindeki yasal kısıtlamalar, demokrasi ve GSYİH arasında uzun vadeli bir nedensellik olduğunu göstermektedir.
Ayrıca, GSYİH’den mülkiyet haklarına ve yürütme üzerindeki yasal kısıtlamalara doğru nedensellik vardır ve demokrasiden GSYİH’e doğru çift yönlü nedensellik vardır. GSYİH ile mülkiyet hakları ve yürütme üzerindeki yasal kısıtlamalar arasındaki nedensellik ilişkisi baz alındığında, ikinci görüş İngiltere için geçerlidir. Demokrasi ve GSYİH arasındaki nedensellik yönü ile ilgili sonuçlar yorumlandığında, her iki görüşün de İngiltere için geçerli olduğu görülmüştür.
Anahtar Kelimeler:Büyüme, Kurumlar, Demokrasi
1. INTRODUCTION
Institutions and individuals interact and this interaction shapes economic activities. In recent years, the theoretical debates on sustainable growth have gained weight, and the relationship between institutions, which are components of long-term growth, has become an important issue under discussion. In the historical process, some countries have successfully managed their economic growth and development processes, while others have not managed them successfully or their economic indicators have deteriorated. Institutions are important explanatory factors in this context. “Institutions are the rules of the game in a society or, more formally, are the humanly devised constraints that shape human interaction” (Acemoglu et al. 2004: 1).
There are two different approaches to the relationship between institutions and growth (Glaeser et al., 2004: 271). The first approach argues that growth requires institutional arrangements that protect democracy and property rights at the beginning. Thus, human and physical capital investments will ensure growth in an environment of political institutions. The second approach advocates that the growth process starts with the accumulation of human and physical capital. According to this approach, even dictators can protect property rights. Then, institutional development has been achieved as a result of the development of wealth and education.
Institutions have various effects on growth rates. Firstly, when individual behaviors do not lead to the most effective economic outcomes, institutions limit the preferences of individuals and ensure effective economic outcomes. Secondly, institutions increase the economic activities of groups and individuals by reducing uncertainty in daily economic transactions. Thirdly, institutions affect growth rates by determining transaction and input costs. Finally, institutions affect the real sector of the economy by determining resource allocation and hence they affect production and growth rates (Tavares, 2004: 50). This paper aims at investigating the relationship between institutions and growth in the UK. While analyzing the effects of institutions on growth, it expects to contribute to the literature as well. Most of the studies on the relationship between institutions and growth were dealth with many countries by using panel data analysis. The number of studies investigating only one country by using time series analysis is limited. The paper tries to fill this gap in the literature by using time series analysis for one country. In the study, the UK is analyzed because it is the country where the Industrial Revolution began and institutional development completed earlier than other advanced economies. The effects of institutions on growth are tested by Johansen Cointegration Test, VECM and VAR Granger Causality Test. In this context, the effects of variables such as legal structure and security of property rights and democracy on growth are examined.
2. INSTITUTIONAL DEVELOPMENT OF UK: A BRIEF HISTORY
Although institutional development UK dates back to the centuries, the developments that shape the institutional structure of today’s UK started to exist in the 17th century, one century before the industrial revolution. The acts that make up the institutional foundations of today’s UK could be summarized as estate acts, statutory authorities’ acts and enclosure acts, which cover from 17th to 18th centuries. The contribution of these acts to the institutional development of UK is that the changes in property rights and provision of public goods would be the most important factors affecting the economy.
Estate actions have provided changes in the rights of individuals and families. The land retention system prevented landowners from using and transferring properties that they deemed to be appropriate (Bogart and Richardson, 2006: 1). Heritage conditions, such as tight settlement, often tied the hands of landowners. The restrictions required landowners to allocate property to specific tasks and to allocate revenues to specific beneficiaries, such as charities and extended families. Estate actions have removed restrictions on the uses of the property; land reclamation, sale and rental; thereby shifting the land to higher valuable uses (Bogart and Richardson, 2006: 2). Statutory authorities’ acts have created new organizations that build, operate, and maintain infrastructure. Statutory authorities’ acts also provided public services. Statutory authorities’ acts have offered new rights, including user fees, tax duty, lending, issuing shares and purchase of land (Bogart and Richardson, 2006: 2). The new rights changed the traditional regulations and encouraged infrastructure investments and provision of public services. Enclosure acts are laws covering property rights in agricultural lands. The lands used in common have been allocated by Enclosure acts (Bogart and Richardson, 2006: 2). Thus, individuals acquired the rights to be able to carry out individual agricultural activities on some of these lands while giving up their property rights on other agricultural lands.
To sum up, institutional arrangements began earlier in UK than in other countries. Therefore, the UK has completed the development process in its basic institutional structures long ago.
3. LITERATURE REVIEW
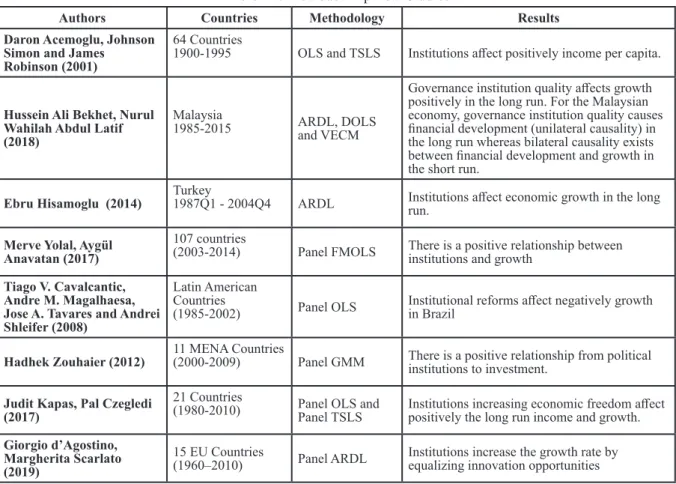
Several studies examine the relationship between growth rates and institutions. In general, the majority of them focus on many countries by using panel data analysis. Therefore, it is difficult to explain the relationship between institutions and growth on the basis of one country. In addition, they don’t usually classify the countries according to the development levels. In contrast to them, this study examines the UK as a developed country by employing time series analysis. Table 1 summarizes the details of these empirical studies on the impact of institutional structure on growth.
Acemoglu, Johnson and Robinson (2001) investigated the effects of institutions on income per capita for 64 countries from 1900 to 1995. The findings showed that institutions affect positively per capita income. Bekhet and Abdul Latif (2018) analyzed the impact of institutions on growth in Malaysia between 1985 and 2015. The results showed that governance institution quality affects growth positively in the long run. For the Malaysian economy, governance institution quality causes financial development (unilateral causality) in the long run whereas bilateral causality exists between financial development and growth in the short run.
2. INSTITUTIONAL DEVELOPMENT OF UK: A BRIEF HISTORY
Although institutional development UK dates back to the centuries, the developments that shape the institutional structure of today’s UK started to exist in the 17th century, one century before the industrial revolution. The acts that make up the institutional foundations of today’s UK could be summarized as estate acts, statutory authorities’ acts and enclosure acts, which cover from 17th to 18th centuries. The contribution of these acts to the institutional development of UK is that the changes in property rights and provision of public goods would be the most important factors affecting the economy.
Estate actions have provided changes in the rights of individuals and families. The land retention system prevented landowners from using and transferring properties that they deemed to be appropriate (Bogart and Richardson, 2006: 1). Heritage conditions, such as tight settlement, often tied the hands of landowners. The restrictions required landowners to allocate property to specific tasks and to allocate revenues to specific beneficiaries, such as charities and extended families. Estate actions have removed restrictions on the uses of the property; land reclamation, sale and rental; thereby shifting the land to higher valuable uses (Bogart and Richardson, 2006: 2). Statutory authorities’ acts have created new organizations that build, operate, and maintain infrastructure. Statutory authorities’ acts also provided public services. Statutory authorities’ acts have offered new rights, including user fees, tax duty, lending, issuing shares and purchase of land (Bogart and Richardson, 2006: 2). The new rights changed the traditional regulations and encouraged infrastructure investments and provision of public services. Enclosure acts are laws covering property rights in agricultural lands. The lands used in common have been allocated by Enclosure acts (Bogart and Richardson, 2006: 2). Thus, individuals acquired the rights to be able to carry out individual agricultural activities on some of these lands while giving up their property rights on other agricultural lands.
To sum up, institutional arrangements began earlier in UK than in other countries. Therefore, the UK has completed the development process in its basic institutional structures long ago.
3. LITERATURE REVIEW
Several studies examine the relationship between growth rates and institutions. In general, the majority of them focus on many countries by using panel data analysis. Therefore, it is difficult to explain the relationship between institutions and growth on the basis of one country. In addition, they don’t usually classify the countries according to the development levels. In contrast to them, this study examines the UK as a developed country by employing time series analysis. Table 1 summarizes the details of these empirical studies on the impact of institutional structure on growth.
Acemoglu, Johnson and Robinson (2001) investigated the effects of institutions on income per capita for 64 countries from 1900 to 1995. The findings showed that institutions affect positively per capita income. Bekhet and Abdul Latif (2018) analyzed the impact of institutions on growth in Malaysia between 1985 and 2015. The results showed that governance institution quality affects growth positively in the long run. For the Malaysian economy, governance institution quality causes financial development (unilateral causality) in the long run whereas bilateral causality exists between financial development and growth in the short run.
Hisamoglu (2014) examined the relationship between institutions and growth in Turkey. Empirical results indicate that institutions affect economic growth in the long run. Yolal and Anavatan (2017) analyzed the relationship between institutions and growth for 107 countries. The findings show that there is a positive relationship between institutions and growth.
Cavalcantic et al. (2008) reached results that the effects of institutional reforms on growth in Brazil. The results indicate that institutional reforms affect negatively growth in Brazil. Zouhaier (2012) analyzed 11 MENA countries. Empirical findings show that there is a positive relationship from political institutions to investment.
Kapas and Czegledi (2017) investigated 21 countries. The results demonstrate that the institutions increasing economic freedom affect positively the long run income and growth. D’Agostino and Margherita Scarlato (2019) examined 15 EU countries. Results indicate that institutions increase the growth rate by equalizing innovation opportunities.
Panel data methods are mostly used for analyzing the effects of institutional structure on growth. Cointegration methods are used because the studies using time series analysis are based on them.
Table - 1: Previous Empirical Studies
Authors Countries Methodology Results
Daron Acemoglu, Johnson Simon and James Robinson (2001)
64 Countries
1900-1995 OLS and TSLS Institutions affect positively income per capita.
Hussein Ali Bekhet, Nurul Wahilah Abdul Latif (2018)
Malaysia
1985-2015 ARDL, DOLS and VECM
Governance institution quality affects growth positively in the long run. For the Malaysian economy, governance institution quality causes financial development (unilateral causality) in the long run whereas bilateral causality exists between financial development and growth in the short run.
Ebru Hisamoglu (2014) Turkey1987Q1 - 2004Q4 ARDL Institutions affect economic growth in the long run. Merve Yolal, Aygül
Anavatan (2017)
107 countries
(2003-2014) Panel FMOLS There is a positive relationship between institutions and growth Tiago V. Cavalcantic,
Andre M. Magalhaesa, Jose A. Tavares and Andrei Shleifer (2008)
Latin American Countries
(1985-2002) Panel OLS Institutional reforms affect negatively growth in Brazil Hadhek Zouhaier (2012) 11 MENA Countries (2000-2009) Panel GMM There is a positive relationship from political institutions to investment. Judit Kapas, Pal Czegledi
(2017)
21 Countries
(1980-2010) Panel OLS and Panel TSLS Institutions increasing economic freedom affect positively the long run income and growth. Giorgio d’Agostino,
Margherita Scarlato (2019)
15 EU Countries
4. DATASET, VARIABLES AND EMPIRICAL MODELS
In this study, the GDP variable is obtained from the World Bank dataset. The legal structure and security of property rights index that are components of the Historical Index of Economic Liberty (HIEL) obtained from Espacio Investiga dataset, which is used institutional variables. Liberal democracy, participatory democracy, deliberative democracy and Egalitarian Democracy Indexes are obtained from V-Dem datasets. Yearly datasets between 1964 and 2007 are operated as an observation interval for the model. The model used in this study is as follows:
Model: gdpt= propt + fpcdemog t + vt
gdp: Real GDP (Constant 2010 Trillion US$), prop: Legal Structure and Security of Property Rights Index,
fpcdemog: First Principle Component of Electoral Democracy, Liberal Democracy, Participatory Democracy, Deliberative Democracy and Egalitarian Democracy Indexes
vt: Error Term
Table - 2: Previous Empirical Studies Results of Ng-Perron Unit Root Test for gdp
Variables Measurement Data Sources
gdp Real GDP (Constant 2010 Trillion US$) World Bank prop Legal Structure And Security of Property Rights Index Espacio Investiga (HIEL) fpcdemog First principle component of Electoral democracy, liberal democracy, Participatory democracy and
egalitarian democracy indexes
Own calculation (Dimension of fpcdemog dataset are obtained from V-Dem dataset)
In the model, legal structure and security of property rights index, which represents property rights and legal constraints on the executive, is the variable for measuring institutional developments. The first principle component of electoral democracy, liberal democracy, participatory democracy, deliberative democracy and egalitarian democracy indexes, which measure democracy, is used as the control variable (see Table 2 for details).
5. EMPIRICAL RESULTS
The empirical results of the models are given and explained below. Similar studies mostly used panel data method which examines more than one country. In section 2, only two studies examined a single country by using cointegration method in the time series analysis. Therefore, Johansen Cointegration Test is used by employing time series because UK is the only examined country. In addition, VECM and VAR Granger Causality test are applied for determining the direction of causality among the variables. Long term relationships of time series in regression analysis could not be tested because of taking the difference. However, long term relationships in time series can be analyzed by applying cointegration method. Johansen Cointegration Test is used in the empirical analysis because all series are integrated in the order of 1. The econometric theory argues that there must be a causality relationship when variables are cointegrated. So, causality analysis needs to determine the impact of direction.
5.1 Ng-Perron Unit Root Test
Ng-Perron unit root tests are new unit root tests developed as M-tests to correct size distortion in the volume of the error term, especially in Phillips-Perron (PP) tests (Göktaş, 2008: 53). These tests consist of four different types: the MZα and MZt tests, the modified version of the Phillips-Perron Zα and Zt tests, the MSB test, the modified (modified) version of the Bhargava test, and the MPT test, the modified (modified) version of the ADF-GLS unit root test. The basic hypothesis in unit root tests called Ng-Perron MZα and MZt is the presence of unit root, whereas in MSB and MPT unit root tests the basic hypothesis is the absence of unit root (Göktaş, 2008: 54). Accordingly, if the calculated MZα and MZt test statistics are smaller than the critical values calculated, the basic hypothesis expressing the existence of the unit root cannot be rejected, whereas if the calculated MSB and MPT test statistics are smaller than these critical values, the basis of the absence of unit root the hypothesis cannot be rejected.
Table - 3: Results of Ng-Perron Unit Root Test for gdp
Variable: gdp (Constant
MZa MZt MSB MPT
Ng-Perron Test Statistics 2.08978 1.53566 0.73484 48.7832
Asymptotic Critical Values
1% -13.8000 -2.58000 0.17400 1.78000 5% -8.10000 -1.98000 0.23300 3.17000 10% -5.70000 -1.62000 0.27500 4.45000 Significance Level (%) >10% >10% >10% >10% Variable: d(gdp) (Constant) MZa MZt MSB MPT
Ng-Perron Test Statistics -16.2662 -2.80132 0.17222 1.69395
1% -13.8000 -2.58000 0.17400 1.78000
5% -8.10000 -1.98000 0.23300 3.17000
10% -5.70000 -1.62000 0.27500 4.45000
Significance Level (%) 1% 1% 1% 1%
Variable: gdp (Constant and Linear Trend)
MZa MZt MSB MPT
Ng-Perron Test Statistics -4.37688 -1.19071 0,27204 18.4878
Asymptotic Critical Values
1% -23.8000 -3.42000 0.14300 4.03000
5% -17.3000 -2.91000 0.16800 5.48000
10% -14.2000 -2.62000 0.18500 6.67000
Significance Level (%) >10% >10% >10% >10%
Variable: d(gdp) (Constant and Linear Trend)
MZa MZt MSB MPT
Ng-Perron Test Statistics -19.9948 -3.16167 0.15812 4.55867
1% -23.8000 -3.42000 0.14300 4.03000
5% -17.3000 -2.91000 0.16800 5.48000
10% -14.2000 -2.62000 0.18500 6.67000
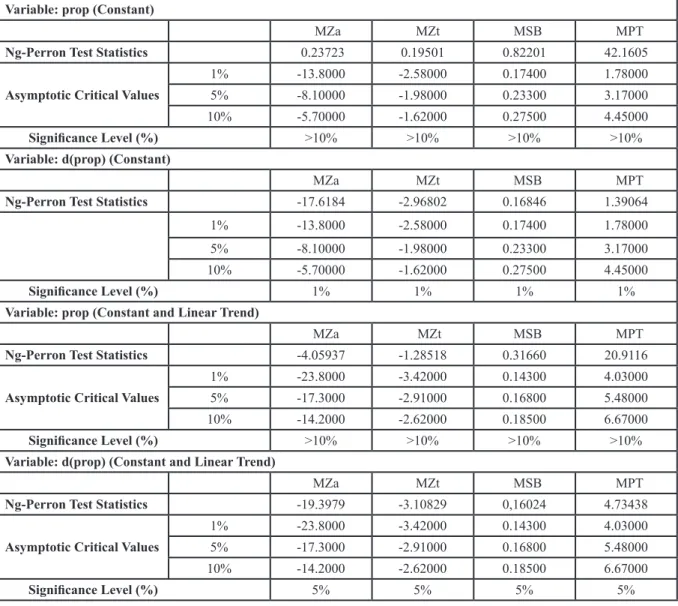
Table - 4: Results of Ng-Perron Unit Root Test for prop
Variable: prop (Constant)
MZa MZt MSB MPT
Ng-Perron Test Statistics 0.23723 0.19501 0.82201 42.1605
Asymptotic Critical Values
1% -13.8000 -2.58000 0.17400 1.78000
5% -8.10000 -1.98000 0.23300 3.17000
10% -5.70000 -1.62000 0.27500 4.45000
Significance Level (%) >10% >10% >10% >10%
Variable: d(prop) (Constant)
MZa MZt MSB MPT
Ng-Perron Test Statistics -17.6184 -2.96802 0.16846 1.39064
1% -13.8000 -2.58000 0.17400 1.78000
5% -8.10000 -1.98000 0.23300 3.17000
10% -5.70000 -1.62000 0.27500 4.45000
Significance Level (%) 1% 1% 1% 1%
Variable: prop (Constant and Linear Trend)
MZa MZt MSB MPT
Ng-Perron Test Statistics -4.05937 -1.28518 0.31660 20.9116
Asymptotic Critical Values
1% -23.8000 -3.42000 0.14300 4.03000
5% -17.3000 -2.91000 0.16800 5.48000
10% -14.2000 -2.62000 0.18500 6.67000
Significance Level (%) >10% >10% >10% >10%
Variable: d(prop) (Constant and Linear Trend)
MZa MZt MSB MPT
Ng-Perron Test Statistics -19.3979 -3.10829 0,16024 4.73438
Asymptotic Critical Values
1% -23.8000 -3.42000 0.14300 4.03000
5% -17.3000 -2.91000 0.16800 5.48000
10% -14.2000 -2.62000 0.18500 6.67000
Significance Level (%) 5% 5% 5% 5%
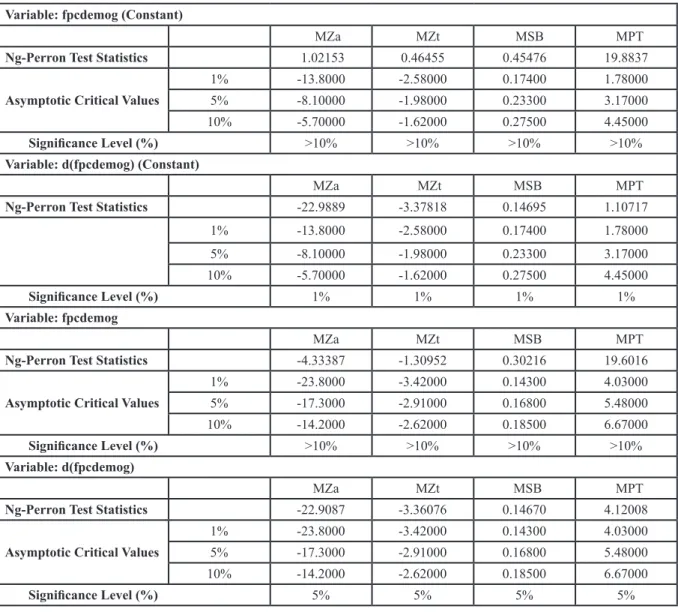
Table - 5: Results of Ng-Perron Unit Root Test for fpcdemog
Variable: fpcdemog (Constant)
MZa MZt MSB MPT
Ng-Perron Test Statistics 1.02153 0.46455 0.45476 19.8837
Asymptotic Critical Values
1% -13.8000 -2.58000 0.17400 1.78000
5% -8.10000 -1.98000 0.23300 3.17000
10% -5.70000 -1.62000 0.27500 4.45000
Significance Level (%) >10% >10% >10% >10%
Variable: d(fpcdemog) (Constant)
MZa MZt MSB MPT
Ng-Perron Test Statistics -22.9889 -3.37818 0.14695 1.10717
1% -13.8000 -2.58000 0.17400 1.78000 5% -8.10000 -1.98000 0.23300 3.17000 10% -5.70000 -1.62000 0.27500 4.45000 Significance Level (%) 1% 1% 1% 1% Variable: fpcdemog MZa MZt MSB MPT
Ng-Perron Test Statistics -4.33387 -1.30952 0.30216 19.6016
Asymptotic Critical Values
1% -23.8000 -3.42000 0.14300 4.03000 5% -17.3000 -2.91000 0.16800 5.48000 10% -14.2000 -2.62000 0.18500 6.67000 Significance Level (%) >10% >10% >10% >10% Variable: d(fpcdemog) MZa MZt MSB MPT
Ng-Perron Test Statistics -22.9087 -3.36076 0.14670 4.12008
Asymptotic Critical Values
1% -23.8000 -3.42000 0.14300 4.03000
5% -17.3000 -2.91000 0.16800 5.48000
10% -14.2000 -2.62000 0.18500 6.67000
Significance Level (%) 5% 5% 5% 5%
When Tables 3 - 5 are examined, Ng-Perron unit root test results show that all series are not stationary at a 5% significance level. However, when the first differences of the series are taken, all series become stationary at a 5% significance level. The series is suitable for Johansen Cointegration test since all series are integrated in the order of 1.
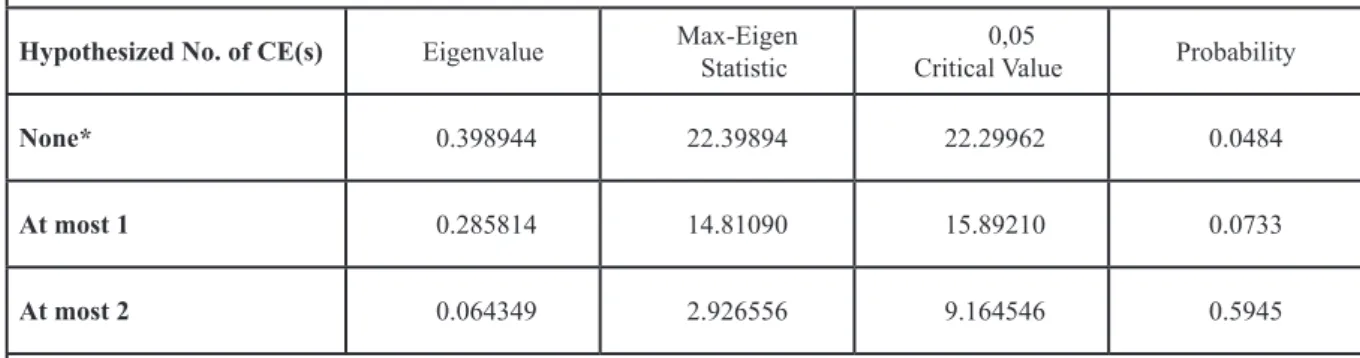
5.2 Johansen Cointegration Test
According to the cointegration test, if the two variables Xt and Yt which are not stationary in I (0) are stationary at any point I (d), the linear combination can be stationary (Ari and Yildiz, 2017: 312). One of the methods used to determine whether to be a long-term relationship between variables is Johansen Cointegration Test.
Table - 6: Johansen Cointegration Test Results
Unrestricted Cointegration Rank Test (Trace)
Hypothesized No. of CE(s) Eigenvalue Trace Statistic Critical Value 0,05 Probability
None* 0.398944 40.13640 35.19275 0.0135
At most 1 0.285814 17.73746 20.26184 0.1073
At most 2 0.064349 2.926556 9.164546 0.5945
Trace test indicates 1 cointegrating eqn(s) at the 0,05 level
Unrestricted Cointegration Rank Test (Maximum Eigenvalue)
Hypothesized No. of CE(s) Eigenvalue Max-Eigen Statistic Critical Value 0,05 Probability
None* 0.398944 22.39894 22.29962 0.0484
At most 1 0.285814 14.81090 15.89210 0.0733
At most 2 0.064349 2.926556 9.164546 0.5945
Max-eigenvalue test indicates 1 cointegrating eqn(s) at the 0,05 level
Table - 7: Long Run Normalized Coefficients
Dependent Variable: gdp
Variable Coefficient Standard Error t-statistic
fpcdemog 0.144175 0.01828 7.88745***
Prop 0.694733 0.08267 8.40377***
constant -4.833096 0.76497 -6.31804***
***,**, * are significance levels at 1, 5, 10%.
Table 6 shows Johansen cointegration test results. Trace and max. eigenvalue tests found 1 cointegrated vector at a 5% significance level for the model. Thus, long-term relationships are found between the variables. Long run normalized coefficients are shown in Table 7. All long run normalized coefficients are statistically significant at the 5% level. In the Model, there is a positive relationship between prop and gdp, and fpdemog and gdp in the long term. As a result, in the long run, property rights, legislative constraints on executive and democracy have a positive impact on GDP.
5.3 Vector Error Correction Model (VECM)
In the case of existing cointegrated relationship among variables, Vector Error Correction Model analysis has to be applied. The model is run by using all variables as dependent variables and adding error correction term (ECM) to them to estimate at the appropriate lag (Ari and Yildiz: 313). The error correction term is between 0 and -1, and it is statistically significant. This indicates that there is a long-term causality exists between the variables and that the Wald test results are significant, which shows short run causality.
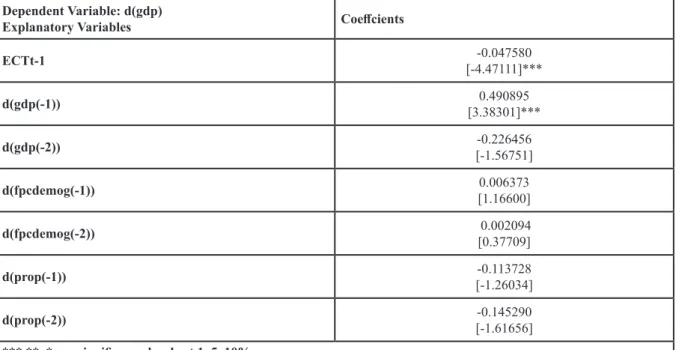
Table - 8: Vector Error Correction Model Estimation Results
Dependent Variable: d(gdp)
Explanatory Variables Coeffcients
ECTt-1 [-4.47111]***-0.047580 d(gdp(-1)) [3.38301]***0.490895 d(gdp(-2)) [-1.56751]-0.226456 d(fpcdemog(-1)) [1.16600]0.006373 d(fpcdemog(-2)) 0.002094[0.37709] d(prop(-1)) [-1.26034]-0.113728 d(prop(-2)) [-1.61656] -0.145290
***,**, * are significance levels at 1, 5, 10%.
In Table 8, ECTt-1 represents the error correction term. The error correction term is between -1 and 0, and it is statistically significant (at 1% level). The coefficient of error correction term indicates that in the short term, one unit deviation in GDP will be corrected by 4.75% each year. The fact that the error correction term is as expected shows that the error correction mechanism works.
5.4 VAR Granger Causality
Theoretically, there should be at least one directional causality between the cointegrated series. Statistically, causality is the estimated future value of a time series variable, which is obtained by influencing the past values of itself or another related time series variable. Causality in the sense of Granger is expressed in the form of an X variable, another Y variable, the information in both X and Y, while Y is the reason in Granger’s sense if the variable Y is estimated only by using the historical values of X. In other words, if the knowledge of the historical values of the variable X makes it possible to predict Y more precisely, the variable X is the cause for the variable Y in terms of Granger (Takim, 2010: 12).
Table - 8: Vector Error Correction Model Estimation Results Dependent Variable: d(gdp) Prob. Dependent Variable: d(fpcdemog) Prob. Dependent Variable: d(prop) Prob. d(fpcdemog) 0.0554* d(gdp) 0.0861* d(gdp) 0.0306**
d(prop) 0.1093 d(prop) 0.9358 d(fpcdemog) 0.1334
***,**, * are significance levels at 1, 5, 10%.
From Table 9, it is seen that gdp causes prop, and there is a bilateral causality between fpcdemog and gdp. As a result, GDP causes property rights and legal constraints on executive, while there is a bilateral causality between democracy and GDP.
6. CONCLUSIONS
Institutions influence economic activities through interaction with individuals and by this way, they influence the economies. In recent years, economies that focused on long-term stable growth rates have made institutions an important variable to be examined because institutions are key determinants of long-term growth. There are two common views on the relationship between institutions and growth. The first view argues that democracy and property rights must at first be protected in order to achieve economic growth. The second view suggests that the growth starts with the accumulation of human and physical capital and that the increased wealth and education levels cause institutional development. In this study, the relationship between institutions and growth in the context of UK is empirically analyzed by using Johansen Cointegration Test and VAR Granger Causality Test. Johansen Cointegration Test analysis results show that property rights, legislative constraints on executive and democracy have a positive impact on GDP in the long run. When the VECM model results are examined, it is seen that there is a long run relationship among property rights, legislative constraints on executive and democracy and GDP. VAR Granger Causality Test shows that GDP is a cause of the property rights and legislative constraints on executive, and there is a bilateral causality between GDP and democracy. VAR Granger Causality Test results confirm the second view on the relationship between institutions and growth in terms of the relationship between property rights and legislative constraints on executive and GDP for the UK. However, the study confirms both of the two views on the relationship between democracy and GDP.
As a result, institutions had a positive impact on long-term stable growth in the UK. In order to maintain a sustainable economic development, institutional structures in the UK need to have efficient institutional structures for achieving effective economic results. Otherwise, the long run growth rates will be adversely affected as the institutional structure does not function effectively.
REFERENCES
Acemoglu, D.; Simon, J. and Robinson, J. (2001). “The Colonial Origins of Comparative Development: An Empirical Investigation”. The American Economic Review, (Online) http://www.jstor.org/ stable/2677930, 24 January 2020
Acemoglu, D.; Simon, J. and Robinson, J. (2004). “Institutions as The Fundamental Cause of Long-Run Growth”. Nber Working Paper Series, (Online) http://www.nber.org/papers/w10481, 29 October 2019 Ari, E. and Yildiz, A. (2017). “Eşbütünleşme Analizi İle Genç İşsizliği Etkileyen Değişkenlerin Araştirilmasi”. Alphanumeric Journal, (Online) https://dergipark.org.tr/tr/download/article-file/379603, 16 December 2019
Bekhet, H. A. and Abdul Latif, N. W. (2018). “The Impact of Technological Innovation and Governance Institution Quality on Malaysia’s Sustainable Growth: Evidence From A Dynamic Relationship”.
Technology in Society, (Online) https://www.sciencedirect.com/science/article/pii/S0160791X17302750,
8 October 2019
Bogart, D. and Richardson, G. (2006). “Parliament, Property Rights, and Public Goods in England: 1600 to 1815”, (Online) www.socsci.uci.edu/~dbogart/parliament.pdf, 18 April 2020
Cavalcantic, T. V.; Magalhaesa, A. M.; Tavares, J. A. and Shleifer, A. (2004). “Do Institutions Cause Growth?”. Journal of Economic Growth, (Online) https://scholar.harvard.edu/files/shleifer/files/do_ institutions_cause_growth.pdf, 8 October 2019
D’Agostino, G. and Scarlato, M. (2018). “Knowledge Externalities, Innovation and Growth in European Countries: The Role of Institutions”. Economics of Innovation and New Technology, (Online) https:// www.tandfonline.com/doi/full/10.1080/10438599.2018.1429536, 8 October 2019
Espacio Investiga, https://espacioinvestiga.org
Göktaş, Ö. (2008). “Türkiye Ekonomisinde Bütçe Açiğinin Sürdürülebilirliğinin Analizi”. İstanbul
Üniversitesi İktisat Fakültesi Ekonometri ve İstatistik Dergisi, No:8, pp. 45-64
Glaeser, E. L.; La Porta, R.; Lopez-de-Silanes, F. and Shleifer, A. (2004). “Do Institutions Cause Growth?”. Journal of Economic Growth, Volume: 9, pp. 271-303.
Hisamoglu, E. (2014). “EU Membership, Institutions and Growth: The case of Turkey”. Economic
Modelling, (Online) https://www.sciencedirect.com/science/article/pii/S026499931300552X, 8 October
2019
Kapas, J. and Czegledi, P. (2017). “Institutions and Policies of Economic Freedom: Different Effects on Income and Growth”. Econ Polit, (Online) https://link.springer.com/article/10.1007/s40888-017-0063-5, 8 October 2019
Takim, A. (2010). “Türkiye’de GSYİH ile İhracat Arasindaki İlişki: Granger Nedensellik Testi”. Atatürk
Üniversitesi Sosyal Bilimler Enstitüsü Dergisi, (Online) https://www.acarindex.com/dosyalar/makale/
acarindex-1423871594.pdf , 16 December 2019
Portuguese Economic Journal, (Online) https://link.springer.com/article/10.1007/s10258-004-0029-8,
8 October 2019
V-Dem, https://www.v-dem.net/en/ World Bank, https://data.worldbank.org
Yolal, M. and Anavatan, A. (2017). “Ülkelerarası Büyüme Farklılıklarını Açıklanmasında Kurumların Önemi: Panel Veri Analizi”. Finans Politik & Ekonomik Yorumlar, Volume: 54, No: 632, pp. 39-53 Zouhaier, H. (2012). “Institutions, Investment and Economic Growth”. International Journal of