FOREIGN DEMAND DRIVEN GROWTH IN THE FIRST QUARTER
Zümrüt İmamoğlu* ve Barış Soybilgen**
Executive Summary
In March, seasonally adjusted Industrial Production Index (IPI) declined by 0.4 percent from the previous month. Export volume index increased by 1.4 percent, whereas the import volume index decreased by 1.5 percent. Indicators show that private consumption and investment declined in the first quarter. The increase in exports though continues to support growth. However, the IPI has been declining for two months, consecutively. Therefore, we revised our growth forecast down slightly. We expect the quarter on quarter (QoQ) growth to be 0.4 percent. The corresponding year on year (YoY) forecast for the first quarter is 3.7 percent.
On the other hand, the current account deficit continues to fall. 12-month rolling current account deficit fell by $2.5 billion in March, and ended up the first quarter at $59.9 billion. We expect the current account deficit to GDP ratio to fall to 7.5 percent at the end of the first quarter and the gold-excluded current account deficit to be 6.4 percent.
* Dr. Zümrüt İmamoğlu, Betam, Research Associate. [email protected]
†Barış Soybilgen, Betam, Research Assistant,
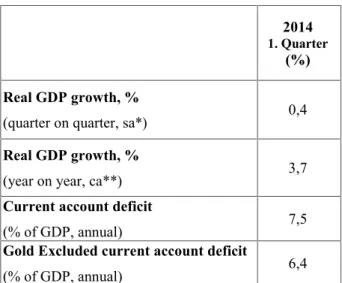
Table 1.Betam's quarterly and annual growth rate forecasts
Source: Betam.*sa: seasonally and calendar day adjusted **ca: calendar day adjusted.
Downward trend in the IPI
The IPI fell by 0.4 percent in March from the previous month. After data revisions, it is seen that the IPI also fell in February by 0.3 percent. On the other hand, QoQ industrial production is still strong. It increased by 1.4 percent in the first quarter from the previous quarter. However, ongoing monthly declines since January imply that exports decelerated along with the domestic demand. Deceleration in exports has also manifested itself in export numbers. Gold-excluded exports declined slightly both in February and March. We expect the domestic
2014
1. Quarter
(%) Real GDP growth, %
(quarter on quarter, sa*) 0,4
Real GDP growth, %
(year on year, ca**) 3,7
Current account deficit
(% of GDP, annual) 7,5
Gold Excluded current account deficit
(% of GDP, annual) 6,4
Economic Outlook and Forecasts:
May 2014
demand, which shows signs of recovery, to offset the fall in exports in the second quarter.
On the other hand, the decline in imports continues. Even though the bulk of the decline is caused by the fall in gold imports, gold-excluded imports declined as well. Consumer and intermediate goods imports decreased sharply both on monthly and quarterly terms. Investment goods imports recovered slightly in March, but fell QoQ. The decrease in imports in the last three months indicate a clear contraction in domestic demand. Other economic indicators for consumption and investment also indicate a decline. Compared to the last quarter of 2013, consumer and real sector confidence indices fell sharply in the first quarter. Capacity utilization rate also declined by 1.1 percentage points in the same period. Furthermore, BIST, in real terms, have fallen in the last two quarters.
Indicators for the first quarter show that the growth was mainly export-led. Even though domestic demand contracted, we believe that net exports were strong enough to offset its effect on growth. However, we cut our growth forecast by 0.1 percentage points due to the decline in industrial production, both in February and March. Therefore, our QoQ growth forecast for the first quarter is 0.4 percent, and the corresponding YoY forecast is 3.7 percent.
Due to the fast decline in gold imports, we expect the current account deficit to GDP ratio which was 7.9 percent at the end of 2013 to fall to 7.5 percent at the end of the first quarter. Gold-excluded
current account deficit continues to decline slowly. We expect the gold-excluded current account deficit, which was 6.5 percent at the end of 2013, to fall to 6.4 percent at the end of the first quarter.
The decision of European Central Bank is critical
The appreciation of TRL and the decline in interest rates after elections raised the question whether the Turkish Central Bank (CBRT) will also cut interest rates. Political tension and uncertainty eased after the elections. Expectations on monetary expansion by the European Central Bank (ECB) increased capital inflows. TRL appreciated 6 percent compared to March on average and the benchmark interest rate on 2 year bonds eased below 9 percent.
Inflation in Europe declined sharply at the beginning of 2013. Even though interest rates were already low in Europe, ECB further cut interest rate to 0.25 percent. However, inflation persistently remained below the targeted inflation of 2 percent. Draghi's statements in the last monetary policy committee implies that in June further actions will be taken to loosen the monetary policy. In that case, CBRT can easily lower the policy rate to stop the appreciation in TRL, without putting pressure on the already high interest rate.
In regards to growth, an interest rate cut would support domestic demand and unless there are major fluctuations in the exchange rate, limited interest rate cuts may not have a negative effect on inflation, although it certainly would remain well
above the target. Furthermore, if the ECB loosens monetary policy beyond expectations for a long period, it might somewhat offset the negative effect of expected US tightening next year.
Private consumption decreased
Most of the indicators that help us to forecast the private consumption expenditure fell in the first quarter of 2014 from the last quarter of 2013. Consumption goods imports and durable goods production fell by 8.2 percent and 0.2 percent, respectively. In the same period, consumer confidence index declined by 6.8 percent. On the other hand, special consumption tax income and non-durable goods production increased by 1.1 percent and 2.5 percent, respectively, in the first quarter. According to these figures, we expect private consumption expenditure to subtract from GDP growth.
Even though consumer confidence index fell in the first quarter from the previous one, in March and April, it increased by 5.4 percent and 6.7 percent, respectively. These increases may imply that private consumption expenditure will recover in the second quarter.
Weak private investment
Private investment seems to have declined in the first quarter. From the previous quarter, investment goods imports and investment goods production declined by 2.4 percent and 2.1 percent, respectively. In the same period, real sector confidence index fell by 5.6 percent. We expect private investment expenditure to subtract
from the real GDP growth in the first quarter of 2014.
The real sector confidence index, up three consecutive months since its large fall in January, increased 1.2 percent in April, a positive signal for the second quarter private investment expenditure.
The main engine of the growth is exports Figure 2 shows monthly changes of seasonally adjusted import and export volume indices. An emerging gap between the two indices is evident in the figure, implying a fast improving trade deficit. Indeed, from the previous quarter, export volume index increased by 4.8 percent, and import volume index declined by 4.1 percent. The deficit decreased less dramatically when gold trade is excluded. Gold-excluded exports increased by 1.5 percent and gold-excluded imports declined by 0.9 percent. We expect net exports to be the main engine of growth in the first quarter.
The current account deficit continues to decline In March, the current account deficit was $3.2 billion. In the same month of the previous year, the current account deficit was $5.6 billion. The 12-month rolling current account deficit declined from $62.4 billion to $59.9 billion, and gold-excluded current account deficit fell from $51.8 billion to $51.2 billion.
We expect the current account deficit to GDP ratio, which was 7.9 percent at the end of 2013, to fall to 7.5 percent at the end of the first quarter. We expect the gold excluded current account
deficit which was 6.5 percent at the end of 2013 to fall to 6.4 percent at the end of the first quarter. Table 2: Monthly and quarterly changes of Betam’s selected indicators (real and sa)
Economic Indicators
December
January
February
March
Quarter2013 4th Quarter2014 1stExports
2,0
3,8
1,4
**
5,1
4,8
Imports
-0,8
-4,2
-1,5
**
5,2
-4,1
Intermediate goods import
-3,3
-5,2
-3,2
**
3,2
-4,6
Consumer goods import
-2,0
-5,1
-6,7
**
0,4
-8,2
Investment goods import
-3,7
-5,1
2,4
**
0,5
-2,4
Exports excluding gold***
3,8
-2,3
-0,9
**
1,2
1,5
Imports excluding gold***
2,9
-4,8
-2,7
**
-0,2
-0,9
Industrial Production Index
1,0
-0,3
-0,4
**
1,0
1,4
Nondurable consumer goods
1,8
-2,0
1,3
**
0,5
2,5
Durable consumer goods
-3,5
3,1
1,9
**
-0,6
-0,3
Intermediate goods
3,4
-1,0
-0,4
**
1,6
2,4
Investment goods
-2,6
1,7
-3,9
**
0,7
-2,1
Capacity Utilization Rate
-1,3
-0,2
-0,1
0,7
0,6
-1,1
Nondurable consumer goods
0,1
0,8
-0,5
0,4
0,2
0,8
Durable consumer goods
-1,3
0,6
-0,3
3,3
0,3
-0,8
Intermediate goods
-1,3
0,5
-0,1
-1,3
0,9
-0,2
Investment goods
-1,2
-2,2
-0,2
0,7
0,2
-1,4
Soft Data
Consumer confidence index
(Turkstat)
-3,9
-4,7
5,4
6,7
1,5
-6,8
Real sector confidence index
-5,6
0,4
1,0
1,2
3,6
-5,6
Financial Data
IMKB 100 (Stock Exchange)
-8,5
-2,7
1,1
5,6
-1,4
-14,1
Other
Special consumption tax*
(SCT)
-0,2
0,6
-0,5
**
-1,8
1,1
Passenger Cars
7,6
-5,0
2,8
7,4
-4,0
1,6
Commercial Vehicles
4,1
1,4
1,6
4,2
-7,7
-4,6
Source: TurkStat, CBRT, Treasury, ISE, Betam. All series are real (or inflation adjusted) wherever necessary and seasonally adjusted. *This tax is collected on sales of goods such as gas.fuel oils.alcohol.tobacco products and automobiles.
**Data not yet released.
Figure 1: Capacity utilization rate and industrial production index (sa, left axis for CUR and right axis for IPI)
Source: TurkStat, Betam.
Figure 2: Volume indices of exports and imports (sa)
Source: Turkstat, Betam.
Figure 3: Gold included current account deficit to GDP ratio, 12 months
Source:TurkStat, TCMB,Betam.
Figure 4: Gold excluded current account deficit to GDP ratio, 12 months
Source: Turkstat, TCMB,Betam.
85 90 95 100 105 110 115 120 125 68 69 70 71 72 73 74 75 76 77 78 Ja n-10 Ap r-1 0 Ju l-1 0 O ct-10 Ja n-11 Ap r-1 1 Ju l-1 1 O ct-11 Ja n-12 Ap r-1 2 Ju l-1 2 O ct-12 Ja n-13 Ap r-1 3 Ju l-1 3 O ct-13 Ja n-14 Ap r-1 4 CUR IPI 80 90 100 110 120 130 140 Ja n-1 0 M ay -1 0 Se p-1 0 Ja n-1 1 M ay -1 1 Se p-1 1 Ja n-1 2 M ay -1 2 Se p-1 2 Ja n-1 3 M ay -1 3 Se p-1 3 Ja n-1 4 Export Import 0 1 2 3 4 5 6 7 8 9 10 11 20 10 (2 ) 20 10 (3 ) 20 10 (4 ) 20 11 (1 ) 20 11 (2 ) 20 11 (3 ) 20 11 (4 ) 20 12 (1 ) 20 12 (2 ) 20 12 (3 ) 20 12 (4 ) 20 13 (1 ) 20 13 (2 ) 20 13 (3 ) 20 13 (4 ) 20 14 (1 ) 0 1 2 3 4 5 6 7 8 9 10 20 10 (2 ) 20 10 (3 ) 20 10 (4 ) 20 11 (1 ) 20 11 (2 ) 20 11 (3 ) 20 11 (4 ) 20 12 (1 ) 20 12 (2 ) 20 12 (3 ) 20 12 (4 ) 20 13 (1 ) 20 13 (2 ) 20 13 (3 ) 20 13 (4 ) 20 14 (1 )
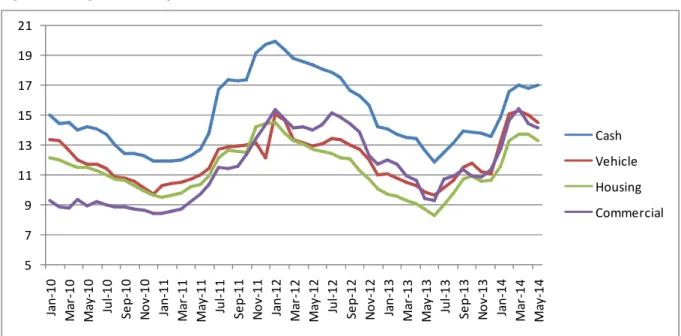
Figure 5: Weighted Average Interest Rates for Turkish Lira Banks' Loans (%) Source: CBRT. 5 7 9 11 13 15 17 19 21 Ja n-10 M ar -1 0 M ay -1 0 Ju l-1 0 Se p-10 No v-10 Ja n-11 M ar -1 1 M ay -1 1 Ju l-1 1 Se p-11 No v-11 Ja n-12 M ar -1 2 M ay -1 2 Ju l-1 2 Se p-12 No v-12 Ja n-13 M ar -1 3 M ay -1 3 Ju l-1 3 Se p-13 No v-13 Ja n-14 M ar -1 4 M ay -1 4 Cash Vehicle Housing Commercial