STRONG INCREASE IN MANUFACTURING EMPLOYMENT
Seyfettin Gursel*, Gokce Uysal and Duygu Guner
Executive Summary
According to the labor market statistics released by TurkStat, non-agricultural employment increased by 956 thousand on a year-on-year basis, while non-agricultural unemployment rate decreased from 16.7 percent to 13.4 percent. Seasonally adjusted labor market data show that non-agricultural labor force reached 17 million 630 thousand and non-agricultural unemployment rate decreased to 12.6 percent. In the period of March 2011, non-agricultural unemployment rate continued to decrease, parallel to the strong increase in manufacturing employment. On the other hand, industry production index, capacity utilization ratio and Kariyer.net data suggest that the decrease in non-agricultural unemployment rate may slow down in the upcoming periods.1
Increase in non-agricultural employment is parallel to the strong economic growth
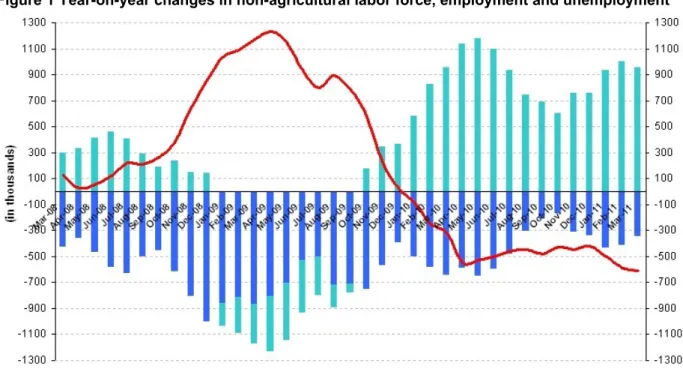
According to the labor market statistics released by TurkStat on the 15th of June, employment has reached 23 million 286 thousand in the period of March 2011 (February – March- April) while agricultural employment reached 17 million 500 thousand. Raw labor market statistics reveal that non-agricultural labor force increased by 347 thousand (1.7 percent) and non-non-agricultural employment increased by 956 thousand (5.8 percent) in March 2011. On the other hand, non-agricultural unemployment decreased from 16.7 percent to 13.4 percent during the same period (Figure 1).
Figure 1 Year-on-year changes in non-agricultural labor force, employment and unemployment
Source: TurkStat, Betam
* Prof. Seyfettin Gürsel, Betam, Director, [email protected]
Assoc. Prof. Gökçe Uysal, Betam, Vice Director, gokce.uysal @bahcesehir.edu.tr
Duygu Güner, Betam, Research Assistant, [email protected]
1On behalf of the Betam team, we would like to thank to Kariyer.net for sharing their valuable data on vacancies.
Research Brief 11/117
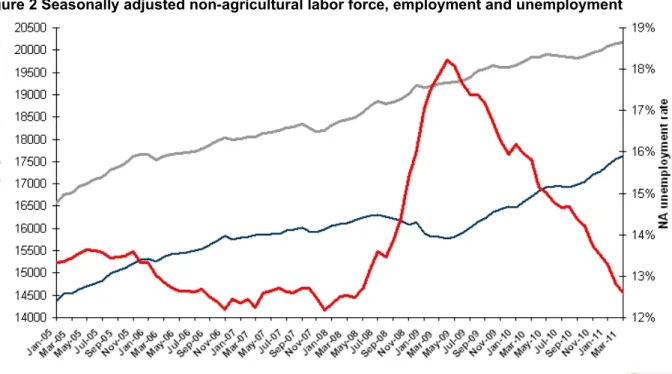
According to seasonally adjusted series, non-agricultural labor force increased by 29 thousand in March compared to its level in February and reached 20 million 172 thousand. On the other hand,
agricultural employment increased by 68 thousand to reach 17 million 630 thousand. Consequently, non-agricultural unemployment decreased by 39 thousand and non-non-agricultural unemployment rate decreased to 12.6 percent, the level in April 2008. Interestingly, unemployment rate has been decreasing steadily since reaching its maximum in April 2009 (Figure 2).
Figure 2 Seasonally adjusted non-agricultural labor force, employment and unemployment
Source: TurkStat, Betam
Kariyer.net data signals a slow down in unemployment decrease
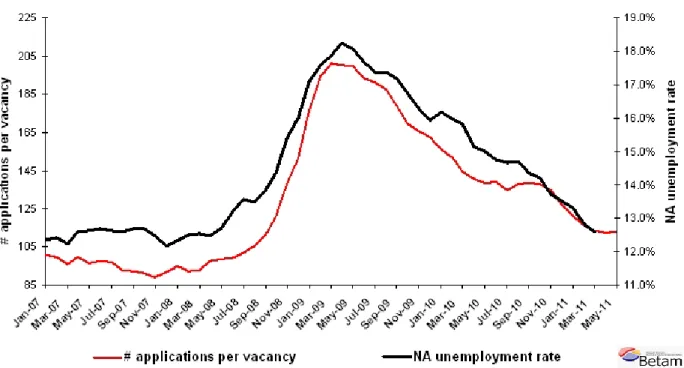
Starting from April, Betam will be using a new series released by Kariyer.net on application per vacancy. Kariyer.net collects this data via their website which is one of the largest job search engines in Turkey.2 Given the lack of data on vacancies in Turkey, we believe that this new series will provide useful insight to the labor market in Turkey. It provides information on the number of unemployed who are actively seeking work as well as the number of jobs that are available in the labor market. A decrease in applications per vacancy may be caused by an increase in vacancies or by a decrease in the number of applications. An increase in vacancies signals economic growth while decreasing number of applications indicates a decrease in number of people looking for a job. Figure 3 illustrates the seasonally adjusted non-agricultural unemployment rate and deseasonalized calendar day adjusted application per vacancy (Kariyer.net) series. It is clear that these series are highly correlated (almost 90 percent).
The decrease in application per vacancy series slowed down in March and has been more or less steady at this level since then. Hence, a slow down in non-agricultural unemployment rate decrease is highly probable in the upcoming months.
2Application per vacancy= Total number of applications/ Total number of vacancies. Both series are seasonally and calendar day adjusted.
Figure 3 Non-agricultural unemployment rate and application per vacancy (SA)
Data source: Kariyer.net, TurkStat, Betam
Strong increase in manufacturing employment
According to the seasonally adjusted figures, manufacturing employment increased by 164 thousand in March 2011 (App. 1 Table 2, App. 2 Figure 4).3 On the other hand, both capacity utilization ratio and manufacturing production index exhibit a decreasing trend for the last couple of months and these suggest that the increase in manufacturing employment may slow down in following periods. Employment in agriculture and construction increased and there is a minor decrease in service sector employment in March 2011.
3 Seasonal adjustment procedure is applied to each sector of employment series separately. Hence the sum of these series may differ from the seasonally adjusted series of total employment. The difference stems from the non-linearity of the seasonal adjustment process.
Appendix 1: Table 1 Seasonally adjusted non-agricultural labor force indicators (in thousands)
Labor force Employment Unemployment Unemployment rate Monthly changes
February-08 18411 16108 2303 12.5% Labor force Employment Unemployment
March-08 18441 16129 2312 12.5% 30 21 9 April-08 18487 16179 2307 12.5% 46 51 -5 May-08 18604 16242 2362 12.7% 117 62 55 June-08 18757 16286 2471 13.2% 154 45 109 July-08 18857 16295 2562 13.6% 100 9 91 August-08 18788 16257 2531 13.5% -70 -38 -31 September-08 18830 16220 2610 13.9% 42 -37 79 October-08 18893 16176 2716 14.4% 62 -44 107 November-08 19011 16083 2928 15.4% 118 -93 212 December-08 19200 16131 3070 16.0% 189 48 142 January-09 19160 15887 3273 17.1% -40 -243 203 February-09 19190 15815 3375 17.6% 30 -72 103 March-09 19254 15811 3442 17.9% 63 -4 67 April-09 19273 15759 3514 18.2% 20 -52 72 May-09 19286 15802 3484 18.1% 13 43 -30 June-09 19300 15890 3410 17.7% 14 88 -74 July-09 19379 16012 3367 17.4% 79 122 -43 August-09 19523 16131 3393 17.4% 144 118 26 September-09 19575 16213 3362 17.2% 51 83 -31 October-09 19662 16375 3287 16.7% 87 162 -75 November-09 19608 16419 3189 16.3% -54 44 -98 December-09 19621 16493 3128 15.9% 13 75 -61 January-10 19662 16477 3185 16.2% 40 -16 57 February-10 19748 16596 3152 16.0% 86 119 -33 March-10 19845 16707 3138 15.8% 97 111 -14 April-10 19833 16829 3005 15.1% -11 122 -133 May-10 19897 16911 2986 15.0% 63 82 -19 June-10 19879 16944 2935 14.8% -18 33 -51 July-10 19861 16950 2912 14.7% -18 6 -23 August-10 19844 16931 2914 14.7% -17 -19 2 September-10 19828 16979 2849 14.4% -16 49 -65 October-10 19867 17045 2822 14.2% 39 65 -26 November-10 19945 17209 2736 13.7% 78 164 -86 December-10 19979 17280 2700 13.5% 34 71 -36 January-11 20089 17419 2670 13.3% 110 139 -29 February-11 20143 17562 2581 12.8% 53 143 -90 March-11 20172 17630 2542 12.6% 29 68 -39
Appendix 1: Table 2 Seasonally adjusted sector of employment (in thousands)
Agriculture Manufacturing Construction Service Monthly changes
February-08 4842 4479 1260 10404 Agriculture Manufacturing Construction Service
March-08 4934 4484 1247 10429 92 5 -14 24 April-08 5091 4464 1259 10466 157 -20 12 37 May-08 5056 4496 1269 10483 -35 31 10 18 June-08 4995 4501 1257 10509 -61 6 -12 25 July-08 4971 4484 1232 10523 -24 -17 -25 14 August-08 5087 4473 1222 10519 116 -11 -10 -4 September-08 5101 4454 1235 10512 14 -19 13 -7 October-08 5196 4393 1245 10525 95 -61 10 14 November-08 5124 4302 1206 10547 -72 -91 -39 22 December-08 4966 4257 1221 10601 -159 -45 14 54 January-09 4986 4112 1246 10566 21 -145 25 -35 February-09 5023 4081 1252 10546 37 -30 7 -21 March-09 5003 4034 1258 10572 -20 -47 5 26 April-09 4996 4000 1230 10571 -7 -34 -28 -1 May-09 5129 3971 1264 10598 133 -29 34 27 June-09 5235 3968 1293 10635 106 -3 29 37 July-09 5325 4025 1308 10675 90 56 15 39 August-09 5316 4049 1321 10723 -9 25 13 49 September-09 5400 4119 1320 10735 84 70 -1 12 October-09 5469 4160 1363 10792 69 41 43 57 November-09 5520 4225 1382 10809 51 65 19 17 December-09 5573 4298 1392 10810 53 73 10 2 January-10 5678 4309 1372 10829 105 12 -20 19 February-10 5665 4362 1363 10873 -13 53 -9 45 March-10 5632 4381 1408 10934 -33 18 46 61 April-10 5657 4437 1442 10965 25 57 34 30 May-10 5560 4486 1431 10992 -96 49 -12 27 June-10 5682 4511 1434 11004 122 25 3 11 July-10 5659 4520 1469 11003 -22 8 35 -1 August-10 5668 4478 1428 11020 8 -42 -41 17 September-10 5677 4450 1430 11057 9 -28 2 37 October-10 5827 4449 1449 11076 150 -1 19 19 November-10 5879 4643 1505 11098 51 194 56 22 December-10 6025 4650 1537 11125 146 8 32 27 January-11 6038 4689 1524 11175 13 39 -13 50 February-11 6189 4706 1567 11211 151 17 43 36 Mart 11 6216 4870 1585 11196 27 164 18 -15
Appendix 2: Figure 4 Employment changes in sectors (in thousand)4
Source: TurkStat, Betam