Missing Protection
Lead Author
Jon DevineNatural Resources Defense Council
Contributing Authors
Mark DorfmanKirsten Sinclair Rosselot
Natural Resources Defense Council
Polluting the Mississippi River
Basin’s Small Streams and
About NRDC
NRDC (Natural Resources Defense Council) is a national nonprofit environmental organization with more than 1.2 million members and online activists. Since 1970, our lawyers, scientists, and other environmental specialists have worked to protect the world’s natural resources, public health, and the environment. NRDC has offices in New York City, Washington, D.C., Los Angeles, San Francisco, Chicago, and Beijing. Visit us at www.nrdc.org.
Acknowledgments
The authors of this report would like to thank reviewers Gabriella Chavarria and Nancy Stoner of NRDC and Jim Murphy of the National Wildlife Federation for their assistance. We would also like to thank The Joyce Foundation and The McKnight Foundation for their generous support.
NRDC Director of Communications: Phil Gutis
NRDC Marketing and Operations Director: Alexandra Kennaugh NRDC Publications Manager: Lisa Goffredi
NRDC Publications Editor: Anthony Clark Production: Tanja Bos, [email protected]
Copyright 2008 by the Natural Resources Defense Council.
For additional copies of this report, send $5.00 plus $3.95 shipping and handling to NRDC Publications Department, 40 West 20th Street, New York, NY 10011. California residents must add 7.5% sales tax. Please make checks payable to NRDC in U.S. dollars. The report is also available online at www.nrdc.org/policy. This report is printed on paper that is 100 percent post-consumer recycled fiber, processed chlorine free.
Table of Contents
Executive Summary 4
ChAPTER 1: Nutrient Pollution and Its Effects in the Mississippi River Basin 6
ChAPTER 2: headwaters and Wetlands: Their Function and Prevalence in the 17 Mississippi River Basin
ChAPTER 3: The Clean Water Act: Its history and Legal Scope 27
ChAPTER 4: Recommendations for Restoring Protections Throughout the Mississippi Basin 37
Executive Summary
O
ur nation’s rivers, streams, and small bodies of water have long been
protected by the Clean Water Act, but a series of misguided court decisions
now put them in danger. Recent interpretations of the law suggest that
many waters historically protected from pollution can now be polluted or destroyed
without a permitting process to limit the environmental impact of the discharging
activity. This loophole is particularly dangerous in relation to the problem of nutrient
pollution in the Mississippi River Basin. Pollution from the Mississippi contributes
to the annual formation of an enormous “dead zone” in the Gulf of Mexico, an area
where the bottom layer of water is so oxygen-depleted that most sea life cannot survive
within it. Fortunately, with immediate action to restore protections to America’s
waterways we can also address the growing trouble in the gulf.
The formation of the dead zone is caused by the die-off of massive algae blooms in the gulf. These blooms arise in large part because of nitrogen and phosphorus pollution delivered by the Mississippi River from a broad watershed. Small water bodies such as wetlands and headwater streams play an important role both as conduits and as sinks for this nutrient pollution. Evidence shows that while much of the nutrients that reach the gulf come from runoff entering headwater streams, these streams and wetlands can also intercept and remove nutrients from the water before they get to major river systems and the gulf. Actions to protect and restore the health of smaller waters throughout the basin can thus help to filter water in the Mississippi and reduce pollution contributing to the dead zone.
Two recent Supreme Court decisions, along with subsequent policy directives (often referred to as “guidance”) from the Environmental Protection Agency (EPA) the Army Corps of Engineers (Corps), endanger protections under the Clean Water Act for these functionally important waters. As discussed in detail in this issue paper, the Supreme Court and federal agencies have given rise to enormous conflict about what kinds of water bodies the law can protect. Accordingly, myriad small streams, adjacent wetlands, and “isolated” waters in the Mississippi River Basin and across the nation could lose the Clean Water Act’s protection from unregulated pollution.
The ecological significance of the small waters of the Mississippi River Basin justifies their protection. And the health of the nation’s great river and the Gulf Coast depends on such protection. The law remains strong enough— if it is enforced—to protect a great deal of these resources. To ensure that the law is enforced to the fullest degree, NRDC recommends the following:
• Congress must pass the Clean Water Restoration Act to clearly protect water bodies that had been subject to the Clean Water Act prior to the Supreme Court’s decisions.
• The EPA and the Corps must retract their guidance documents misinterpreting the Supreme Court’s decisions. • New guidance must make clear that tributaries for traditionally navigable waters—including ones with
intermittent or ephemeral flow—are protected without case-by-case analysis of their function.
• The agencies’ guidance documents must reverse the de facto policy of leaving nonnavigable “isolated” waters unprotected.
• The agencies should examine the available evidence of the importance of wetlands throughout the Mississippi River Basin, including their ecological contributions such as reducing the dead zone, and announce that the resources have a “significant nexus” to the Mississippi itself and to the gulf and therefore are presumptively protected by the Clean Water Act. Although it is not legally necessary to do so (if the agencies implement the third recommendation above), the agencies should also draw the same conclusions about the headwater and seasonal streams of the basin.
ChAPTER 1
Nutrient Pollution and Its Effects in the
Mississippi River Basin
P
lants and animals need nutrients to survive, but in high concentrations they
can be contaminants in water. Nutrients, as discussed in this issue paper,
are chemical compounds that contain nitrogen or phosphorus. Nutrient
compounds can change their form or be transferred to or from water, soil, biological
organisms, and the atmosphere. While nitrogen is found in many chemical forms,
including ammonia and nitrates, the only significant source of phosphorous in
freshwater is in the form of phosphates.
1Nutrient Pollution Is Widespread
Nutrient pollution is pervasive. Nutrients enter ecosystems from a variety of sources, including fertilizer runoff from farms, golf courses, and lawns; manure disposal; discharge from sewage treatment plants and industrial facilities; nitrogen deposition from the atmosphere; and erosion of nutrient-rich soil.2 Fertilizer, though, is a
particular culprit. In the twentieth century, scientists discovered chemical processes that fixate nitrogen from the air into reactive nitrogen compounds, and these compounds were added to plant fertilizers in significant quantities.3 Unfortunately, much of the nitrogen applied in fertilizers is lost to the environment. “In recent years,
the Mississippi River has discharged as much as one million megagrams of dissolved nitrate-nitrogen annually into the Gulf of Mexico.”4 Phosphorus pollution also comes into the gulf in great quantities from the Mississippi/
Atchafalaya Basin; the gulf received an average of 154,000 metric tons of total phosphorus between 2001 and 2005.5
Because of their wide use and environmental mobility, nutrients contribute significantly to water contamination. According to a U.S. EPA report on the state of the nation’s waters, nutrients were the fifth-leading pollutant in rivers and streams, affecting more than 15 percent of impaired stream miles.6 Nutrients are also an important
contributing factor to stream degradation. A statistically sound assessment of wadeable perennial streams—ones that are small and shallow enough to adequately sample by wading and that have water flowing through at least half the reach—revealed that nitrogen and phosphorous are the most widespread stressors in wadeable streams in the lower 48 states (riparian disturbance, streambed sediments, salinity, acidification, in-stream fish habitat, and riparian vegetation were also assessed).The same study found that streams with elevated nutrient pollution commonly had poor biological quality: “the risk of having poor biological condition was two times greater for streams scoring poor for nutrients or streambed sediments than for streams that scored in the good range for the same stressors.”7
Natural Resources Defense Council I 7
Every two years, states create lists of water bodies that are polluted to the point of being unsuitable for one or more of their designated uses, such as water contact recreation or aquatic habitat, and submit them to the EPA to be included in “303(d) lists.” Those lists, called 303(d) lists for the section of the Clean Water Act that mandates their preparation, demonstrate the breadth of nutrient pollution in the United States. According to the EPA, “[v]irtually every State and Territory is impacted by nutrient-related degradation of our waterways. All but one State and two Territories have Clean Water Act Section 303(d) listed impairments for nutrient pollution. States have listed over 10,000 nutrient and related impairments. Fifteen States have more than 200 nutrient-related listings each.”8
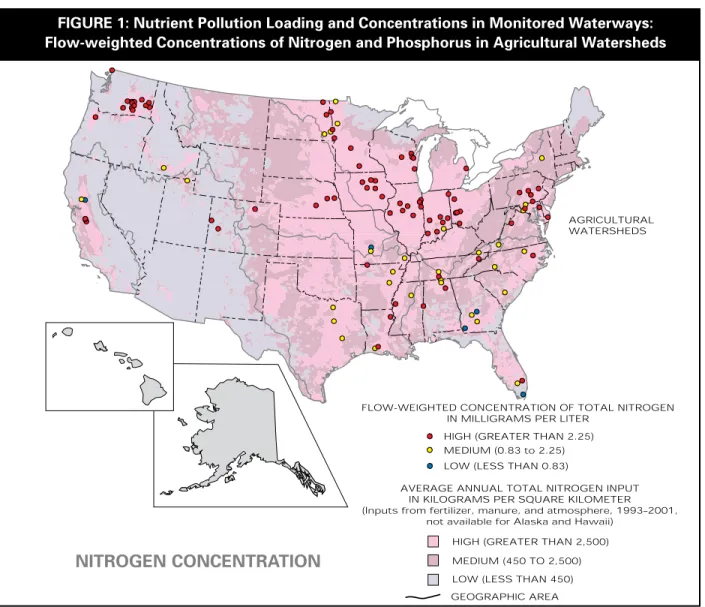
Similarly, a recently published report shows that nutrients are widespread in the environment. Between 1991 and 1997, the National Water-Quality Assessment Program of the U.S. Geological Survey assessed nutrient pollution in 51 watershed study areas, nine of which drain to the Mississippi River. 9 On average, there were about
10 sample sites for each study area. Nationwide, the researchers found that elevated nutrient concentrations were common; the observed levels exceeded the EPA’s recommended maximum levels (called “criteria”) for nitrogen at 72 percent of undeveloped sites and 96 percent of developed sites, and exceeded the phosphorus criteria at 89 percent of undeveloped locations and 97 percent of developed sites. Despite the widespread contamination, “[c]oncentrations of all nutrient constituents at sites downstream from undeveloped areas are significantly less than at all other sites.” In particular, the study noted that agricultural areas had particularly elevated nitrate and total nitrogen levels.
FIguRE 1: Nutrient Pollution Loading and Concentrations in Monitored Waterways: Flow-weighted Concentrations of Nitrogen and Phosphorus in Agricultural Watersheds
HIGH (GREATER THAN 2.25) MEDIUM (0.83 to 2.25) LOW (LESS THAN 0.83)
AGRICULTURAL WATERSHEDS
FLOW-WEIGHTED CONCENTRATION OF TOTAL NITROGEN IN MILLIGRAMS PER LITER
A
URBAN WATERSHEDS HIGH (GREATER THAN 2,500) MEDIUM (450 TO 2,500) LOW (LESS THAN 450)
AVERAGE ANNUAL TOTAL NITROGEN INPUT IN KILOGRAMS PER SQUARE KILOMETER (Inputs from fertilizer, manure, and atmosphere, 1993–2001,
not available for Alaska and Hawaii)
B GEOGRAPHIC AREA (FIGURE 3)
SOURCE: Mueller and Spahr, U.S. Geological Survey, 2006.
HIGH (GREATER THAN 0.22) MEDIUM (0.07 to 0.22) LOW (LESS THAN 0.07)
AGRICULTURAL WATERSHEDS
FLOW-WEIGHTED CONCENTRATION OF TOTAL PHOSPHORUS IN MILLIGRAMS PER LITER
A
URBAN WATERSHEDS HIGH (GREATER THAN 440) MEDIUM (35 TO 440) LOW (LESS THAN 35)
AVERAGE ANNUAL TOTAL PHOSPHORUS INPUT IN KILOGRAMS PER SQUARE KILOMETER (Inputs from fertilizer and manure, 1993–2001,
not available for Alaska and Hawaii)
B GEOGRAPHIC AREA (FIGURE 3)
PhOSPhORuS CONCENTRATION
Nutrient Pollution Contributes to Dead Zone in the gulf of Mexico
The formation of an oxygen deprived area in the northern Gulf of Mexico is a problem caused in large part by nutrient pollution traveling through the Mississippi River watershed. In some ways, that is just the tip of the iceberg of environmental concerns tied to nutrient contamination, which include nitrate-contaminated drinking water, contribution to disinfection byproduct formation, and harm to aquatic life (see sidebar below).
In aquatic ecosystems, hypoxia refers to a depletion of the concentration of dissolved oxygen in the water column. Excessive nutrients, such as nitrogen, lead to aquatic plants and algae rapidly increasing in abundance. When algae die, the organic material sinks to bottom waters, where microbes decompose it and consume oxygen in the process, leading to a condition called eutrophication. When aquatic systems become eutrophic, hypoxic conditions can result. Moreover, in the northern Gulf of Mexico, the freshwater delivered from river systems to the gulf does not mix well with the salty and denser receiving water; this stratification exacerbates the problem by keeping the oxygen-depleted water on the sea bottom. A schematic of this process appears on page 10.
Nitrate-Contaminated Drinking Water: Excessive levels of nitrate in drinking water can cause human
health problems. Nitrate in drinking water has been linked to “blue baby” disease (methemoglobinemia), which particularly affects newborns. This is the primary health hazard from drinking water high in nitrates and occurs when bacteria in the digestive system converts nitrate to nitrite. The nitrite reacts with iron in the hemoglobin of red blood cells to form methemoglobin, which lacks the oxygen-carrying ability of hemoglobin. The result is that the blood lacks the ability to carry sufficient oxygen to the cells of the body.10
To guard against this problem, the EPA established a drinking water standard, intended to protect vulnerable populations, of 10 milligrams per liter of nitrate. Nationwide, a total of 562 drinking water systems serving more than 250,000 people had violations of applicable nitrate requirements in the most recent year for which the EPA has data.11
Formation of Trihalomethanes: Nutrients effectively fertilize algae in water bodies. This occurs in local
water bodies as well as in faraway gulf waters. When algae are present in raw water used by drinking water supply systems, as the EPA explains, unhealthful compounds may form during disinfection: “Trihalomethanes are carcinogenic compounds that are produced when certain organic compounds are chlorinated and
bromated as part of the disinfection process in a drinking water treatment facility.”12 In a single year (fiscal
year 2007), the EPA reports that 1,408 drinking water systems serving more than four million people violated requirements for disinfection by-products, of which trihalomethanes are a subset.13
Harm to Aquatic Life: Nutrient enrichment in streams directly affects animal communities in these water
bodies. For example, research shows that elevated levels of phosphorus correlate with declines in invertebrate community structure.14 High concentrations of nitrogen in the form of ammonia are known to be toxic to
aquatic animals. “Depending on the number of hydrogen atoms in the compound, ammonia in water may be ionic (having an electrical charge) or un-ionized (having no charge). The un-ionized form is more toxic to fish.” 15
Excessive levels of algae also cause problems for aquatic life. In addition to hypoxia, algae can generate toxic by-products that can sicken swimmers and cause die-offs of aquatic life ranging from shellfish to marine mammals.16 According to one report, a “preliminary and highly conservative nationwide estimate of the
average annual costs of [harmful algal blooms] is approximately $50 million.”17
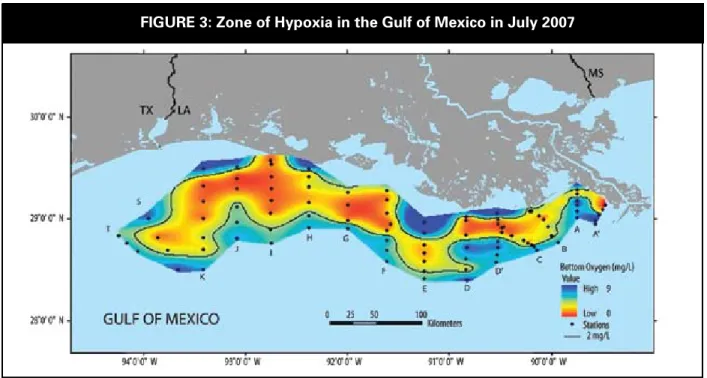
This phenomenon plays out on a grand scale along the Louisiana-Texas coast. Nutrients contribute to the creation of a large zone of seasonally low dissolved-oxygen concentrations in the Gulf of Mexico. Aquatic life flees this zone when it can and dies when it cannot. The dead zone varies in size from year to year, but the average size from 1985 to 2007 was 13,500 square kilometers. 19 In 2007, the dead zone was the third-largest dead zone on
record since systematic measurements began, reaching 20,500 square kilometers (see Figure 3), an area roughly the size of New Jersey.
FIguRE 3: Zone of hypoxia in the gulf of Mexico in July 2007
FIguRE 2: Overview of hypoxia Development
18CREDIT: NaTIONal SCIENCE aND TEChNOlOGy COUNCIl, COMMITTEE ON ENvIRONMENT aND NaTURal RESOURCES, INTEGRaTED aSSESSMENTS Of hypOxIa IN ThE NORThERN GUlf Of MExICO (May 2000)
Obviously, a state-size region of oxygen-starved water raises serious concerns for important fishing resources. For instance, shrimpers today find it more difficult to reach the same level of catch that prior generations were able to accomplish. It is not clear that hypoxia harms the overall condition of the gulf’s fishery; while the National Research Council notes that there have not been “catastrophic losses of fisheries resources in the northern Gulf of Mexico,” the Council further reports:
Numerous studies document the effects of hypoxia on coastal fishes and shrimp. Shrimp, as well as the dominant fish, the Atlantic croaker, are absent from the large areas affected by hypoxia. There is a negative relationship between the catch of brown shrimp—the largest economic fishery in the northern Gulf of Mexico—and the relative size of the midsummer hypoxic zone. The catch per unit effort of brown shrimp has also declined during the recent interval in which hypoxia was known to expand. The presence of a large hypoxic water mass when juvenile brown shrimp are migrating from coastal marshes to offshore waters inhibits their growth to a larger size and thus the poundage of captured shrimp. The unavailability of suitable habitat for shrimp and croaker forces them into the warmest waters inshore and also cooler waters offshore of the hypoxic zone with potential effects on growth, trophic interactions, and reproductive capacity.23
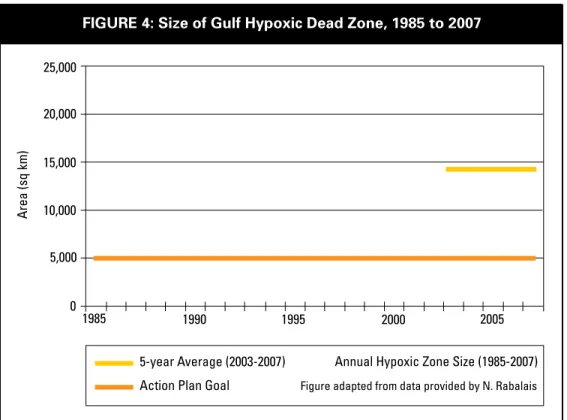
Concerns about the dead zone led to the formation of the Mississippi River/Gulf of Mexico Watershed Nutrient Task Force in 1997. Following the development of an integrated scientific assessment of hypoxia in the northern Gulf of Mexico, the Task Force released an action plan in 2001 that set a goal of reducing the average size of the zone of hypoxia to 5,000 square kilometers by 2015.24 Unfortunately, a number of the actions in the plan were not
carried out, preventing significant progress toward the goal.25 Indeed, although roughly half of the timeline laid out
in the action plan has elapsed, the size of the dead zone in 2007 was more than four times the plan’s target, and nearly the same as it was in 2001 when the goal was set. Similarly, the five-year average from 2003 to 2007(14,644 km2) remained significantly above the goal and was roughly equivalent to the average from 1996
to 2000 (14,128 km2).26
As we finished work on this issue paper, researchers from the Louisiana Universities Marine Consortium completed their mapping of the dead zone for 2008. Reaching 20,720 square kilometers, the hypoxic zone was the second-largest ever recorded.20 Although far from good news, their finding was a bit of a relief given
estimates that the amount of nitrogen entering the gulf reached its highest level in nearly 40 years and brought with it the potential for the largest dead zone ever.21 The researchers suggested that Hurricane Dolly churned
up the water in the Gulf enough to avoid breaking the record.22
Nutrient Pollution Is A Major Cause of Dead Zone
A number of factors contribute to the size of the dead zone (see sidebar below), but nutrient pollution substantially drives the problem, and new science underscores the need to target both nitrogen and phosphorus loadings. Until relatively recently, scientists thought that nitrogen was primarily responsible for hypoxia in marine waters and that freshwater systems responded more to phosphorous levels.27 However, the evidence now suggests that both nitrogen
and phosphorus affect the size of the dead zone. It appears that phosphates entering the gulf via the Mississippi and Atchafalaya rivers are important to near-shore eutrophication, particularly during the peak time of algae growth (February to May). 28
What other factors influence the size of the dead zone? FIguRE 4: Size of gulf hypoxic Dead Zone, 1985 to 2007
Source: Mississippi River/Gulf of Mexico Watershed Nutrient Task force, Gulf hypoxia action plan 2008.
For one, water in the northern gulf is stratified; low-salinity freshwater from the Mississippi and Atchafalaya rivers enters the gulf and acts as a barrier to vertical mixing, causing water low in oxygen to remain on the floor of the gulf. 29 In particular, the diversion of water from the Mississippi River to the Atchafalaya River,
which empties into the gulf 200 kilometers west of the mouth of the Mississippi, appears to contribute to the dead zone. The ocean shelf drops steeply at the mouth of the Mississippi River but remains shallow far offshore of the mouth of the Atchafalaya River. Consequently, the freshwater coming from the Atchafalaya does not mix as well with bottom water as the water coming from the Mississippi to the gulf does,
preventing the oxygenation of that water.
The time of year that nutrients reach the gulf also influences the size of the hypoxic zone. Nutrients delivered in the spring affect the size of the dead zone more than fluxes at other times of year. The highest productivity of plankton, including algae, occurs in the spring, a time when “the river is disproportionately enriched with all nutrients ... but particularly with nitrate.”30
25,000 20,000 15,000 10,000 1985 5-year Average (2003-2007) Action Plan Goal
Annual Hypoxic Zone Size (1985-2007)
Figure adapted from data provided by N. Rabalais
1990 1995 2000 2005
5,000 0
Pollution also weakens the gulf’s resistance to future hypoxia, according to recent information. Last December an expert panel studying hypoxia for the EPA concluded that the gulf has apparently undergone a “regime shift,” making it more sensitive to nutrient pollution than it was in the past. 31 Addressing hypoxia therefore requires more
nutrient pollution reduction than was previously expected. Experts previously thought that reducing the dead zone to a five-year average of 5,000 square kilometers would require cutting only nitrogen, and only by approximately 30 percent. However, the latest scientific assessment recommends reducing both nitrogen and phosphorus by at least 45 percent.32
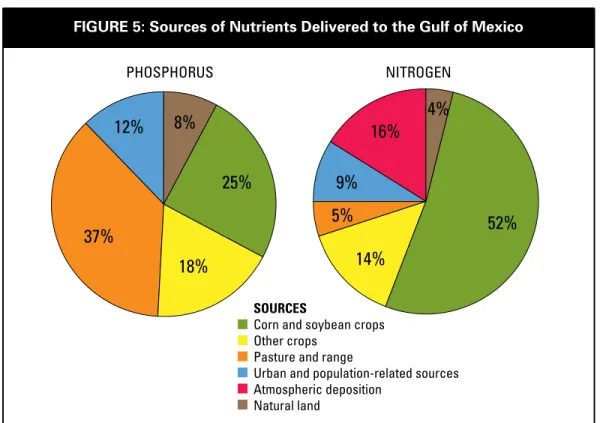
But where are all these nutrients coming from, and where will it be important to concentrate pollution reductions? The evidence clearly shows that areas with significant agricultural uses are the largest contributors of nutrient pollution to the gulf. Specifically, a recent analysis using a detailed water-quality model estimated that 52 percent of Mississippi Basin nitrogen comes from lands on which corn or soybeans are grown, while another 14 percent in the Mississippi Basin comes from other crop production, including wheat and alfalfa. For phosphorus, 80 percent of the pollution comes from manure on pastureland and rangeland (37 percent), corn/soybean production (25 percent), and other crops (18 percent).33 The pie charts that follow show the degree to which
different sources contribute to nutrient pollution.34 On many of these lands the movement of nutrient-laden water
away from fields and into river systems is particularly efficient, because they frequently have an extensive network of subsurface tile drains that are designed to rid these fields of excess water.
FIguRE 5: Sources of Nutrients Delivered to the gulf of Mexico
Source: United States Geological Survey
SOURCeS
Corn and soybean crops Other crops
Pasture and range
Urban and population-related sources Atmospheric deposition Natural land PHOSPHORUS NITROGEN
8%
25%
18%
37%
12%
16%
4%
9%
5%
14%
52%
As the maps below indicate, a number of states in the Mississippi Basin are primarily responsible for much of the delivered nutrient pollution. The U.S. Geological Survey, which performed this analysis, explains: “Nine states in the Mississippi River Basin with the largest nutrient deliveries to the Northern Gulf of Mexico contribute more than 75 percent of the nitrogen and phosphorus to the gulf, but make up only one-third of the 31-state Mississippi River drainage area. These states include Illinois, Iowa, Indiana, Missouri, Arkansas, Kentucky, Tennessee, Ohio, and Mississippi.”35
Similarly, the the U.S. Geological Survey found that on average, from 2001 to 2005, the upper Mississippi and Ohio-Tennessee River “subbasins represent about 31 percent of the total land area within the [Mississippi-Atchafalaya River Basin], yet they contribute about 82 percent of the nitrate-nitrogen flux, 69 percent of the total Kjedahl Nitrogen (sum of organic nitrogen, ammonia, and ammonium), and 58 percent of the total phosphorus flux.”36 Indeed, these estimates may understate the importance of these areas to the hypoxia problem; available
information indicates that “the upper Mississippi and Ohio-Tennessee River subbasins currently represent nearly all of the spring [nitrogen] flux to the gulf. These subbasins represent the tile-drained, corn-soybean landscape of Iowa, Illinois, Indiana, and Ohio and illustrate that corn-soybean agriculture with tile drainage leaks considerable [nitrogen] under the current management system. The source of riverine [phosphorus] is more diffuse, although these subbasins are also the largest sources of [phosphorus].”37
FIguRE 6: State-by-State Share of Nutrient Contributions
Source: U.S. Department of the Interior, U.S. Geological Survey, Nutrient contributions to the gulf, by state (http://water.usgs.gov/nawqa/sparrow/gulf_findings/by_state.html) PeRCeNt ShaRe <1 1 to 5 5 to 10 10 to 17 PHOSPHORUS NITROGEN
Tile Drainage Can Worsen Polluted Runoff Problems
To improve the agricultural productivity of land, crop producers—particularly in the upper Midwest—commonly use subsurface drainage systems, which are now prevalent across the landscape. According to one recent analysis, for instance, 32.4 percent of the cropland in Iowa has subsurface drainage; in Illinois, Ohio, and Indiana, the percentages are even higher (47.8 percent, 48.3 percent, and 42.2 percent, respectively), and in some individual counties, the percentages are extremely high.38
Because subsurface drainage historically was constructed out of clay pipes called tiles, the practice of installing drainage systems is commonly known as tiling, even though modern systems often use plastic tubes. Tiles have openings to allow subsurface water to enter the drain when the water table is above the tile.40
Tiles can exacerbate nutrient pollution. Although phosphorus generally runs off agricultural land with
subsurface drainage to a lesser degree, nitrate-laden water moves easily through soil to tiles, where it is transported to surface waters.
Biofuels and Their Potential Impact on the Dead Zone
In part to help combat dangerous global warming, policymakers in recent years have become more interested in increasing the degree to which U.S. consumers rely upon renewable fuels for their motor vehicles. However, policies that simply encourage the use of more biofuels such as ethanol from corn could result in an increase in the size of the dead zone, because corn cultivation typically involves larger amounts of fertilizer than other crops. Experts expect rapid growth in grain-based ethanol production in the coming years; this potentially will have major implications for the dead zone, unless there is a significantly greater focus on conservation practices in agriculture in general and the performance of biofuels production specifically.
Corn prices have increased dramatically, driven by energy prices, growing international demand, and increasing demand for ethanol. Not surprisingly, as prices have gone up, so has the number of acres in corn production: “Corn acreage in the United States rose to nearly 93 million acres in 2007 (a 17 percent increase), a level not seen since 1944.”41 According to the Renewable Fuels Association, the trade group for the ethanol industry, “ethanol soared to
6.5 billion gallons in 2007, a 32 percent increase from the 4.9 billion gallons produced in 2006.” Looking forward, the Association estimates that the industry’s production capacity will rise from 7.8 billion gallons in 2007 to 13
Discharge from a tile drainage system. CREDIT: phOTOGRaph by STEphEN haRDEN, U.S. GEOlOGICal SURvEy, 200139
billion gallons once the biorefineries currently being constructed or expanded come online.42 The vast majority of
this new ethanol production is likely to come from corn.
New legislation will also drive increased corn ethanol production. The Energy Independence and Security Act of 2007 will greatly expand biofuels production; it sets a target of at least 36 billion gallons of biofuels per year by 2022. 43 Although the law states that a minimum of 21 billion gallons must be “advanced” (derived from plants’
cellulosic material rather than corn grain, for instance), it still leaves room for at least 15 billion gallons of corn-based ethanol that year. This law does include important minimum global warming pollution standards and land use safeguards, but it does not explicitly require better fertilizer management or overall water quality or quantity performance improvements.
Last October the National Research Council issued a report titled “Water Implications of Biofuels Production in the United States.”44 This review makes it clear that, without additional safeguards, increased biofuels production
can be expected to increase water pollution from agriculture and intensify many regional and local water shortages. It reaffirms that “[e]xpansion of ethanol production ... will drive increased corn production until marketable future alternatives are developed.”45 The report even addressed the particular concern of the dead zone:
All else being equal, the conversion of other crops or non-crop plants to corn will likely lead to much higher application rates of nitrogen. Given the correlation of nitrogen application rates to stream concentrations of total nitrogen, and of the latter to the increase in hypoxia in the nation’s water bodies, the potential for additional corn-based ethanol production to increase the extent of these hypoxic regions is considerable. 46
A recent scientific review reached a similar conclusion. To roughly estimate the scale of increased nutrient loading associated with ethanol production, the EPA Science Advisory Board used predicted corn acreage increases in the next several years and estimated that the cultivation of the corn could lead to the increased runoff of 238 million pounds of nitrogen per year in the Mississippi River Basin.47
These outcomes are not inevitable. Addressing water pollution and consumption should be integrated into policies and programs that promote biofuels production, such as tax credits and other incentives. In particular, management practices that help reduce nutrient pollution should be part of a suite of minimum standards
applicable to energy crop producers. (For NRDC’s road map to responsible biofuels production, see Getting Biofuels
Right: Eight Steps for Reaping Real Environmental Benefits From Biofuels, available online at www.nrdc.org/air/
transportation/biofuels/right.pdf.) More generally, as pressure builds on farmers and foresters to increase output and cut costs, farm bill programs to promote soil, water, and wildlife conservation need to grow dramatically larger and more effective.
S
mall streams and wetlands are important because these nonnavigable water
bodies help to purify water. The small water bodies profiled here include
streams in the upper reaches of watersheds and streams that do not flow
year-round, which scientists refer to as “intermittent” or “ephemeral” streams. (For ease of
reference, one can describe these as headwater and seasonal streams.) Many wetlands,
including those adjacent to headwater and seasonal streams and those that are isolated
from other waters, are also included as they are similarly nonnavigable by boat and
critical to water quality.
headwater Streams Contribute To Improved Water Quality
In the area under and next to a streambed, known as the hyporheic zone, water interacts with saturated sediments and the microbial organisms that live there (see Figure 7 on page 18). In headwater streams, increased contact occurs because of the slower movement of water and because such streams are often shallow. 48 This process can
remove nutrients. In particular, microorganisms living in the hyporheic zone consume inorganic nitrogen and phosphorous and convert them into forms that are less likely to result in downstream algal growth. As a recent scientific survey of the ecological functions of small streams explains, headwater streams are important nutrient sinks:
• “[N]itrate removed by headwater streams accounts for half of total nitrate removal in entire river basins.” • “The nutrients that are not removed in headwater streams travel far downstream because uptake processes
are less efficient in larger systems.”
• “A mathematical model based on research in 14 headwater streams throughout the U.S. shows that 64 percent of inorganic nitrogen entering a small stream is retained or transformed within 1,000 yards.”49
This phenomenon occurs in the headwater and seasonal streams of the Mississippi River Basin, too. Modeling of nitrogen and phosphorus delivered from watersheds within the basin to the gulf shows that the higher the percentage of water delivered, the lower the nutrient removal.50 In general, the model results indicate that a larger
percentage of nitrogen is delivered to downstream waters by larger river systems. That is, once nutrients enter larger rivers, there is typically very little pollution removal.
ChAPTER 2
headwaters and Wetlands: Their
Function and Prevalence in the
Mississippi River Basin
Missing Protection: Polluting the Mississippi River Basin’s Small Streams and Wetlands
Aquatic features need not be permanently flowing, or permanently connected to other waters, to be important for nutrient removal. Intermittent and ephemeral streams, which flow in response to precipitation, are also
important because the same precipitation that causes nutrient runoff also causes the streams to flow and enables the in-stream nutrient removal processes to occur.
CASE STuDIES: Small Stream Nutrient Removal In Midwest River Systems
4 Examination of nitrogen flows through an intact headwater stream near the source of the Mississippi River51
Scientists from the University of California at Davis and the U.S. Geological Survey followed the flow of dissolved inorganic nitrogen (DIN) through a section of the headwaters of the Shingobee River in north-central Minnesota, about 40 kilometers from the source of the Mississippi River. The study helps explain the natural abilities of an intact headwater stream to capture dissolved nitrogen prior to its connection with the larger river system.
DIN includes three forms of nitrogen: ammonia, nitrite, and nitrate. When environmental conditions are right, certain bacteria can convert ammonia to nitrite and then to nitrate. Dissolved nitrate can be taken up from the water by aquatic plants and eventually returned as ammonia when the plants decay. It can also be converted to nitrogen gas by other kinds of bacteria and released harmlessly to the air. The long, shallow beds of headwater streams are more favorable for the growth of both kinds of bacteria; such streams also enhance bacteria’s contact with DIN, more so than the deep open waters farther downstream.
This study looked at the transport of DIN through “four hydrologically distinct but physically connected zones: (1) hillslope groundwater (ridge to bankside riparian), (2) alluvial riparian groundwater, (3) hyporheic groundwater discharged through bed sediment (hyporheic), and (4) stream surface water.” Each zone played a different role in the retention of dissolved nitrogen. For example, nitrate concentrations were reduced about 97 percent through zone 1. In zones 2 and 3, summertime nutrient removal rates were greater since higher temperatures favored greater biological activity. The longer and shallower the stream, the more effective the retention of DIN during the summer months, and the better the stream functions to ultimately convert
FIguRE 7: Illustration of the hyporheic Zone
17
hyporheic
zone hyporheicFlow in
zone
Figure 14. Surface-water exchange with ground water in the hyporheic zone is associated with abrupt changes
in streambed slope (A) and with stream meanders (B).
Figure 15. Streambeds and banks are unique environments because they are where ground water that drains much
of the subsurface of landscapes interacts with surface water that drains much of the surface of landscapes.
Stream
Stream
Interface of local and regional ground-water flow systems, hyporheic zone, and stream
Direction of ground-water flow Direction of gr ound-water flow Water tab le H y p o r h e i c zo n e
Streambeds and banks are unique environments where groundwater draining from the subsurface of landscapes interacts with surface water draining from the surface of landscapes.
through riparian and hyporheic zones, constitute a critical nexus in mitigating downstream DIN loading to navigable waterways.”
The same level of removal, however, would not be expected if massive nitrate loadings from row crop agriculture were to overwhelm this natural system. Moreover, the loss of a headwater stream’s hydrologic integrity through channelization or other modifications could both increase loading and accelerate flows through the system, thereby decreasing nitrogen retention and further increasing loading to downstream waters.
4 East-Central Illinois: The impact of stream alterations on the nitrate removal capacity of headwaters in a heavily agricultural area52
Headwater streams in five areas of east-central Illinois have been dramatically altered during the region’s transition from natural prairie and wetlands to intensive agricultural production. Several studies of these streams and comparable but undisturbed streams reveal the important role that natural streams play. The streams in question had been subjected to stream incision (downward erosion), straightening (channelization), widening, and substitution of the naturally diverse riparian vegetation with grass. About 67 percent of all second-order streams in the Embarras Basin have been channelized; the proportion is even higher for the Kaskaskia River. The impacts of these alterations are compounded by extensive tile drainage in the respective watersheds.
In 2001 scientists from the University of Illinois–Urbana and the University of Notre Dame conducted a nitrate removal study on five headwater sites within three of the major river basins in east-central Illinois: the Sangamon, Embarras, and Kaskaskia river basins. In these headwater streams, the researchers found that nitrate levels routinely exceeded 10 mg per liter and could approach 20 mg per liter after a heavy rain with removal rates of less than 5 percent.
In contrast, a team of researchers from Kansas State University, Utah Valley State College, the University of Notre Dame, and the Ecosystems Center at Woods Hole found that undisturbed small streams in natural prairie settings in Kansas, similar to pre-European settlement conditions in east-central Illinois, removed 23 percent of nitrogen.
Considering this evidence, one study’s authors concluded that “headwater streams in east-central Illinois are less retentive of [nitrogen] now than they were before European settlement and conversion of the native prairie and wetlands to agriculture.”
A synthesis of several studies’ findings concerning nitrogen removal in river systems confirms the importance of smaller streams. For example, increased nitrogen removal generally corresponds to shallower stream depths.53
Besides processing nutrients so that they are retained or less likely to cause harm downstream, undisturbed headwaters help maintain steady water supplies, reduce flooding, trap excess sediment, sustain downstream ecosystems, and maintain biological diversity.
Wetlands Serve As Natural Water Filters
As the National Research Council states, “Wetland ecosystems, once ubiquitous in the Mississippi River Basin, serve important functions in regulating runoff and in reducing runoff of pollutants.”54 In particular, wetlands
are recognized nutrient sinks, because the wetland plants use the nutrients as they grow, reducing the available nutrients for later use by algae.
Wetlands adjacent to other water bodies can intercept nutrients and keep the nearby waters cleaner. For instance, a study of a Pennsylvania marsh found that the wetland significantly reduced nutrient levels in waters
passing through.55 The EPA observes that “[r]ecently published studies on pollutant removal rates for natural and
restored wetlands indicate that, depending on the type of wetland, the season, and other factors, wetlands can retain significant percentages of nitrates, ammonium, phosphorus, and sediment loads.”56 Because of this purifying
capacity, wetlands are often referred to as the kidneys of the aquatic environment.57 Similarly, studies have shown
that wetlands associated with the smallest streams are the most effective at reducing nutrients. One study showed that the wetlands of the streams at the top of the watershed did the vast majority of the work, removing 90 percent of the total amount of phosphorous removed by wetlands in eight northeastern watersheds.58
So-called isolated wetlands also can remove nitrate quickly.59 Although few, if any, wetlands are truly isolated
from the aquatic system, wetlands that appear to be isolated from other water bodies can clean nutrient-laden stormwater. A survey of the role that such wetlands play in water quality found that prairie potholes (common in the Great Plains), slope wetlands, and flats can and do retain nutrients.60
CASE STuDIES: Nutrient Removal By Wetland Systems In The Midwest 4 Wetlands nab nitrogen from waters flowing into midwestern reservoir61
Lake Bloomington serves as the drinking water source for about 70,000 inhabitants of the city of
Bloomington in central Illinois’s McLean County. Every year from 1986 through 2003, Lake Bloomington’s waters exceeded the maximum contaminant levels for nitrate—not surprising, given that 86 percent of the lake’s watershed is used for corn and soybean agriculture.
In 1997 scientists reconstructed natural wetlands near Lake Bloomington similar to those once existing in the greater midwestern United States. The project recreated nature’s own purification systems for reducing nitrate contamination in the waters running off nearby agricultural lands by 31 to 42 percent. The report suggests that multi-million dollar investments in drinking water treatment plants in local watersheds could be mitigated if preserving or restoring wetlands alleviate contamination problems.
4 Constructed wetlands lower nitrogen and phosphorus content of polluted water62
In 1998, researchers at the Ohio State University created a wetland, roughly three acres in size and draining an agricultural area approximately 14 times bigger, adjacent to a tributary stream flowing to the South Fork of the Great Miami River. The Great Miami River flows into a lake, which then flows to the Ohio River and on to the Mississippi.
The researchers have monitored the water quality of the incoming and outgoing water flows over time and have found that the wetland’s ability to remove nutrients increased with age. In 1999 the wetland reduced nitrate-nitrite levels by an average of 30 percent and diminished total phosphorus pollution by an average of 37 percent. In a subsequent analysis reported in 2005, the wetland “reduced levels of phosphorus by nearly 60 percent and nitrates by 40 percent.” One of the researchers stated that the wetland might be expected to eventually stop removing phosphorus—which does not degrade over time—but should continue to remove nitrogen.
The geographic Extent of the Small Water Bodies of the Mississippi River Basin
Parts of some 31 states are included in the broad area—approximately 41 percent—of the continental United States drained by the Mississippi River Basin.63 Of these, 10 states touch the “main stem” of the Mississippi:
Minnesota, Wisconsin, Illinois, Iowa, Missouri, Kentucky, Tennessee, Arkansas, Mississippi, and Louisiana. We will focus on those central states below.
A good deal of information is available about the kinds of nonnavigable water bodies that exist in each state. For instance, in response to public requests and Freedom of Information Act demands, the EPA has provided
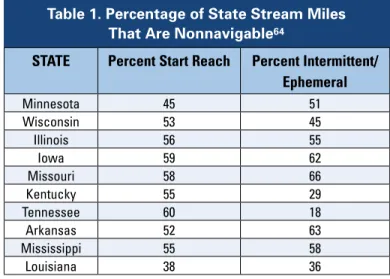
data about the kinds of streams located in each state most likely to be nonnavigable: headwater streams (referred to as “start reaches”—streams into which the agency’s database indicates there are no other tributaries flowing) and seasonal streams. As shown in Table 1, the extent of such streams in each of the main stem Mississippi states is significant.
Given their prevalence, these nonnavigable streams are important components of the states’ water resources, and discharges into them are currently limited by Clean Water Act permits. Table 2 indicates the number of people in each state served by drinking water suppliers drawing some of their water from source water protection areas (SWPAs) containing at least one headwater or seasonal stream. Table 3 shows the number of pollution sources with individual permits under the Act’s National Pollutant Discharge Elimination System program currently authorized to discharge into such waters. The main stem Mississippi states have more than 14 million people who depend at least to some degree on nonnavigable streams for their drinking water, and have roughly 5,000 sources whose pollution into such water bodies currently is subject to a Clean Water Act permit.
It does not take much imagination to conceive what might happen if a significant portion of these waters lost the Act’s legal protections, and pollution-limiting permits were annulled. Perhaps concerns such as these were what led state officials in every single main stem state to join a brief to the Supreme Court in the most recent case interpreting the Clean Water Act’s scope, which argued for broad protections for nonnavigable tributaries and their adjacent wetlands.67
Table 1. Percentage of State Stream Miles That Are Nonnavigable64
State Percent Start Reach Percent Intermittent/ ephemeral Minnesota 45 51 Wisconsin 53 45 Illinois 56 55 Iowa 59 62 Missouri 58 66 Kentucky 55 29 Tennessee 60 18 Arkansas 52 63 Mississippi 55 58 Louisiana 38 36
Table 2. Nonnavigable Streams as Drinking Water Sources65
State Population Served by SWPas Containing Nonnavigable Stream(s) Minnesota 959,301 Wisconsin 199,457 Illinois 1,623,780 Iowa 620,639 Missouri 2,549,622 Kentucky 3,097,903 Tennessee 2,963,333 Arkansas 911,466 Mississippi 289,740 Louisiana 1,071,156 tOtaL 14,286,397
Table 3. Permitted Sources Discharging to Nonnavigable Streams66
State Number of Individual Permits on Start Reaches
(Percentage of total) Number of Individual Permits on Intermittent/ ephemeral Streams (Percentage of total) Minnesota 183 (30%) 169 (28%) Wisconsin 212 (31%) 191 (28%) Illinois 823 (43%) 746 (39%) Iowa 513 (42%) 484 (39%) Missouri 1,470 (55%) 1,603 (60%) Kentucky 910 (50%) 412 (23%) Tennessee 136 (12%) 74 (6%) Arkansas 345 (43%) 389 (48%) Mississippi 401 (55%) 409 (56%) Louisiana 393 (34%) 255 (22%) tOtaL 5,386 4,732
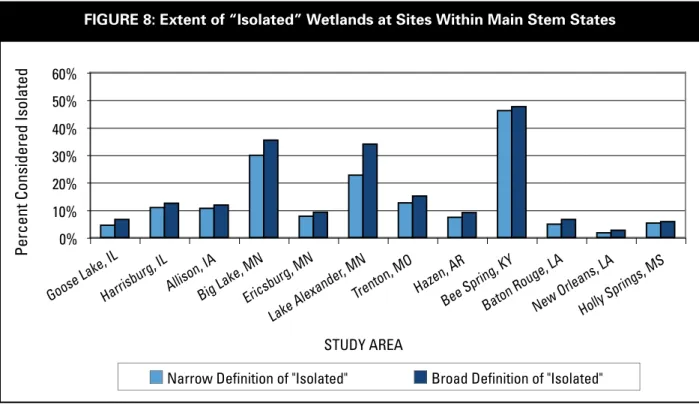
So-called isolated wetlands are also common in the states that border the Mississippi River. In 2002 the U.S. Fish and Wildlife Service used Geographic Information System analysis to estimate the extent of “isolated” wetlands in various regions across the country. 68 The graph below summarizes the results for sites within the
Mississippi main stem states and indicates the percentage of wetland area determined to be “isolated” under different assumptions about what factors make a water body “isolated.” As is evident from the table, “isolated” waters are not rare in Mississippi River states. (Nationally, “isolated” wetlands are also common; approximately 20 percent of wetlands in the continental U.S. are “isolated.”) Moreover, as the next section discusses, many wetlands have already been lost in the basin, making it even more important to protect the remaining resources.
States Object to Loss of Clean Water Act Protections for headwaters and Wetlands
In 2003, in response to a Supreme Court decision interpreting the scope of the Clean Water Act concerning intra-state, nonnavigable, “isolated” waters discussed in Chapter 3, the EPA and the Army Corps initiated a regulatory proceeding to consider revising their rules to restrict which kinds of water bodies are protected by the Act. The agencies received roughly 133,000 comments on the action, some 99 percent of which urged the EPA and the Corps not to change the rules.69 Importantly, “[a]n EPA official stated that 41 of the 43 states that submitted
comments were concerned about any major reduction in Clean Water Act jurisdiction.”70 A number of these
comments discussed the extent and importance of headwater and seasonal streams, wetlands, and “isolated” waters in the main stem states of the Mississippi and are summarized here.
Minnesota: The Minnesota Department of Natural Resources first noted that the concept of “isolated” waters was a problematic one, saying, “With more than 10,000 lakes, unpredictable weather patterns including flooding and drought, and complex hydrogeologic features, it is very difficult for us to consider and even more difficult to prove that any of our surface waters are truly isolated.”71 The agency also argued that the state water resources,
including ones that appear to be isolated, were closely linked with interstate commerce and should be protected. And the agency estimated that, depending on how one defines the term, between 12 and 23 percent of the state’s
FIguRE 8: Extent of “Isolated” Wetlands at Sites Within Main Stem States
Goose Lake, ILHarrisburg, ILAllison, IABig Lake, MNEricsburg, MN Lake Alexander
, MN
Trenton, MO Hazen, ARBee Spring, KY
Baton Rouge, LANew Orleans, LAHolly Springs, MS
Percent Considered Isolated
Narrow Definition of "Isolated" Broad Definition of "Isolated"
wetlands could be considered “isolated.”72 The agency concluded by saying, “Excluding a substantial subset of the
nation’s waters from CWA jurisdiction will make it nearly impossible to achieve the overall goals of the Act.”73
Wisconsin: The state Department of Natural Resources expressed concern that a restriction on Clean Water Act protections could “potentially affect vast portions of Wisconsin’s remaining waters and wetlands, some of them our most valuable and most endangered. Prairie potholes, wet meadows, many forested wetlands, ephemeral ponds, bogs, and fringing wetlands along small, nonnavigable ponds, are among the major categories of wetlands that would be at risk.”74 In particular, the agency estimated that limiting the law’s coverage of so-called isolated
waters would mean that approximately 1.1 million acres of Wisconsin wetlands would lose federal Clean Water Act protections.75 And the agency noted that the region’s wetlands served important functions in reducing nutrient
pollution: “A 1989 study has shown 70 percent removal rates of nitrogen from water entering prairie basin wetlands.”76
Illinois: The state Department of Natural Resources was greatly concerned about restricting Clean Water Act protections for nonnavigable waters because “[t]hese tributaries, wetlands, and nonnavigable streams are vital to the health of Illinois’ watersheds, and [it] requires the partnership of state and federal protection to prevent pollution, and to support the state’s efforts to achieve the no net loss of Illinois wetlands or their functional values....”77 The EPA regional office that covers Illinois reported that the “Illinois Natural History Survey estimated
that 150,118 acres of wetland[s] are at risk if ‘isolated’ wetlands are no longer regulated.”78
Iowa: The Iowa Department of Natural Resources reported that 11 to 72 percent of the state’s prairie pothole wetlands could be considered “isolated,” depending on the assumptions usedto label a water “isolated.”79 The
Department specifically noted that these resources were crucial to controlling nutrient pollution: “A large portion of these prairie pothole wetlands are located in the Des Moines River watershed. [EPA] studies suggest that this watershed is one of the largest contributors to hypoxia in the Gulf of Mexico. Nitrates from farming activities enter … drainage ditches and subsurface tiles, and are quickly transported to the Des Moines River. These converted wetlands that now exist on the landscape are no longer a nitrate sink, but instead now act as a source of nitrates for the Des Moines River watershed. We are very concerned that if prairie potholes are no longer regulated, this scenario will be repeated throughout the prairie pothole region.”80 Fens, a type of wetland where groundwater
flows to the surface, would likewise be imperiled. Of 2,333 historic fens in northeastern Iowa, only 160 remain.81
Missouri: The state Department of Conservation undertook a preliminary geographic analysis and “determined that approximately 660,000 acres (35 percent) of the 1,868,550 acres of wetlands in Missouri could be adversely affected by a restriction on the kinds of wetlands protected by the law. Major affected wetland types include wet meadows, river fringing wetlands along small nonnavigable rivers and streams, lake fringing wetlands for smaller nonnavigable lakes, many forested wetlands, old meander channels, oxbows, sloughs, fens, seeps and springs.”82
Kentucky: The state Department for Environmental Protection’s Division of Water reported that “[o]f Kentucky’s 89,000 total stream miles, we estimate that 49,000 miles are intermittent headwater streams”83 and
urged the EPA and the Corps not to radically rewrite their rules. The Department stressed that “Kentucky has no comparable state law that could replace the loss of CWA jurisdiction.”84
Tennessee: According to the Tennessee Wildlife Resources Agency, the state has some 787,000 acres of wetlands, the majority of which are not adjacent to navigable-in-fact waters.85
Arkansas: The Arkansas Game and Fish Commission strongly urged the EPA and the Corps to maintain broad protection for aquatic resources. The Commission noted that the state was rich in nonnavigable mountain streams, including many which begin in Karst topography, which move at times through bedrock, and which therefore do not appear to flow continuously.86 The Commission further observed that “[a]ll adjacent wetland[s] intercept
overland flows, and therefore protect the physical and chemical integrity of their streams by recycling nutrients, reducing sedimentation and erosion in streams, reducing flood peaks and draw downs, and providing carbon and other nutrients to aquatic food webs.”87
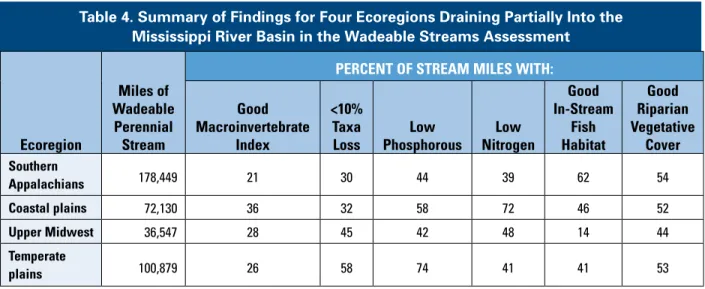
Table 4. Summary of Findings for Four Ecoregions Draining Partially Into the Mississippi River Basin in the Wadeable Streams Assessment
ecoregion
Miles of Wadeable
Perennial Stream
PeRCeNt Of StReaM MILeS WIth:
Good Macroinvertebrate
Index
<10% taxa
Loss PhosphorousLow NitrogenLow
Good In-Stream fish habitat Good Riparian Vegetative Cover Southern appalachians 178,449 21 30 44 39 62 54 Coastal plains 72,130 36 32 58 72 46 52 Upper Midwest 36,547 28 45 42 48 14 44 temperate plains 100,879 26 58 74 41 41 53
Water Resources Throughout the Mississippi River Basin have Been
Polluted or Destroyed
Headwaters
Headwater streams are susceptible to damage from changes to their watersheds. Cultivation, such as agricultural production, compacts the soil so that peak runoff volumes are higher. When disturbance to a headwater stream’s watershed causes runoff to frequently exceed the area’s absorption capacity, the streams’ rough streambed may become smoothed as a result. This smoothing can reduce the hyporheic zone and create faster water flow, so that nutrients are buffered less effectively. 88 Urbanization also leads to higher peak runoff volumes due to the
construction of paved and other impervious surfaces.
Available data suggest that this pattern plays out in the Mississippi Basin. Table 4summarizes findings from the EPA’s Wadeable Streams Assessment for four ecoregions that partially drain to the Mississippi River. Assessments such as “good” and “low” in this table represent comparisons with the least-disturbed streams in each ecoregion. The macroinvertebrate index and taxa loss assessments shown in the table are measures of biological health. In-stream fish habitat and good riparian vegetative cover are likewise indicative of stream disturbance and, by extension, water quality. Streams with excess phosphorus and/or nitrogen can be considered chemically stressed. (For each of the categories, a high number is desirable—it is good to have a greater percentage of streams with good macroinvertebrates and low nitrogen and phosphorus, for instance). This table shows that the small streams in each ecoregion commonly have red flags indicating human-caused stress and, potentially, lost aquatic functions.
Source: Data from 2004 sampling conducted by the U.S. Epa.89
Not only are streams degraded by human activity; sometimes they are obliterated. Entire lengths or parts of small streams can be destroyed by development and other construction. We do not know, frankly, how much this has occurred over time, as we lack reliable data even about the extent of headwater streams today. This makes it very difficult to describe historical losses. Topographical maps are the best source of information about the current extent of streams, but they have been found in some cases to not include many of these streams or to have incorrect information about them. For instance, two studies found that roughly 20 percent of the streams in an area of Appalachia appeared on USGS topographical maps. In one Georgia watershed, an analysis found that 40 to 60 percent of headwaters were not captured in topographical maps. 90 In the same vein, the EPA’s National
Hydrography Dataset (NHD), which is a digitized version of USGS maps intended to provide spatial data on surface waters, classified as perennial streams many aquatic resources that were not. When the EPA conducted its Wadeable Streams Assessment, it found that “[o]f the more than 1 million miles of estimated perennial length, almost 400,000 miles (34 percent) were found to be non-perennial or non-target in some other way (e.g., wetlands,
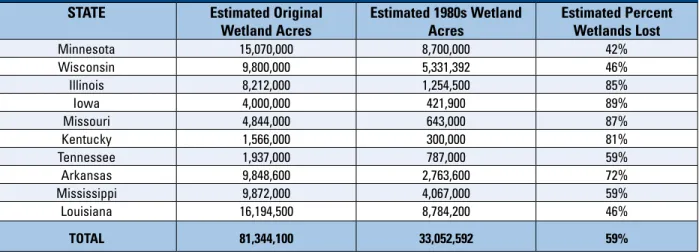
Table 5. Estimated Wetlands Acreage for the States Along the Main Stem of the Mississippi
State estimated Original
Wetland acres estimated 1980s Wetland acres estimated Percent Wetlands Lost
Minnesota 15,070,000 8,700,000 42% Wisconsin 9,800,000 5,331,392 46% Illinois 8,212,000 1,254,500 85% Iowa 4,000,000 421,900 89% Missouri 4,844,000 643,000 87% Kentucky 1,566,000 300,000 81% Tennessee 1,937,000 787,000 59% Arkansas 9,848,600 2,763,600 72% Mississippi 9,872,000 4,067,000 59% Louisiana 16,194,500 8,784,200 46% tOtaL 81,344,100 33,052,592 59% Wetlands
Wetlands are a critical resource for removing nutrient pollution, but only a fraction of the wetlands that existed in the United States prior to European colonization remain. According to one assessment, “[o]ver a period of 200 years, the lower 48 states lost an estimated 53 percent of their original wetlands.” 92 Based on this analysis, the
following table provides a summary of the estimated wetlands acreage for the states along the main stem of the Mississippi.
These estimates suggest that, within the main stem states, an area slightly less than the size of Iowa has been converted from wetlands.93 And as astonishing as these estimates are, they are quite uncertain. Actual records of
the extent of wetlands in colonial times were not kept. Indeed, there is reason to believe that in some states, these estimates may understate the amount of wetlands lost.
We compared an analysis of early surveyor records that sought to identify original wetlands acreage94 and a
Geographic Information System–based estimate of the extent of tile drainage for Iowa.95 The maps below display FIguRE 9: Comparing the Location of Precolonization Wetlands with Current
Tile Drainage Areas In Iowa
More than one half
More than one quarter to one half
More than one tenth to one quarter Less than one tenth
Extent of Precolonization Wetlands in Iowa Tile Drainage in Iowa Based on GIS-generated Estimates
Table 6. Pre-Colonization Wetland Extent Estimates and Tile-Drained Land Estimates
State Wetlands Lost from Precolonial era to 1980s,
in acres (Dahl 1990)
GIS-Based estimate of tile-Drained Land, in acres (adapted from Sugg, 2007)
Difference Between Prior estimate of Wetlands Lost and estimates Based on tile
Drainage
Iowa 3,578,100 8,811,940 5,233,840
Illinois 6,957,500 11,560,523 4,603,023
Ohio 4,517,200 5,736,342 1,219,142
Indiana 4,849,367 5,667,260 817,893
the data from these two sources, and despite the fact that they are separated by more than half a century and generated using wholly different techniques, the images look quite similar. This suggests that estimates of tile-drained land based on satellite data may provide a reasonable proxy for wetland losses in this Corn Belt state. Prior efforts to estimate wetlands acreage acknowledge the close relationship between tiling and wetlands loss; as one commonly cited report estimating the prior extent of U.S. wetlands observed, relying on agricultural drainage as an indicator of wetlands lost “is not unreasonable given that the vast majority of wetland losses have been due to agricultural conversion.”96 Indeed, because agricultural tile drainage is only one means of destroying a wetland—
that is, it does not reflect wetlands lost to urban expansion or transportation development—using tile drainage alone may underestimate wetlands losses.
If this relationship between current tile-drained land and past wetlands acreage holds true, then in four Mississippi Basin states (two along the Mississippi main stem)—Iowa, Illinois, Ohio, and Indiana—the tiling estimates suggest that the previously accepted value for original wetlands is low. That leads us to conclude that in these states even more wetlands may have been lost since colonization than previously believed.
The extent of tile drainage and related wetlands loss is intimately related to the dead zone problem. A very recent examination of gulf hypoxia by a panel of the EPA’s Science Advisory Board (SAB) concluded that “the upper Mississippi and Ohio-Tennessee River subbasins currently represent nearly all of the spring [nitrogen] flux to the gulf. These subbasins represent the tile-drained, corn-soybean landscape of Iowa, Illinois, Indiana, and Ohio and illustrate that corn-soybean agriculture with tile drainage leaks considerable [nitrogen] under the current management system.”97 Separately, the SAB underscored the relationship between wetlands and nutrient pollution
in the basin, noting that targeted wetlands restoration “is a particularly promising approach for heavily tile-drained areas like the Corn Belt.”98 The report noted that wetlands can be particularly effective at removing nitrogen when
concentrations are high and highlighted estimates that nitrogen loading to the gulf could be cut by approximately 20 percent if two million acres of wetlands were restored in the basin.
In light of the important environmental function of headwaters and wetlands, and in light of their historic destruction and degradation, it is vital to preserve as much as possible the existing resources and the natural function of the features that remain. One of the key legal tools to protect aquatic resources from pollution and filling is the federal Clean Water Act, which generally bans unpermitted discharges into water bodies and contains safeguards designed to limit the impact of discharges that are allowed. In the next section, we discuss the role of the law in protecting water bodies and examine the attacks that have raised questions about the extent to which the law may be used to protect many headwaters and wetlands.
B
y 1972, incredible problems beset the nation’s waters; rivers caught fire,
Lake Erie was declared “dead,”
and other events called out for immediate
action.
99,100“Record numbers of fish kills were reported in 1969. Over 41
million fish were killed, more than 1966 through 1968 combined, including the
largest recorded fish kill ever—26 million killed in Lake Thonotosassa, Florida, due to
discharges from four food-processing plants.”
101The Clean Water Act Brought Protections for America’s Waterways
In the face of these problems, Congress amended the Federal Water Pollution Control Act to significantly overhaul the way the country controlled water pollution. That legislation, now known popularly as the Clean Water Act, sought to replace existing law with a much tougher and more comprehensive solution. As part of this restructuring, Congress sought to apply the law’s new protections to a broad range of water bodies. The drafters addressed this by stipulating that numerous pollution control programs in the law would apply to “navigable waters,” a term borrowed from predecessor statutes, but then defining that term very broadly to mean “the waters of the United States, including the territorial seas.”102
Within two years of the new law, the Environmental Protection Agency and the Army Corps of Engineers issued regulations that sought to identify the water bodies that the law would protect. The agencies initially went in different directions: The Corps’ rules limited safeguards to waters that were actually navigable or could be made so,103 but the EPA’s regulations sought to protect waters much more broadly, without requiring particular water
bodies to be navigable in order to be covered by the law.104 The Corps’ restrictive approach was quickly eviscerated
in court; the judge reviewing the limited rules held that “Congress by defining the term ‘navigable waters’ in Section 502(7) of the Federal Water Pollution Control Act Amendments of 1972 to mean ‘the waters of the United States, including the territorial seas,’ asserted federal jurisdiction over the nation’s waters to the maximum extent permissible under the Commerce Clause of the Constitution. Accordingly, as used in the Water Act, the term is not limited to the traditional tests of navigability.”105