1
Does electricity consumption and globalization increase pollutant emissions?
Implications for environmental sustainability target for China
Seyi Saint Akadiri
aa International Economics and Management Department, Graduate School of Economics and
Management, Ural Federal University, Ekaterinburg, Russia.
Email: [email protected]
Andrew Adewale Alola
b, cb Faculty of Economics, and Administrative and Social Sciences, Istanbul Gelisim University,
Istanbul, Turkey.
c Department of Financial Technologies, South Ural State University, Chelyabinsk, Russia
Correspondent Author [email protected]
Festus Victor Bekun
d, ed Faculty of Economics, Administration and Social Science, Istanbul Gelisim University,
Istanbul, Turkey.
e Department of Audit, South Ural State University, Russia
Email: [email protected]
Mfonobong Udom Etokakpan
f, gf Faculty of Business and Economics, Department of Economics, Famagusta, Eastern
Mediterranean University, North Cyprus, via Mersin 10, Turkey.
g Economics Department, Babcock University, Ogun State, Nigeria.
2
Abstract:
Giving that China is one of the two new frontiers of globalization, the country has continued to contend with the bottleneck of sustaining its economic growth amidst environmental hiccups arising from the drawbacks of globalization and energy consumption. By investigating the challenges of the country’s drive toward environmental sustainability, the present study offers a new perspective on the role of electricity consumption and economic growth in a carbon-income function setting. This study also controls for omitted variables bias by the incorporating globalization as an additional variable for the experimental period of 1970-2014. Stationarity properties were ascertained by the Zivot and Andrew unit root test under a single structural break. Subsequently, the recent and novel combined cointegration test of Bayer and Hanck (2013) in conjunction with the Pesaran bounds testing approach is used to establish a cointegration relationship among the selected variables. Finally, the modified Wald test of the Toda-Yamamoto Granger causality test is employed to detect the direction of causality flows among the variables. Empirical piece of evidence finds a statistically positive correlation between electricity consumption and economic growth as seen in the long run regression. This result is also affirmed by the Granger causality test. The test corroborates with the electricity induced growth hypothesis in the case of China. However, there is an environmental trade-off, as more electricity consumption spur increased carbon dioxide emissions (CO2). Our study finds
empirical support that globalization reduced pollutant emissions in both the short and long run over our sampled period. Based on these results and outcomes, several policy prescriptions on the energy-income and environment nexus are renders for policymakers. Among such policy recommendations are (a) the need for the diversification of the Chinese energy mix to cleaner energy sources and renewables. (b) the need for decarbonization and adoption of carbon capturing and storage technologies.
Keywords: Globalization; electricity consumption; carbon emission; energy consumption; economic
3
1. Introduction
Although the effort of the world’s environmental experts and the intergovernmental organizations has intensified in the last decades, evidence has sustained the assertion that the persistent global threat to the environment and climate is one of the humans’ major challenges of the 21st century.
Not deterred, the United Nations Framework Convention on Climate Change (UNFCC)1, the
governing states of the world among other stakeholders have consistently been urged to show more commitment to the 2015 Paris Agreement2. Amidst this awareness and commitment, there has been a global increase in the pollutant emissions from the anthropogenic Greenhouse gas (GHG)emissions, Primary particulates, Acidifying gases, Ozone precursor gases, and other environmental sources of pollution. In the case of the carbon dioxide (CO2) emissions which
largely constitute the GHG emissions, the global energy-related CO2 emissions grew by 1.7% in
2018, thus posing a historic record of 33.1 gigatons (Gt) of equivalent CO2 (International Energy
Agency, IEA, 2019). According to the IEA report, the last year’s increase in the CO2 emissions
which is the highest since 2013 is linked to the robust global economy and the recent dynamics of the world degree days amidst higher energy consumptions. In the face of this, emissions decline has been reported for Germany, Japan, Mexico, France, and the United Kingdom while China, India and the United States reportedly accounted for 85% of the net increase in emissions in 2018 (International Energy Agency, IEA, 2019). Consequently, in the same year 2018, the CO2 emissions in the Republic of China grew by 230 Megatons (Mt) equivalent of CO2 (a growth rate of 2.5%).
1 The United Nations Framework Convention on Climate Change (UNFCC) is the United Nations organization that is
saddle with the global climate actions. Further information on UNFCCC is available at https://unfccc.int/.
2The Paris Agreement is the United Nations Framework Convention on Climate Change of 2015. More details relating
to the Paris Agreement of 2015 are available at: https://unfccc.int/process/conferences/pastconferences/ paris-climate-change-conference-november-2015/ Paris-agreement.
4
Accordingly, with a population of over 1.3 billion people (estimated at 1 ,384,688,986 in 2018 ) the Republic of China (35 00 N, 105 00 E) Chin a’s climatic condition is being described as extremely diverse and tropical from South sub arctic in the No rth (Central Intelligence Agency, C IA, 2 019). The increasing trend in the global climate change an d human activities has neith er helped Chin a’s economic development plans nor her co mmitment toward the mitigation of environmen tal and climate change hazards. The existence of global economic competitions especially among the leading economies such as China and the United States remains a stumbling block to the mitigation of global environmental disasters such as global warming. For instance, ever since China’s economy has continued to experience about 10% in average annual Gross Domestic Product (GDP) growth since it adopted a more market-based economy, thus making it the fasted sustained economic expansion of a major economy (The World Bank, 2019). According to the World Bank, China was also able to make a significant contribution to the global Millennium Development Goals (MDGs) achievements after achieving its own MDGs target in 2015. Indicatively, this impressive growth of the Chinese economy has not happened without causing environmental drawbacks. While induced energy consumption has been arguably attributed to the source of economic expansion and environmental challenge in previous years, the trend in globalization could as well not be ignored.
Considering the incessant global trade row among the world-leading economies resulting from market and trade globalization, it suffices to consider a wider approach to the underpinning of the pros and cons of globalization (Saint Akadiri, Alola & Akadiri, 2019; Saint Akadiri et al., 2019a). Regardless, globalization has provided the opportunity for countries to export goods and services with comparative advantage. Also, the Global Economic Dynamics suggests that countries significantly benefit from increased integration in the world economy since 1990, thus implying
5
that globalization has a positive impact on the GDP of both the advanced and emerging economies (Global Economic Dynamics, 2019). Adding to the challenges of the global integration of the market is the increasing dynamics in the energy market especially the electricity market. For instance, the increase from 230 Mt to 9.5 Gt CO2 emissions (2.5% growth) for China in 2018 is associated with a 5% increase in electricity generation from coal-power stations being utilized across the country (International Energy Agency, IEA, 2019). It means that as much as there is a drive for global integration of the market amidst global energy consumption and causing persistent demand on the natural and atmospheric environment, pollutant emissions are inevitable (Saint Akadiri, Bekun & Sarkodie, 2019; Saint Akadiri et al., 2019b).
In the face of the above motivations and the uniqueness of China due to the historical shift in the Asian’s energy consumption dynamics, the current study underpins the role of globalization and electricity consumption in China within the context of environmental pollution. While employing the experimental annual frequency data spanning over the period 1970-2014, the objective of the study is set at hypothesizing that (1) globalization is responsible for pollutant emissions in China, (2) electricity consumption causes pollutant emissions, and (3) there is dynamic and causal nexus between the variable of interest, the unobserved variables, and CO2. Regarding the novelty of the
current study, this study potnentially fill the gap in extant literature because the incorporation of globalization alongside electricity consumption into a carbon function is the first of it kind especially for the case of China. It is also interesting to add that China is uniquely characterized the market globalization frontier, thus making the country’s current trade row with the United States a fascinating case study.
The other sections of this study are arranged as follows. The extant literature underpinning the globalization and electricity consumption in the context of pollutant emissions is highlighted in
6
section 2. Section 3 presents the data and the empirical methodologies employed, while part 4 details and discusses the estimated results and findings. Section 5 concludes by providing policy implications and the direction for future study.
2
.Electricity Consumption and Globalization: An Environmental Perspective
In the wake of growing global concern on climate change, the perspective is the underpinning role of globalization in the context of environmental and pollutant emissions. Within the context of environmental sustainability, shred of literature has undoubtedly linked globalization pollutant emissions under carbon emissions, Greenhouse gas, and other environmental or anthropogenic gases (Meckling, 2011; Shahbaz et al., 2017; Ding, Ning & Zhang, 2018; Shahbaz, Shahzad & Mahalik, 2018; You & Lv, 2018; Saint Akadiri et al., 2019; Saint Akadiri, Alola & Akadiri, 2019; Shahbaz et al., 2019). An illustration from Saint Akadiri et al (2019) and Saint Akadiri, Alola and Akadiri (2019) suggested that globalization plays an important role in achieving environmental sustainability targets for Italy and Turkey respectively. For instance, Saint Akadiri et al (2019) opined that globalization is a mitigating factor of CO2 emissions. Hence the study suggests thatglobalization is responsible for inducing environmental quality vis-à-vis environmental sustainability in Italy in both the short-run and long-run. situations. But, while employing the Bayer-Hanck combined cointegration and the Autoregressive Distributed Lag (ARDL) techniques, Saint Akadiri, Alola, and Akadiri (2019) found a non-significant negative impact of globalization on CO2 emissions in Turkey.
Additionally, China’s globalization drive in the context of environmental sustainability was also highlighted by Shahbaz et al (2017) and Ding, Ning, and Zhang (2018). By using the same methodology as Saint Akadiri, Alola and Akadiri (2019), Shahbaz et al (2017) examined the Environmental Kuznets Curve (EKC) hypothesis in the context of environmental sustainability
7
and globalization for China. In the study, both the short-run and long-run were supported by the EKC hypothesis for China. In a like manner and irrespective of employing the overall index or sub-indices of globalization metrics, the investigators observed that globalization is responsible for the decline in CO2 emissions in China. Just like the perspective observed by Shahbaz et al
(2017), Ding, Ning, and Zhang (2018) employed the role of bilateral trade activities of China in the context of environmental feedback. By implication, the investigation revealed that China (the world’s largest exporter and second world largest importer) contributes massive CO2 emissions to
the annual global emissions. The study implies that the trade-carbon emissions nexus is likened to the trends of globalization and CO2 nexus.
Regarding energy-pollution emission nexus, shred of literature has applied disaggregation of primary energy from the perspective of several cases (Alola & Alola, 2018; Alola, Alola, & Saint Akadiri, 2019; Alola, Bekun & Sarkodie, 2019; Balcilar, Bekun & Uzuner, 2019; Bekun, Alola & Sarkodie, 2019; Bekun, Emir & Sarkodie, 2019; Emir & Bekun, 2019; Saint Akadiri et al., 2019; Saint Akadiri, Bekun & Sarkodie, 2019; Samu, Bekun & Fahrioglu, 2019). The veracity of the concept of energy is responsible for the subject’s linkage with a handful of macroeconomic, financial and socio, and welfare economics among others. By extension, extant literature has widely examined the linkage between energy consumption and the environment, a position that has been strongly upheld by intergovernmental organizations such as the UNFCCC.
However, the nexus of electricity consumption and environmental sustainability via carbon and GHG emissions were explored in the studies of Ou, Xiaoyu and Zhang, 2011 and Zhang et al., 2013). Ou, Xiaoyu, and Zhang (2011) examined the environmental and pollutant emission effects of electricity generation from the life-cycle energy consumption in China. In the study, Ou, Xiaoyu, and Zhang (2011) explored the Well-to-Meter (WTM) analysis module for the
Tsinghua-8
CA3EM model to examine the volume of GHG emissions from the electricity generated and supplied in the country. The investigation found that electricity generation intensified the GHG emissions in 2007 and that the intensity of GHG emissions will reduce by 2040 provided the country continues to implement the development of nuclear and renewable energy (such as its carbon capture and storage, CCS) programs. Similarly, Zhang et al (2013) opined that the high volume of CO2 emissions in China over decades is since electricity generation is mostly from coal
and its products. By employing the Logarithmic Mean Divisia Index (LMDI), Zhang et al (2013) also found that coal products are the main source of fuel for thermal power generation and account for 90% of CO2 emissions from electricity generation. The study further opined that CO2
emissions from electricity generation increased from 530.96 Mt in 1991 to 2393.02 Mt in 2009, thus informing that the country’s economic activities are largely dependent on electricity generation. Moving away from China, studies have equally shown the linkage between the environment in the context of pollutant emissions and electricity consumption (Cowan et al., 2014; Al-Mulali et al., 2019; Salahuddin et al., 2018; Balcilar, Bekun & Uzuner, 2019).
3. Data and Methodology
To investigate long and short-run relationships between economic growth (RGDP), electricity consumption (Elec), globalization index (Glo) and carbon dioxide emissions (CO2) in China, the
above-mentioned variables had their data sourced from the world bank indicators (www.databank.worldbank,org). The choices of variables under investigation is motivated based on the Sustainable Development Goals (SDGs) 7, 8, 13 and 17 of the United Nations, 2019. Electricity consumption (Elec)- Access to affordable electricity would help to increase substantially production of renewable energy. SDG 7 is crucial in achieving growth and preserving the environment.
9
Economic Growth (RGDP)- sustained economic growth is promoted by encouraging greater and higher levels of productivity plus innovation through technology. This will achieve full and productive employment for individuals willing and able to work (SDG 8).
Carbon dioxide emissions (CO2)- despite the daring consequences threatening the climate system
which is a global phenomenon, adequate measures is needed to lessen climatic related calamities using both political will and technological measures in the consumption and production of goods and services (SDG 13).
Globalization index (Glo)- ensure more interconnectedness through global partnership thereby fostering improved access to knowledge and technology which will birth innovation. This is important to attain sustainable growth and development (SGD17).
In investigating the relationship between variables of interest, annual frequency data spanning from 1970 to 2014 was used. In the bid to minimize the heteroscedasticity problem, the examined variables were used in their logarithmic form. CO2, RGDP, Elec and Glo are proxies used in the
study for ecological degradation, economic growth, electricity consumption, and globalization respectively. RGDP is measured in constant 2010 USD while CO2 is measured in metric tons per
capita. Elec is measured in kilowatt per hour and Glo is proxied by globalization index which comprises all the dimensions of globalization namely political, social and economic dimensions. This study will adopt the carbon functional form (see equation 1) that has since been augmented in the extant literature such as Soytas and Sari (2009), Bekun, Alola and Sarkodie (2019), Bekun, Emir and Sarkodie (2019), Alola (2019a), and Alola (2019b).
CO2 = f (Elec, Glo, RGDP) (1)
10
where α is a constant term and the β’s are slope parameters that need estimation.
The Bayer and Hanck (2013) combined cointegration techniques were employed to investigate possible long run-run interactions between the variables and the results confirmed using Pesaran et al. (2001) bounds testing technique. In the same vein, short-run interactions were investigated among the variables of interest.
The series of stationarity properties were investigated before the cointegration test. The conventional ADF and PP unit root tests were employed though with the major setback of not considering structural breaks. Hence, ZA (1992) test was employed to account for possible single structural breaks. Given the information on the order of the cointegration series, a more recent BH (2013) test and bounds testing approach is employed to examine the presence of cointegration among variables under consideration. Bayer and Hanck’s (2013) cointegration approach is composed of the following tests: error correction t-test of Banerjee et al. (1998), the error correction F-test of Boswijk (1994), Johansen (1991) and Engle and Granger (1987). The BH (2013) techniques have all the variables integrated at order one and collectively determine the test statistics for the earlier listed techniques. The null hypothesis of the BH test is no cointegration against the alternative of the presence of cointegration among the variables under consideration. Fisher’s equation is provided as follows:
(3)
(4) where PBDM, PBO, PJOH, and PEG stands for the significance levels of Banerjee et al. (1998), Boswijk (1994), Johansen (1991) and Engle and Granger (1987) respectively. Hence, should the computed Fisher (1932) statistic is greater than the critical values reported by the BH (2013) combined cointegration statistics, then the hypothesis of non-convergence is not accepted.
2[ln( EG) ( JOH)]
EGJOH P P
2[ln(( EG) ( JOH) ( BO) ( BDM) EGJO H BOBDM P P P P
11
The bounds testing technique was deployed to confirm the consistency and robustness of results in the presence of structural breaks. This technique describes the dynamic unrestricted error model by using the linear transformation that allows joining together the long and short-run dynamics without losing any information associated with the long run (Pesaran et al., 2001). Below is dynamic unrestricted error mode:
2 = + + + + ∑ 2 +
∑ + ∑ + ∑ + (5)
From equation (5) above, ∆ represent the first difference operator whereas ɛ denotes normally distributed residual term. Wald test was employed to investigate the cointegration interaction between the examined variables by imposing on the estimated coefficients certain limitations. Should the calculated F-statistic exceed the upper level, then the hypothesis of no cointegration among variables is failed to be accepted. Also, this study’s fitted model was exposed to diagnostic scrutiny to ensure normality and homoscedasticity and at the same time avoid serial correlation among the variables. The Cumulative Sum (CUSUM) and Cumulative Sum Squares (CUSUMsq) tests were also employed to ascertain the stability of the model. Lastly, the causality test was carried out to examine the directions of the flow of dynamic causal links among the variables under investigation.
This study further adopts the Toda-Yamamoto (1995) causality test basically for the reason of ascertaining the direction of causality having known that impact is different from causation. The Toda-Yamamoto test is outstanding in giving long-run information as well as allowing for augmented Granger causality (Karimo & Ogbonna, 2017). The cointegration characteristics and the integration series of models can not hinder this test from being carried out (Gokmenoglu &
12
Taspinar, 2018). The modified Wald stat (MWALD) is recommended by this test and it involves the estimation of VAR (k+dmax). Where dmax denotes maximum order of integration, while the optimal lag order is denoted by k. We apply the VAR (k+ dmax) comprising of carbon dioxide emissions, electricity consumption, globalization index, and economic growth. From the following the model can, therefore, be expressed as equation 6-9 respectively:
= + ∑ , + ∑ , + ∑ + ∑ + ∑ Ɣ + ∑ Ɣ + ∑ + ∑ + (6) = + ∑ + ∑ + ∑ , + ∑ , + ∑ Ɣ + ∑ Ɣ + ∑ + ∑ + (7) = + ∑ + ∑ + ∑ , + ∑ , ∑ Ɣ + ∑ Ɣ + ∑ + ∑ + (8) = + ∑ + ∑ + ∑ + ∑ + ∑ Ɣ + ∑ Ɣ + ∑ , + ∑ , + (9)
4. Results Interpretation and Discussion
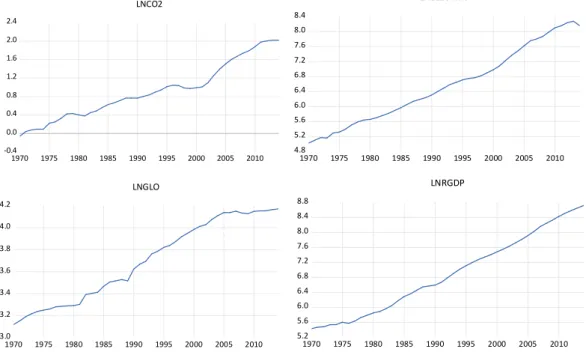
This section renders the results and discussion of all simulations. In the econometrics literature, the first point of call in data analysis is the graphical plot. The present study follows this sequence. Figure 1 provides the line plots of the individual variables whereas Figure 2 presents combined graphical plots of the series under review. There is an obvious upward trend in terms of energy
13
(electricity) consumption, carbon dioxide emission, globalization and economic growth over the entire sampled period. This implies that more energy (electricity) consumption translates into increase economic growth (Kraft and Kraft, 1978.) The dimensions of globalization are the social, political and economic impact on economic growth. However, the trends among these variables have environmental implications as all the variables trend together (see Fig 2). This is a call for environmental and energy economists to decouple economic growth from increasing CO2
emissions. Thus, the need for more econometrics is critical to validate or refute the itemized trend.
-0.4 0.0 0.4 0.8 1.2 1.6 2.0 2.4 1970 1975 1980 1985 1990 1995 2000 2005 2010 LNCO2 4.8 5.2 5.6 6.0 6.4 6.8 7.2 7.6 8.0 8.4 1970 1975 1980 1985 1990 1995 2000 2005 2010 LNELECTRIC 3.0 3.2 3.4 3.6 3.8 4.0 4.2 1970 1975 1980 1985 1990 1995 2000 2005 2010 LNGLO 5.2 5.6 6.0 6.4 6.8 7.2 7.6 8.0 8.4 8.8 1970 1975 1980 1985 1990 1995 2000 2005 2010 LNRGDP
Figure 1: Graphical plot of , , and
-2 0 2 4 6 8 10 1970 1975 1980 1985 1990 1995 2000 2005 2010 LNCO2 LNELECTRIC LNRGDP LNGLO
14
Figure 2: Combined Graphical plot of , , and
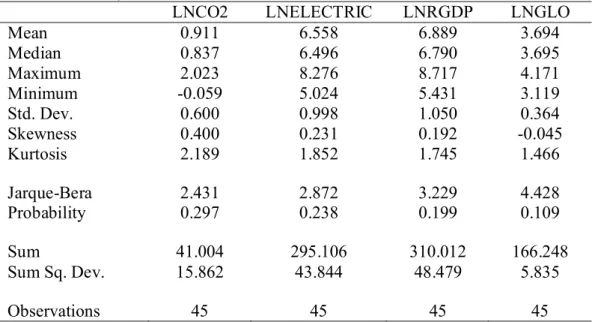
This study proceeds to investigate the basic summary statistics of the variables under consideration. The basic summary statistics renders the averages, maximum, minimum as well as provides details on the data peaks and symmetry of the data. Figure 1 shows that economic growth depicts the highest mean with carbon dioxide emission (CO2) with the lowest mean. All series
revealed to have a large departure from their means and are reveals by the standard deviation. Implying high volatility among all series. Similarly, all series are normally distributed as reported by the Jarque Bera probability statistics.
Table 1: Summary statistics
LNCO2 LNELECTRIC LNRGDP LNGLO
Mean 0.911 6.558 6.889 3.694 Median 0.837 6.496 6.790 3.695 Maximum 2.023 8.276 8.717 4.171 Minimum -0.059 5.024 5.431 3.119 Std. Dev. 0.600 0.998 1.050 0.364 Skewness 0.400 0.231 0.192 -0.045 Kurtosis 2.189 1.852 1.745 1.466 Jarque-Bera 2.431 2.872 3.229 4.428 Probability 0.297 0.238 0.199 0.109 Sum 41.004 295.106 310.012 166.248 Sum Sq. Dev. 15.862 43.844 48.479 5.835 Observations 45 45 45 45
Source: Authors Computation.
In the econometrics literature, it is pertinent to examine the stationarity properties of the variables needed for econometrics modeling. This is necessary to ascertain the data asymptotic and maximum order of integration and avoidance of modeling variables integrated of order 2. Thus, this study adopted the Zivot and Andrews (1992) unit root test that accommodates a single structural break as presented in Table 2. All variables were non-stationary at level form. However,
15
after the first difference, they become all stationary at (p < 0.01) significant level. This implies that for the sample period electricity consumption, globalization, CO2 emissions, and economic
growth are integrated of order 1. Subsequently, given the level of integration, the need to investigate the cointegration properties of the variables under review becomes necessary.
Table 2: Zivot and Andrews (1992) structural break unit root test
Variables At level At Δ
T-stat Break T-stat Break
-2.589 (1) 2002 -6.724*** (1) 1977
-1.601 (1) 2002 -7.151*** (1) 2009
-2.620 (1) 1987 -7.615*** (1) 1994
-3.746 (1) 1983 -6.665*** (1) 1985
Note, *** depicts variables significance at 0.01 percent level. Δ represents the first difference.
The recent and novel Bayer and Hanck (2013) combined the cointegration test in conjunction with the Pesaran Bounds testing procedure as rendered in Tables 3 and 4 respectively. Both cointegration tests are in harmony with establishing a cointegration relationship among the variables. For instance, in Tables 3 all fitted models rejected the null hypothesis of no cointegration at (p < 0.05) statistical rejection level. The results of ARDL bounds testing corroborates the Bayer and Hanck test of cointegration.
Table 3: Bayer and Hanck cointegration test results
Estimated Models EG-JOH-BO-BDM Critical Values Cointegration
= ( ) 33.773** 21.931 Cointegrated
= ( , ) 29.335** 21.106 Cointegrated
= ( , , ) 21.078** 20.486 Cointegrated
For the record the ** signifies statistical significance at 0.05 level.
Table 4: F-Bounds test results
F-Bounds Test Null Hypothesis: No levels relationship
Test Statistic Value Significance I(0) I(1)
16 Asymptotic: n=1000 F-statistic 7.198*** 10% 2.37 3.2 k 3 5% 2.79 3.67 2.50% 3.15 4.08 1% 3.65 4.66
For the record the *** signifies statistical significance at all levels
Table 5 reports the magnitude of the long-run equilibrium relationship between the variables by simultaneously reporting the short and long-run coefficients. Table 5 shows that the ECM is − 0.430 and it’s statistically different from zero at the (p < 0.01) statistical rejection level. Thus, suggesting that the ECM significant easily passing the 1% significance rejection level. This suggests that environmental degradation measure by (CO2) converges to its long-run equilibrium
path by about 43.0% through the channels of economic growth, globalization and electricity consumption.
Table 5: Short- and Long-run ARDL (1, 0, 0, 0) results Dependent Variable =
ln
CO
2
tShort-run results
Regressors Coefficient T-stat. p-Value
0.428** 4.993 0.000 0.473*** 2.374 0.022 -0.363*** -2.829 0.007 tan Cons t -0.779*** -4.656 0.000 1 t
ECM
-0.430*** -6.307 0.000 2 R R2-Adjusted 0.997 0.997 . Fstat 2880.294*** 0.000 Long-run resultsRegressors Coefficient T-stat. p-Value
Δ 0.995*** 6.070 0.000
Δ -0.102 -0.543 0.589
Δ -0.845*** -4.264 0.000
tan
Cons t -1.811*** -6.373 0.000
17
Tests F-stat p-Value
Normality 0.545 0.761
Serial Correlation 1.638 0.151
Heteroskedasticity 1.026 0.416
Note *** and ** depicts significance at 0.01 and 0.05 percent level.
We observe a positive statistical and inelastic relationship between electricity consumption and CO2 emissions. That is, a 1% increase in electricity consumption translates into 0.428% and
0.995% increase in CO2 emission in the short and long run respectively. This implies that the
increase in electricity consumption has a deteriorating impact on the environment in China. This finding is consistent with the study of Samu et al. (2019) for the case of Zimbabwe and Shahbaz et al. (2017) for the Portuguese economy. This is indicative of environmentalists and energy economists gave that China is on her growth trajectory. A similar positive pattern is observed between economic growth and environmental degradation. That is, as an economy grows there is a trade-off for the quality of the environment in China in both the short and long run as reported in Table 5. This implies that the Chinese economy plays more attention to its economic growth on its growth path with less emphasis on the quality of the environment. This pattern is mostly seen among developing and transition economies as outlined by Shahbaz and Sinha (2019). This is consistent with the well-know EKC phenomenon though in our study’s there exist a linear positive pattern. Thus, the need for policymakers and environmental economists in China to adopt new environmental technologies for reduced greenhouse gas mainly aggravated by CO2 emissions. The
position of adopting new and green technologies is also advocated in the study of Emir and Bekun (2019) conducted for Romanian. Interestingly, we observe that the wave of globalization in both the short and long-run has a desirable impact on CO2 emissions. In terms of magnitude, a 1%
increase in globalization wave decreases CO2 emissions by 0.363% and 0.845% in the short and
18
This position is also consistent in the recent study of Akadiri et al (2019) for Turkey and Shahbaz et al (2017) for China and further align with the findings of Shahbaz, Khan, Ali & Bhattacharya (2017) for China, stressing that globalization is inversely related with carbon emissions. Since globalization allows for the transfer of technology and development across borders, this account for the adoption of modern techniques in the production processes hence combating pollution and reducing carbon dioxide emission in China. This call for more interconnected between the Chinese government and the rest of the world though with a consciousness of its environmental implications.
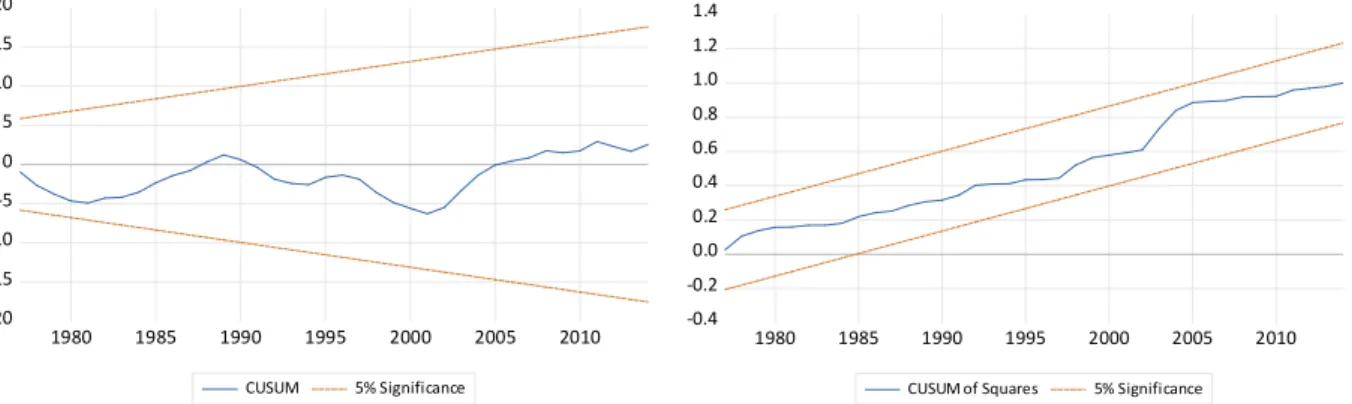
The model diagnostic test passes all test statistics satisfactorily; the normality test, serial correlation test, and heteroscedasticity test reported at the bottom of Table 5. Also, the stability of the model is investigated via the CUSUM and CUSUM square test as reported in Figure 3. Thus, implying that the model is robust and coefficients are consistent. As such, the model can be used for policy direction.
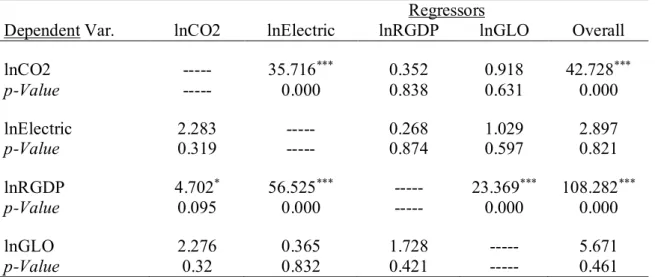
The Toda-Yamamoto Granger causality is used to detect the direction of causality flow among the variables.
Table 6: Toda-Yamamoto (1995) Granger Causality results
Regressors
Dependent Var. lnCO2 lnElectric lnRGDP lnGLO Overall
lnCO2 --- 35.716*** 0.352 0.918 42.728*** p-Value --- 0.000 0.838 0.631 0.000 lnElectric 2.283 --- 0.268 1.029 2.897 p-Value 0.319 --- 0.874 0.597 0.821 lnRGDP 4.702* 56.525*** --- 23.369*** 108.282*** p-Value 0.095 0.000 --- 0.000 0.000 lnGLO 2.276 0.365 1.728 --- 5.671 p-Value 0.32 0.832 0.421 --- 0.461
19
Table 6 shows a one-way Granger causality between electricity consumption and economic growth in China. That is, electricity consumption contemporaneous and past realizations of electricity data serve as a better and good indicator for economic growth over the investigated period. This result resonates with the findings of Shahbaz et al. (2017) for the Portuguese economy and also the more recent study of Bekun and Agboola (2019) in the case of Nigeria and Samu et al. (2019) for Zimbabwe. This outcome gives credence to the electricity led growth hypothesis. This implies that the Chinese economy is energy-dependent and measures to cut down or apply the energy conservative policies will hurt economic growth in no small measure. These outcomes leave policymakers and energy specialists in China with options for energy diversification of her energy source. A further piece of empirical evidence shows unidirectional causality running from electricity consumption to CO2 emissions and from CO2 emission to economic (GDP). These
results have far-reaching implications. For instance, the one-way causality from electricity consumption of CO2 indicates that energy consumption, in turn, spurs environmental degradation.
This position is further strengthened by the CO2 induced economic growth causality also observed.
Interestingly from our empirical analysis is the fact that the wave of economies interconnectedness (globalization) spur economic growth. This is insightful, as more global ties among nations are encouraged in terms of both tradable goods, this, in turn, hurts economic prosperity.
-20 -15 -10 -5 0 5 10 15 20 1980 1985 1990 1995 2000 2005 2010 CUSUM 5% Significance -0.4 -0.2 0.0 0.2 0.4 0.6 0.8 1.0 1.2 1.4 1980 1985 1990 1995 2000 2005 2010 CUSUM of Squares 5% Significance
20
5. Conclusion and Policies
In this study, we present a new perspective on the energy (electricity) consumption induced growth literature by empirically investigating the role of electricity consumption and economic growth in a carbon-income function setting. This study also controls for omitted variables bias by the incorporation of globalization as an additional variable. Annual time-series data from 1970-2014 was used for the econometrics analysis. Stationarity properties were ascertained by the Zivot and Andrew unit root test under a single structural break. Subsequently, the recent and novel combined cointegration test of Bayer and Hanck (2013) in conjunction with the Pesaran bounds testing approach is used to establish cointegration relationship among the selected variables, while the modified Wald test of Toda-Yamamoto Granger causality test is employed to detect the direction of causality flows among the variables.
The current study underpins the role of globalization and electricity consumption in China within the context of environmental pollution. Based on the study empirical results, the following conclusions are made (a) that globalization has a negative and significant impact on pollutant emissions both in the short- and long-run. This implies that globalization enhances the reduction in carbon dioxide emissions, thereby minimizes the rate of environmental degradation in China both in the immediate and in the future. (b) that electricity consumption has positive and significant impact on pollutant emissions both in the short- and long-run (c) that real income has positive and significant impact on pollutant emissions in the long-run and insignificant in the short-run, and (d) Lastly, there is an existence of a long-run dynamic causal nexus between the variables of interest in the case of China.
21 5.1 Economic-policy Implication
From the economic and policy standpoint, the fact that electricity consumption and economic growth increase carbon emission whereas globalization reduces carbon emissions calls for urgent intervention from the policymakers to develop and utilize a better mix of energy sources due to the economic and enviornmental effect of electricity consumption and economic growth from carbon dioxide emissions. Economic growth in itself involves more efficient use of inputs which is desirable. However, policy implication for the Chinese economy is that more or sustained economic growth would require efficient electricity consumption (Kraft and Kraft, 1978). So, China with the globalization advantage and benefit should adopt the multi-pronged policy of increasing investment in energy infrastructure to widen the energy resources base, then take the initiative to reform the regulations that ensure robust energy infrastructure and ensure efficiency by putting in place energy conservative policies. Secondly, there is a need for policymakers to ascertain and switch electricity consumption from sources that increase carbon dioxide emissions to alternatives with lesser or no dire environmental consequences so that sustainability in the environment can be achieved in the long-run even while maximizing economic growth. Also, we propose that the government and policymakers in charge of environmental policy in China should incorporate globalization as a “policy tool while designing and formulating energy and environmental policies geared towards improving and sustaining environmental quality both in the short- and long-run. Otherwise, the Chinese economy may persistently have to face the dare consequences of unpleasant global warming and climate change that would impact on both human and animals in the long-run. Interestingly, China is uniquely characterized by the market globalization framework also with the country’s current trade row with the United States. Electricity consumption and real income are linked to environmental degradation (pollutant
22
emissions). These variables positively impact on pollutant in the long-run. Chinese economy uses energy (electricity) for production/consumption, hence economic activities to enhance its economic growth, however, an increase in production/consumption, via economic activities is achieved at the expense of a cleaner environment for both the immediate and future generation. Thus, we suggest that the Chinese government should switch production activities and energy source available for consumption from non-renewable production/consumption technologies to renewable and energy-saving technologies, if any meaningful environmental sustainability targets is to be achieved that would promote cleaner and sustainable environment, and alongside reduce pollution and promote sound environmental quality for both the immediate and the future generation.
Finally, although this study has empirically examined the impacts of globalization and electricity consumption on pollutant emissions in China. We also suggest that future studies should examine the linkage between globalization, renewables, and non-renewable energy source by incorporating economic growth drivers either in a time series or panel-based empirical analysis. Consequently, a new global-energy-income policy framework to energy and environmental sustainability proposition would emerge in energy and environmental economic study.
23
References
Alola, A. A. (2019a). The trilemma of trade, monetary and immigration policies in the United States: Accounting for environmental sustainability. Science of The Total Environment, 658, 260-267.
Alola, A. A. (2019b). Carbon emissions and the trilemma of trade policy, migration policy and health care in the US. Carbon Management, 10(2), 209-218.
Alola, A. A., & Alola, U. V. (2018). Agricultural land usage and tourism impact on renewable energy consumption among Coastline Mediterranean Countries. Energy & Environment,
29(8), 1438-1454.
Alola, A. A., Alola, U. V., & Saint Akadiri, S. (2019). Renewable energy consumption in Coastline Mediterranean Countries: impact of environmental degradation and housing policy.
Environmental Science and Pollution Research, 1-13.
Alola, A. A., Bekun, F. V., & Sarkodie, S. A. (2019). Dynamic impact of trade policy, economic growth, fertility rate, renewable and non-renewable energy consumption on ecological footprint in Europe. Science of The Total Environment, 685, 702-709.
Al-Mulali, U., Tang, C. F., Tan, B. W., & Ozturk, I. (2019). The nexus of electricity consumption and economic growth in Gulf Cooperation Council economies: evidence from non-stationary panel data methods. Geosystem Engineering, 22(1), 40-47.
Balcilar, M., Bekun, F. V., & Uzuner, G. (2019). Revisiting the economic growth and electricity consumption nexus in Pakistan. Environmental Science and Pollution Research, 26(12), 12158-12170.
Bekun, F. V., Alola, A. A., & Sarkodie, S. A. (2019). Toward a sustainable environment: Nexus between CO2 emissions, resource rent, renewable and nonrenewable energy in 16-EU countries. Science of the Total Environment, 657, 1023-1029.
24
Bekun, F. V., Emir, F., & Sarkodie, S. A. (2019). Another look at the relationship between energy consumption, carbon dioxide emissions, and economic growth in South Africa. Science of
the Total Environment, 655, 759-765.
Bekun, F. V., & Agboo la, M. O. (2019). Electricity Consumption and Economic Gro wth Nexu s: Evidence from Maki Coin teg ration. Engin eering Economics, 30 (1), 14-23.
British Petroleum, BP (2018). BP statistical review of world energy. 2018. Available from:https://www.bp.com/en/global/corporate/energy-economics/statistical-review-of-world-energy/downloads.html. Retrieved 10 July 2019.
Cen tral Intelligence Agency, C IA (2019). https://www.cia.gov/library/publications/the-world-factbook/geos/ch.html. Retrieved 10 July 2019.
Cowan, W. N., Chang, T., Inglesi-Lotz, R., & Gupta, R. (2014). The nexus of electricity consumption, economic growth and CO2 emissions in the BRICS countries. Energy Policy,
66, 359-368.
Ding, T., Ning, Y., & Zhang, Y. (2018). The contribution of China’s bilateral trade to global carbon emissions in the context of globalization. Structural Change and Economic Dynamics, 46, 78-88.
Emir, F., & Bekun, F. V. (2019). Energy intensity, carbon emissions, renewable energy, and economic growth nexus: new insights from Romania. Energy & Environment, 30(3), 427-443.
Gokmenoglu, K. K., & Taspinar, N. (2018). Testing the agriculture-induced EKC hypothesis: the case of Pakistan. Environmental Science and Pollution Research, 25(23), 22829-22841.
25
Global Economic Dynamics (2019). The pros and cons of globalization. https://ged-project.de/allgemein-en/the-pros-and-cons-of-globalization/. Retrieved 10 July 2019. International Energy Agency, IEA (2019). Global Energy and CO2 Status Report.
https://www.iea.org/geco/emissions/. Retrieved 13 July 2019.
Karimo, T., & Ogbonna, O. (2017). Financial deepening and economic growth nexus in Nigeria: Supply-leading or demand-following? Economies, 5(1), 4.
Kraft, J., & Kraft, A. (1978). On the relationship between energy and GNP. The Journal of Energy
and Development, 401-403.
Meckling, J. (2011). The globalization of carbon trading: transnational business coalitions in climate politics. Global Environmental Politics, 11(2), 26-50.
Ou, X., Xiaoyu, Y., & Zhang, X. (2011). Life-cycle energy consumption and greenhouse gas emissions for electricity generation and supply in China. Applied Energy, 88(1), 289-297. Saint Akadiri, S., Alkawfi, M. M., Uğural, S., & Akadiri, A. C. (2019b). Towards achieving
environmental sustainability target in Italy. The role of energy, real income and globalization. Science of The Total Environment, 671, 1293-1301.
Saint Akadiri, S., Alola, A. A., & Akadiri, A. C. (2019). The role of globalization, real income, tourism in environmental sustainability target. Evidence from Turkey. Science of The Total
Environment.
Saint Akadiri, S., Alola, A. A., Akadiri, A. C., & Alola, U. V. (2019a). Renewable energy consumption in EU-28 countries: policy toward pollution mitigation and economic sustainability. Energy Policy, 132, 803-810.
26
Saint Akadiri, S., Bekun, F. V., & Sarkodie, S. A. (2019). Contemporaneous interaction between energy consumption, economic growth and environmental sustainability in South Africa: What drives what? Science of The Total Environment, 686, 468-475.
Salahuddin, M., Alam, K., Ozturk, I., & Sohag, K. (2018). The effects of electricity consumption, economic growth, financial development and foreign direct investment on CO2 emissions in Kuwait. Renewable and Sustainable Energy Reviews, 81, 2002-2010.
Samu, R., Bekun, F. V., & Fahrioglu, M. (2019). Electricity consumption and economic growth nexus in Zimbabwe revisited: fresh evidence from Maki cointegration. International
Journal of Green Energy, 16(7), 540-550.
Shahbaz, M., Khan, S., Ali, A., & Bhattacharya, M. (2017). The impact of globalization on CO2 emissions in China. The Singapore Economic Review, 62(04), 929-957.
Shahbaz, M., Mahalik, M. K., Shahzad, S. J. H., & Hammoudeh, S. (2019). Testing the globalization-driven carbon emissions hypothesis: international evidence. International
Economics, 158, 25-38.
Shahbaz, M., Benkraiem, R., Miloudi, A., & Lahiani, A. (2017). Production function with electricity consumption and policy implications in Portugal. Energy Policy, 110, 588-599. Shahbaz, M., & Sinha, A. (2019). Environmental Kuznets curve for CO2 emissions: a literature
survey. Journal of Economic Studies, 46(1), 106-168.
Shahbaz, M., Shahzad, S. J. H., & Mahalik, M. K. (2018). Is globalization detrimental to CO 2 emissions in Japan? New threshold analysis. Environmental Modeling & Assessment,
23(5), 557-568.
Toda, H. Y., & Yamamoto, T. (1995). Statistical inference in vector autoregressions with possibly integrated processes. Journal of econometrics, 66(1-2), 225-250.
27
The Paris Agreement (2015). https://unfccc.int/process/conferences/pastconferences/ paris-climate-change-conference-november-2015/ Paris-agreement. Retrieved 13 July 2019.
The Wo rld Ban k (2019). The World Bank in China.
https://www.worldbank.org/en/country/china/overview. Retrieved 10 July 2019.
United Nations Framework Convention on Climate Change (UNFCC). https://unfccc.int/. Retrieved 13 July 2019.
You, W., & Lv, Z. (2018). Spillover effects of economic globalization on CO2 emissions: a spatial panel approach. Energy Economics, 73, 248-257.
Zhang, M., Liu, X., Wang, W., & Zhou, M. (2013). Decomposition analysis of CO2 emissions from electricity generation in China. Energy policy, 52, 159-165.