The Role of Electricity Consumption, Globalization and Economic Growth in
Carbon Dioxide Emissions and its Implications for Environmental
Sustainability Targets
Seyi Saint Akadiri
a
International Economics and Management Department, Graduate School of Economics and Management, Ural Federal University, Ekaterinburg, Russia.
b
College of Business, Westcliff University, Irvine, California, United States. Correspondent Author: [email protected]
Andrew Adewale Alola
Department of Financial Technologies, South Ural State University, Chelyabinsk, Russia. Email: [email protected]
Godwin Olasehinde-Williams
Faculty of Business and Economics, Department of Economics, Famagusta, Eastern Mediterranean University, North Cyprus, via Mersin 10, Turkey.
Email: [email protected]
Mfonobong Udom Etokakpan
Faculty of Business and Economics, Department of Economics, Famagusta, Eastern Mediterranean University, North Cyprus, via Mersin 10, Turkey.
Economics Department, Babcock University, Ogun State, Nigeria. Email: [email protected]
Abstract
In spite of increased awareness and commitment to climate change, the world is yet to witness a dramatic downturn of pollutant emissions. With the strategic geographical location of Turkey and the country’s energy and environmental degradation challenges, this study therefore attempts to investigate the linkages among carbon emissions, electricity consumption, economic growth and globalization in Turkey over the period 1970-2014. The posit a more robust interpretation within a multivariate arrangement by employing several econometric techniques such as the Bayer and Hanck (2013) cointegration procedure, the ARDL bounds testing approach to cointegration, ARDL short-run and long-run estimations, and the Toda-Yamamoto Granger causality testing. From our findings, the policy variables relevant to pollution reduction in Turkey are electricity consumption and economic growth, and the common factor to these policy variables is fossil fuel consumption. There is no statistical indication that globalization impacts carbon emissions in Turkey. Our findings have the following important policy implications for Turkey and other countries with high records of carbon emissions; (i) the so-called fossil fuel capitalism needs to be overhauled, and a switch to low carbon, eco-friendly, energy mix content is required, (ii) renewable energy sources should be prioritized, (iii) adoption of electric vehicles not as complements to internal combustion engine vehicles but as substitutes should be encouraged, (iv) levying of environmentally sensitive taxes and subsidies should be intensified, and (v) better participation in the global drive for decarbonization should be encouraged. In summary, we advocate extensive planning and financing, and coordinated action across economic sectors and various stakeholders to achieve a low-carbon energy system.
Keywords: Globalization; electricity consumption; carbon emission; energy consumption; economic growth; Turkey.
1. Introduction
Despite the awareness of climate change and the commitment to its control, the world is yet to witness a dramatic downturn in global pollutant emissions such as anthropogenic greenhouse gases (GHGs), primary particulates, acidifying gases, ozone precursor gases and other environmental sources of pollution. Although the world’s environmental experts and intergovernmental organizations have intensified awareness of global warming among other elements of climate change over the past few decades, evidence has sustained the assertion that the persistent global threat to the environment and climate remains a major challenge of humans in the 21st century (Alola, 2019a, 2019b; Alola, Alola & Saint Akadiri, 2019; Bekun, Alola & Sarkodie, 2019; Bekun, Emir & Sarkodie, 2019).
Carbon dioxide (CO2) emissions that form the largest component of the GHG emissions is
reported by the International Energy Agency (IEA, 2019) to have increased by 1.7% in 2018, thus suggesting a historic record of 33.1 giga tons (Gt) of equivalent CO2. The IEA report further
informs that the previous year’s increase in the CO2 emissions which is the highest since 2013 is
associated with the robust global economic output and the recent dynamics of the world degree days amidst higher energy consumptions. Hence, the United Nations Framework Convention on Climate Change (UNFCC)1 in collaboration with other stakeholders has consistently encouraged more commitment to the 2015 Paris Agreement2 especially by state actors.
1 The United Nations Framework Convention on Climate Change (UNFCC) is the United Nations organization that
is saddle with the global climate actions. Further information on UNFCCC is available at https://unfccc.int/.
2 The Paris Agreement is the United Nations Framework Convention on Climate Change of 2015. More details
relating to the Paris Agreement of 2015 are available at: https://unfccc.int/process/conferences/pastconferences/ paris-climate-change-conference-november-2015/ Paris-agreement.
With regards to emission trends, some advanced economies such as Germany, Japan, Mexico, France and the United Kingdom have reportedly experienced declines in carbon emissions in recent times, while China, India and the United States have accounted for 85% of the net increase in emissions in 2018 (IEA, 2019). Turkey, due to its unique position as the fastest-growing Organization for Economic Co-operation and Development (OECD) economy, ranks as the twentieth largest emitter in the world. Although since 2008, Turkey has successfully decoupled its economic growth to a relative extent from air emissions, energy consumption and waste generation, the country’s high reliance on fossil fuels however still persistently hinders its drive for improved environmental quality (OECD, 2019).
Given that the Republic of Turkey (39 00 N, 35 00 E and estimated population of 81, 257, 239) is a temperate region with hot and dry summers and mild wet winters, the likelihood of environmental hazard resulting from pollutant emission is tangible. In the age of global economic competitions especially among the emerging economies such as Turkey, the commitment to the mitigation of global environmental disaster such as the global warming remains a major dilemma.
Turkey’s energy demand continues to grow rapidly and its rising energy needs continue to be met via fossil fuel consumption, particularly through burning of coal for electricity generation. Specifically, electricity consumption in Turkey in 2018 was reported to have experienced a growth of 303.2 billion kilowatts per hour, thus suggesting a forecast growth to 357.4 terawatts per hour (about 5.5% increase) by 2023 (Enerji, 2019). In addition, electricity consumption indexes for Turkey indicates that 37.3% of electricity production in 2018 was obtained from coal, while natural gas, hydropower, wind, solar, geothermal and other sources jointly produced 29.8%, 19.8%, 6.6%, 2.6%, and 2.5% in the same year (Enerji, 2019). This quantification of
electricity production is spread across the country’s existing power plants with 653 hydraulic, 42 coal, 249 wind, 48 geothermal, 320 natural gas, 5868 solar, and 243, thus making a total of 7423 at the end of 2018.
Being a net oil and gas exporter, and having expectedly built a competitive gas market over time, the resulting effect and role of globalization in the context of environmental challenges is expected to be a worthwhile investigation. Indicatively, the recent trends in market and trade globalization, especially its pros and cons, have been associated with environmental challenges (Saint Akadiri, Alola & Akadiri, 2019; Saint Akadiri et al., 2019b). In spite of this, the Global Economic Dynamics (2019) suggests that countries continue to benefit from increasing economic integration since 1990, thus suggesting that globalization have positive impact on the GDP of both the advanced and emerging economies.
Considering the above motivations and to further contribute to the studies of Saint Akadiri, Alola and Akadiri (2019) and Saint Akadiri et al. (2019a), the current study underpins the role of electricity consumption and globalization in Turkey. By employing annual frequency data spanning the period 1970-2014, the objective of the study is presented in the hypotheses framework that (i) electricity consumption increases pollutant emissions in Turkey, (ii) globalization is responsible for pollutant emissions in Turkey, and (iii) there is dynamic and causal nexus among electricity consumption, globalization and CO2 emissions in Turkey. In so
doing, this study is billed to close the existing gap in the extant studies of Dogan (2015), Ozcan (201), Saint Akadiri, Alola and Akadiri (2019), and Khan, Teng and Khan (2019) by mainly examining the impact of globalization and electricity consumption on environmental pollution in Turkey. The geographical location of Turkey (39 00 N, 35 00 E) as a connecting axis to four different continents make good the context of market globalization framework to audience. In
addition, a robust interpretation can be inferred from the combined implementation of the econometric techniques such as the Bayer and Hanck (2013) cointegration procedure, the ARDL bounds testing approach to cointegration, ARDL short-run and long-run estimations, and the Toda-Yamamoto Granger causality testing.
The remaining sections of this study are presented as follows; section 2 reviews relevant literature, section 3 presents the data and empirical methodologies employed, section 4 provides and explains the results as well as compares them with previous findings, and section 5 concludes the study by highlighting the policy implication and direction for further study.
2. Literature Review
In general, numerous studies have been conducted on the nexus of globalization and environmental quality. Specifically, the link between globalization and pollutant emissions vis-a-vis carbon emissions, greenhouse gas and other environmental or anthropogenic gases has been contextualized for Turkey (Destek & Ozsoy, 2015; You & Lv, 2018; Saint Akadiri, Alola & Akadiri, 2019; Khan, Teng & Khan, 2019; Pata, 2019; Shahbaz et al., 2019). For instance, Saint Akadiri, Alola and Akadiri (2019) examine the role of globalization in achieving environmental sustainability target for Turkey. By employing the Bayer-Hanck combined cointegration and Autoregressive Distributed Lag (ARDL) techniques, they find a non-significant negative impact of globalization on CO2 emissions in Turkey. However, according to Pata (2019), who employs
the recently developed bootstrap Autoregressive Distributed Lag (ARDL) approach and validates the Environmental Kuznets Curve (EKC) hypothesis for Turkey amidst a structural break, trade openness has an increasing impact on CO2 emissions. The study further indicates that there is a
By using a similar approach, Destek and Ozsoy (2015) investigate the impact of globalization on the environmental indicators by incorporating urbanization and energy consumption in the framework of the EKC hypothesis. While the study supports the EKC hypothesis for Turkey, it also informs that the variables are cointegrated with CO2 emissions. It is noteworthy that Destek
and Ozsoy (2015) further find statistical evidence that globalization mitigates CO2 emissions in
Turkey when the asymmetric causality approach is employed.
On a general perspective, the studies of You and Lv (2018) and Shahbaz et al. (2019) investigate the effect of economic globalization on CO2 emissions for a larger group of countries. Shahbaz et al. (2019) consider 87 (high, middle and low income) countries within the context of the EKC
hypothesis. By using the cross-correlation approach, the study validates the inverted U-shape of the income and environmental degradation relationship, especially for 16 of the high-middle-income countries only. The U-shaped relationship between globalization and environmental degradation is confirmed for only 6% of the examined countries. On the contrary, neither the inverted U-shaped nor the U-shaped relationship is significantly valid for the remaining countries. Similarly, You and Lv (2018) employ the spatial panel method to underpin the problems of spatial dependency and the spillover effects of economic globalization on CO2 for
63 countries over the period 1985-2013. The investigation supports the evidence of spatial correlation in CO2 emissions across countries and that being encompassed by well-globalized
nations has a positive impact on the quality of the environment.
Moreover, the nexus of electricity consumption and the environment in the context of pollutant emissions has been well covered for different cases. For instance, Cowan et al. (2014) find that there is significant evidence of Granger causality from electricity consumption to CO2 emissions
Africa) of the BRICS countries. Also, Salahuddin et al. (2018) implement the ARDL approach to study the effect of electricity consumption on carbon emissions amidst the effect of foreign direct investment (FDI) and economic growth over the period 1980-2013. While the study affirms the statistical evidence of cointegration among the examined variables, it further reveals that electricity consumption aggravates CO2 emissions in both short-run and long-run in Kuwait.
Also, the statistical evidence of Granger causality from electricity consumption to CO2 emissions
is significant and positive.
Although there are very few empirical studies on the relationship between electricity consumption and CO2 in Turkey, other non-econometric approaches are being employed in the
same context For instance, Ari and Koksal (2011) implement the Intergovernmental Panel on Climate Change (IPCC, 2006) approach, which is expressed as the product of the fuel consumption and the emission factors, and is used to calculate the CO2 emissions from
fossil-fueled power plants between 2009 and 2019. According to Ari and Koksal (2011), the total electricity supply in Turkey from 2011 to 2019 is not expected to meet the estimated demand except with the implementation of the four scenarios of different fuel mixtures that is expected to ameliorate the age-long deficiency. In conjunction with the scenarios (such as The Renewable
Energy Scenario), a significant estimate of CO2 emissions is expected to be cut down between
the period 2011-2019, especially if the share of the fossil-fueled power plants is lowered.
Another scenario method that implements the Long-range Energy Alternatives Planning (LEAP) system is applied by Özer, Görgün and İncecik (2013) for the period 2006-2030 in Turkey. By implementing the LEAP system for the reduction of emissions in the electricity sector of the country, the authors find that CO2 emissions increase significantly under the Baseline Scenario.
2030 which is more than the 6.6% per year growth experienced by the electricity output. However, there was a significant reduction in cumulative CO2 emission (of about 18.4%)
between the Business. As usual (BAU) and the Mitigation Scenario during the observed period, but compared to the Reference Scenario in 2030, the Mitigation Scenario is estimated to cause an abatement of 20.6% of CO2 emissions. The study also reports that electricity demand in Turkey
experienced an annual mean growth rate of 7.3% from 2011 to 2030. Indicatively, Ozcan (2018) corroborates that Turkey’s self-sufficiency rate in electricity generation declined to 37% in 2014 from 77% in 1980, thus the reliance on imported natural gas and other fossil fuel sources continues to increase. The aforementioned perspectives on the electricity consumption in Turkey (especially the electricity mix and it environmental impacts) is not largely different from that of Atilgan and Azapagic (2016).
3. Data and Methodology
The data used to examine the short-term and long-term interactions existing among carbon dioxide emissions (CO2), electricity consumption (E), globalization (G) and economic growth
(Y) in Turkey is sourced from the World Bank indicators (www.databank.worldbank,org). The Sustainable Development Goals (SDGs) 7, 8, 13 and 17 of the United Nations 2019 serve as the bases for the choice of variables in this study.
Carbon dioxide emissions (CO2): with the current observation of drastic impact of global
warming on human lives as a result of continuous increase in carbon dioxide emissions, SDG 13 seeks to ameliorate lives and communities by reducing to the barest minimum emissions from greenhouse gas.
Electricity consumption (E): deliberate attempt to allow the growing population access to affordable electricity is a crucial goal that encourages growth and helps to sustain the environment (SDG 7).
Globalization (G): SDG 17 aims at massive cooperation and harnessing of global partnerships in all beneficial areas to achieve all the targets. This goal also helps to ensure open access to knowledge and technology with the ultimate target of sustainable growth and development.
Economic growth (Y): In achieving full employment and high level of productivity, entrepreneurship and job creation for the teeming unemployed population must be encouraged. SDG 7 seeks to achieve full and productive decent employment for all eligible to work.
To examine the interactions among the variables selected for the study, annual frequency data beginning from 1970 to 2010 were used. Homoscedasticity is desirable and as such, variables are used for investigation in their logarithmic form. The following variables CO2, E, G and Y are
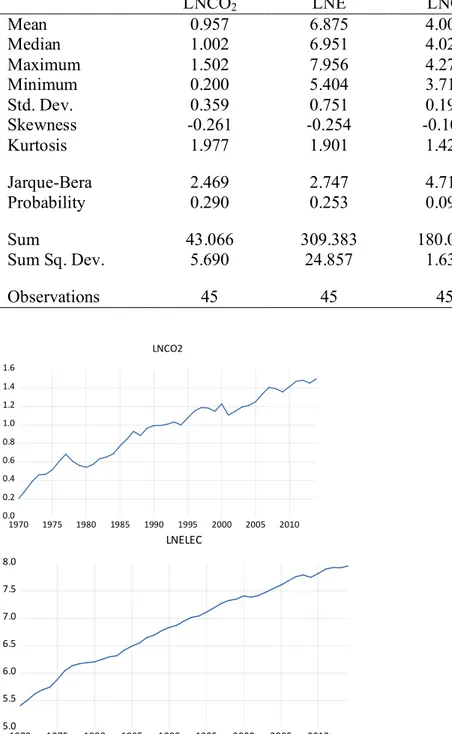
proxies used in the study for ecological degradation, electricity consumption, globalization and economic growth respectively. Economic growth is measured in constant 2010 USD, whereas carbon dioxide is measured in metric tons per capita. Electricity consumption is measured in kilowatts per hour, and globalization index comprises of three dimensions, namely; economic, social and political. Table 1 presents the descriptive statistics of the variables of interest for the Turkish economy. The individual graphical plots of the series used in the study are presented in Figure 1 and the combined graphical plots are displayed in Figure 2.
Table 1: Descriptive Statistics
LNCO2 LNE LNG LNY
Mean 0.957 6.875 4.001 8.857 Median 1.002 6.951 4.024 8.837 Maximum 1.502 7.956 4.272 9.496 Minimum 0.200 5.404 3.713 8.347 Std. Dev. 0.359 0.751 0.192 0.316 Skewness -0.261 -0.254 -0.108 0.296 Kurtosis 1.977 1.901 1.428 2.054 Jarque-Bera 2.469 2.747 4.716 2.332 Probability 0.290 0.253 0.094 0.311 Sum 43.066 309.383 180.074 398.605 Sum Sq. Dev. 5.690 24.857 1.632 4.406 Observations 45 45 45 45 0.0 0.2 0.4 0.6 0.8 1.0 1.2 1.4 1.6 1970 1975 1980 1985 1990 1995 2000 2005 2010 LNCO2 5.0 5.5 6.0 6.5 7.0 7.5 8.0 1970 1975 1980 1985 1990 1995 2000 2005 2010 LNELEC
3.7 3.8 3.9 4.0 4.1 4.2 4.3 1970 1975 1980 1985 1990 1995 2000 2005 2010 LNGLO 8.2 8.4 8.6 8.8 9.0 9.2 9.4 9.6 1970 1975 1980 1985 1990 1995 2000 2005 2010 LNRGDP
Figure 1: Graphical plots of , , , for Turkey.
0 2 4 6 8 10 1970 1975 1980 1985 1990 1995 2000 2005 2010 LNCO2 LNEC LNGLO LNRGDP
Figure 2: Combined Graphical plots of , , , for Turkey.
= ( , , ) (1)
LnCO2t = α + β1Et + β2Yt + β3Gt + ɛt (2)
From the functional form, α and β represent the constant term and partial slope coefficients respectively needed for estimation.
The possible long and short run relationships among carbon dioxide, electricity consumption, globalization index and economic growth variables were examined using Bayer and Hanck (BH, 2013) combined cointegration approach and further confirmed with Pesaran, Shin and Smith (2001) bounds testing technique.
An examination of stationary properties of series prior to the cointegration test was conducted. The conventional Dickey and Fuller (ADF) (1979) and Phillips and Perron (PP) (1988) unit root tests with their usual defect of not accounting for structural breaks was carried out. Zivot-Andrews (1992) with its unique capability of accounting for structural breaks was employed. To investigate the presence of cointegration among variables selected for the study, a more recent Bayer and Hanck (2013) test and bounds testing approach was also carried out. This test which has all the variables integrated at order one consists of Engle and Granger (1987), Johansen (1991), the error correction F-test of Boswijk (1994) and the error correction t-test of Banerjee, Dolado and Mestre (1998), and these collectively determine the test statistics for the earlier techniques. The null hypothesis of the BH test is in favor of no cointegration, whereas the alternative supports the presence of cointegration among the variables of interest. The Fisher’s equation is presented as follows:
(3) (4) 2[ln( EG) ( JOH)] EGJOH P P 2[ln(( EG) ( JOH) ( BO) ( BDM) EGJOH BOBDM P P P P
From equations 3 and 4 above, PBDM, PJOH, PEG and PBO represent significance levels of Banerjee, Dolado and Mestre (1998), Johansen (1991), Engle and Granger (1987) and Boswijk (1994) respectively. Now, should Fisher’s (1932) computed statistic be greater in absolute value than the critical values reported by BH (2013) combined cointegrated statistics, then the hypothesis of non-convergence is to be rejected.
Bounds testing approach is further used as a confirmatory method to ascertain the consistency and robustness of results in the presence of structural breaks. This approach linearly transforms the long and short dynamics of unrestricted error model without necessarily losing any information associated with the long run (Pesaran, Shin & Smith, 2001). The dynamic unrestricted error model is as follows:
2 =
+ + + +
∑ 2 + ∑ + ∑ + ∑ +
(5)
From equation 5 above, ∆ denotes first difference operator, while ɛ represents residual term that is normally distributed. To examine the cointegration relationship between the investigated variables, Wald test is employed and it requires imposing certain limitations on the estimated coefficients under investigation. The hypothesis of no cointegration among variables under consideration holds if the calculated F-statistics exceed the upper level. Diagnostic tests for normality with control of heteroscedasticity and autocorrelation is employed. In ascertaining the stability of the model, Cumulative Sum (CUSUM) and Cumulative Sum Squares (CUSUMsq) tests are used. The study also examines the direction of causal link using causality test among the variables.
The study also examines the direction of causal links using the Toda-Yamamoto (TY, 1995) causality test among the variables. This type of causality test is necessary because it is an improved version of the regular Granger causality test. Its unique features that make it superior include robustness and resilience. The TY test is also unique because it can be performed regardless of the integration order of the series. It is usually conducted using the Vector Autoregressive (VAR) with k + dmax, where k represents optimal order of lag. Equations 6-9 are expressed as follows: = + ∑ , + ∑ , + ∑ + ∑ + ∑ + ∑ + ∑ + ∑ + (6) = + ∑ + ∑ + ∑ , + ∑ , + ∑ + ∑ + ∑ + ∑ + (7) = + ∑ + ∑ + ∑ + ∑ + ∑ + ∑ + ∑ , + ∑ , + (8) = + ∑ + ∑ + ∑ + ∑ + ∑ + ∑ + ∑ , + ∑ , + (9)
Impulse response is used to ascertain the impact of shock to the system from without. This is examined by cross-checking the external shock using the independent variables on the dependent variable.
4. Results and Empirical Discussion
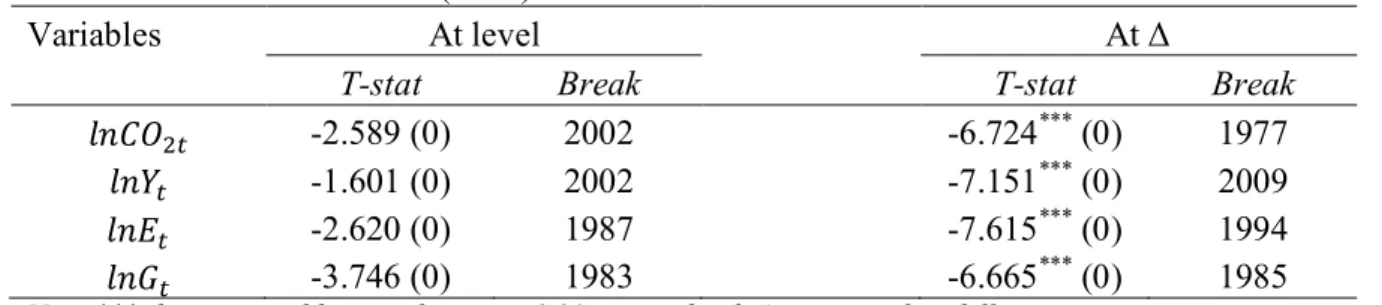
The first step taken in this research is to determine the unit root properties of the variables of interest. The test results for the conventional unit root tests (ADF and PP) are reported in Appendix 1, while the result of the Zivot Andrews (1992) unit root test with single unknown structural breaks is reported in Table 2. The conventional unit root tests indicate that the logarithmic forms of CO2, Y, E and G are non-stationary at level but become stationary after first
differencing. The Zivot Andrews (1992) test results indicate that the logarithmic forms of CO2,
Y, E and G are non-stationary at level in the presence of single structural breaks but become stationary after first differencing. Thus, all the variables are integrated of order one. As shown in Table 2, the identified breakpoints are concentrated around the mid-1980s, a period characterized by far-reaching economic liberation in terms of financial markets, trade and services openness, and the 2000s which coincide with the decade of boom in the Turkish economy.
Table 2: Zivot and Andrews (1992) structural break unit root test
Variables At level At Δ
T-stat Break T-stat Break
-2.589 (0) 2002 -6.724*** (0) 1977
-1.601 (0) 2002 -7.151*** (0) 2009
-2.620 (0) 1987 -7.615*** (0) 1994
-3.746 (0) 1983 -6.665*** (0) 1985
Note, *** depicts variables significance at 0.01 percent level. Δ represent first difference.
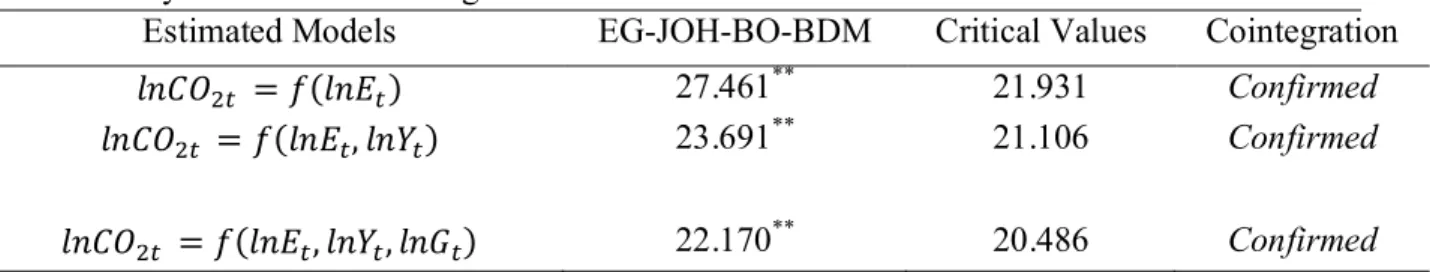
Since all the variables are integrated of order one, the Bayer and Hanck (2013) combined cointegration tests are suitable for determining the existence of long-run relationships between the variables of interest. As reported in Table 3, the Fisher-statistics for the combined cointegration test are greater than the critical values at 5% level of significance in each of the
models specified. We are thus able to reject the null of no cointegration in all cases and establish that long-run relationships exist among CO2, Y, E and G.
Table 3: Bayer and Hanck cointegration test results
Estimated Models EG-JOH-BO-BDM Critical Values Cointegration
= ( ) 27.461** 21.931 Confirmed
= ( , ) 23.691** 21.106 Confirmed
= ( , , ) 22.170** 20.486 Confirmed
For the record the ** signifies statistical significance at 0.05 level.
Although the Bayer and Hanck (2013) test is quite efficient, it does not consider structural breaks. Therefore, to achieve consistency and ensure robustness of the cointegration results, especially in the presence of structural breaks, the ARDL bounds testing approach to cointegration is also employed. Prior to carrying out the test, it is essential to determine the most appropriate lag length for model specification. The following information criteria were evaluated for lag length selection; sequential modified LR, final prediction error, Akaike information criterion, Schwarz information criterion and Hannan–Quinn information criterion. Results of the lag length criteria along with the ARDL cointegration test are reported in Table 4. The chosen lag length (1) is based on the Akaike Information Criteria (AIC). AIC displays superiority over other criteria in the following ways; it exhibits better small sample properties (Lütkepohl, 2006), improved efficiency and consistency over final prediction error, Schwarz information criterion and Hannan–Quinn information criterion (Shahbaz et al., 2016). Moreover, all other results except that of sequential modified LR align with the AIC outcome.
With regards to the ARDL cointegration result, as reported in Table 5, the calculated F statistic is greater than the upper critical bound at 10%, 5%, 2.5% and 1% levels of significance
respectively. Thus, we are again able to reject the null of no cointegration among CO2, Y, E and
G and confirm that a long-run relationship exists between the variables in Turkey.
Table 4: F-Bounds test result and lag order criteria.
Lag LogL LR FPE AIC SC HQ
0 178.443 NA 1.91E-09 -8.722 -8.553 -8.661 1 371.823 338.415 2.710* -17.591* -16.746* -17.285* 2 381.120 14.409 3.89E-13 -17.256 -15.736 -16.706 3 392.138 14.875 5.33E-13 -17.007 -14.811 -16.213 4 415.098 26.403* 4.29E-13 -17.355 -14.484 -16.317 5 435.364 19.252 4.39E-13 -17.568 -14.022 -16.286
F-Bounds Test Null Hypothesis: No levels relationship Test
Statistic Value Significant. I(0) I(1)
Asymptotic: n=1000
F-statistic 11.384 10% 2.37 3.2
K 3 5% 2.79 3.67
2.50% 3.15 4.08
1% 3.65 4.66
Note: LR: sequential modified LR test statistic (each test at 5% level). FPE: Final prediction error. AIC: Akaike information criterion. SC: Schwarz information criterion. HQ: Hannan–Quinn information criterion. * indicates lag order selected by the criterion. Note *** depict significance level at 0.01 percent level,
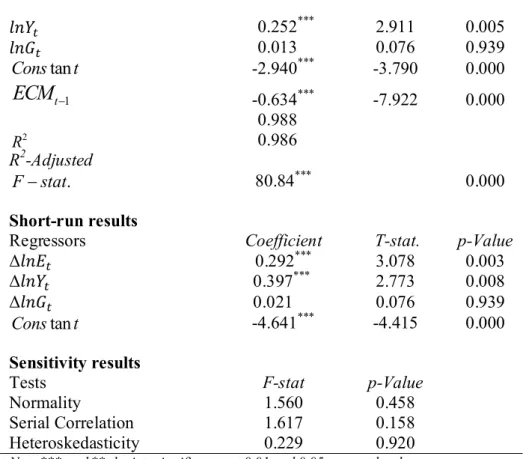
Next, we estimate the impact of the independent variables on carbon emissions in Turkey. The results are reported in Table 5. The estimated speed-of-adjustment coefficient (-0.634) is negative and significant at 1% significant level, indicating the presence of a long-term relationship between the variables. This corroborates the conclusion reached through the Bayer and Hanck (2013) and ARDL cointegration tests.
Electricity consumption has a significant positive impact on carbon emissions in both long and short term. For every percentage rise in electricity consumption, carbon emissions increase by about 0.185 percent in the long term. In the short term, one period-lagged effect of a percentage increase in electricity consumption causes carbon emissions to rise by about 0.292 percent in the following periods. The results are significant at 5% and 1% respectively.
Economic growth also exhibits both long- and short-term positive effects on carbon emissions. If economic growth increases by 1 percent, carbon emissions are expected to increase by 0.252 percent in the long term, whereas one period-lagged effect of a percentage increase in economic growth results in 0.397 percent increase in carbon emissions in the following periods. Both results are significant at 1%. There is however no statistical evidence in support of the suggested positive impact of globalization on carbon emissions (both long and short term) in Turkey, based on our findings
The diagnostic tests conducted indicate that none of the following problems exist in the series; error normality, serial correlation and heteroscedasticity. Both the R squared and adjusted R squared values show that approximately 99 percent of the variation in carbon emissions are due to the effects of the variables included in the model. The associated p-value of the reported F-statistic also indicates that the entire model is significant at 1%.
CUSUM and CUSUM sq. tests for stability are also conducted for the ARDL bounds testing estimates. As displayed in Figure 3, the plots of the CUSUM statistics and CUSUM sq statitistics fall within the critical bounds. Additionally, the chow forecast test was carried out to determine the significance of the structural breaks in Turkey over the period 1983-2014. The reported F-statistics in Table 6 indicate that no significant structural break is noticeable in the Turkish economy over the period sampled. The chow test outcomes thus confirm that the ARDL results are both efficient and reliable.
Table 5: Long-run and Short-run ARDL (1, 0, 0, 0) results Dependent Variable =
ln
CO
2
tLong-run results
Regressors Coefficient T-stat. p-Value
0.252*** 2.911 0.005 0.013 0.076 0.939 tan Cons t -2.940*** -3.790 0.000 1 t
ECM
-0.634*** -7.922 0.000 2 R R2-Adjusted 0.988 0.986 . Fstat 80.84*** 0.000 Short-run resultsRegressors Coefficient T-stat. p-Value
Δ 0.292*** 3.078 0.003 Δ 0.397*** 2.773 0.008 Δ 0.021 0.076 0.939 tan Cons t -4.641*** -4.415 0.000 Sensitivity results
Tests F-stat p-Value
Normality 1.560 0.458
Serial Correlation 1.617 0.158
Heteroskedasticity 0.229 0.920
Note *** and ** depicts significance at 0.01 and 0.05 percent level.
Table 6: Chow forecast test
Chow forecast test from 1983 to 2014
Coeff. Df p-Value
F-statistic 1.364 (32, 7) 0.354
Chow forecast test from 1987 to 2014
Coeff, Df p-Value
F-statistic 1.886 (28, 11) 0.134
Chow forecast test from 2002 to 2014
Coeff. Df p-Value
F-statistic 1.705 (13, 26) 0.119
-20 -15 -10 -5 0 5 10 15 20 1975 1980 1985 1990 1995 2000 2005 2010 CUSUM 5% Significance -0.4 -0.2 0.0 0.2 0.4 0.6 0.8 1.0 1.2 1.4 1980 1985 1990 1995 2000 2005 2010
CUSUM of Squares 5% Significance
Figure 3: Recursive Plot for , , , for Turkey.
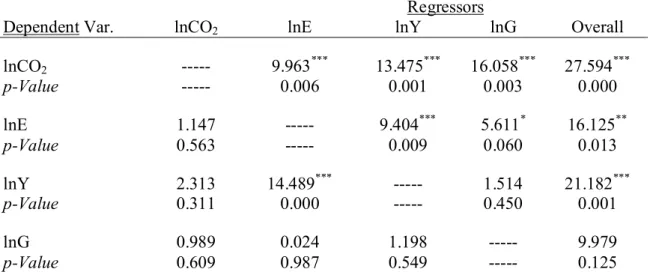
We further conduct the TY Granger causality test to establish the pattern of causal relations between CO2, E, Y and G. Alongside Granger causality testing, we also investigate the effects of
innovations in all regressors on carbon emissions so as to glean useful short-run insights. The TY test results are provided in Table 6. The graphs showing the generalized impulse responses of CO2 to one standard deviation innovations in E, Y and G are presented in Figure 4.
As can be observed from Table 6, there is causality running from electricity consumption to carbon emissions without feedback. Also, it is clear from Figure 4a that shocks to E have permanent positive and significant impact on CO2. This is in consonance with our earlier finding
that electricity consumption exerts a positive influence on carbon emissions. Similarly, Table 6 shows that Y Granger causes CO2 without feedback, while shocks to Y also have permanent
positive and significant effect on CO2 (Figure 4b). This agrees with the conclusion reached
earlier that economic growth positively impacts carbon emissions. As reported in Table 6, one-way causality running from G to CO2 is also detected. Figure 4c however shows that CO2 does
not react at all to changes in G. Additionally, we detect bidirectional causal relations between E and Y, an indication that electricity consumption and economic growth are important predictors of each other. We also find that G Granger causes E, showing that changes in the rate of globalization is a useful predictor of electricity consumption rate in Turkey.
Table 6: Toda-Yamamoto (1995) Granger Causality results
Regressors
Dependent Var. lnCO2 lnE lnY lnG Overall
lnCO2 --- 9.963*** 13.475*** 16.058*** 27.594*** p-Value --- 0.006 0.001 0.003 0.000 lnE 1.147 --- 9.404*** 5.611* 16.125** p-Value 0.563 --- 0.009 0.060 0.013 lnY 2.313 14.489*** --- 1.514 21.182*** p-Value 0.311 0.000 --- 0.450 0.001 lnG 0.989 0.024 1.198 --- 9.979 p-Value 0.609 0.987 0.549 --- 0.125
Note ***, ** and * depicts significance at 0.01, 0.05 and 0.10 percent level
-.008 -.004 .000 .004 .008 .012 .016 .020 .024 .028 .032 1 2 3 4 5 6 7 8 9 10
Response of LNCO2 to LNELEC Innovation using Cholesky (d.f. adjusted) Factors
-.01 .00 .01 .02 .03 .04 1 2 3 4 5 6 7 8 9 10
Response of LNCO2 to LNGLO Innovation using Cholesky (d.f. adjusted) Factors
-.04 -.03 -.02 -.01 .00 .01 .02 .03 1 2 3 4 5 6 7 8 9 10
Response of LNCO2 to LNRGDP Innovation using Cholesky (d.f. adjusted) Factors
5. Conclusion
This article examined the linkages among carbon emissions, electricity consumption, economic growth and globalization in Turkey. Through employing the Bayer and Hanck (2013) cointegration procedure and the ARDL bounds testing approach to cointegration in a multivariate arrangement, we found evidence in support of a long-run linkage among the variables. A consideration of the impacts of the independent actors on carbon emissions suggests that in the long-run, both electricity consumption and economic growth are the main statistical causes of carbon emissions in Turkey. There is no statistical indication that globalization impacts carbon emissions in Turkey.
Interconnectivity among the variables of interest was also investigated by employing the TY procedure and the generalized impulse response functions. We found that electricity consumption Granger causes carbon emissions without feedback and that shocks to electricity consumption have permanent positive and significant impact on carbon emissions in Turkey. We also found that economic growth Granger causes carbon emissions without feedback, while shocks to economic growth also exhibit permanent positive and significant effect on carbon emissions. Although one-way causality from globalization to carbon emissions was detected, the generalized impulse response function however showed that carbon emissions do not react to changes in globalization. In addition, we noticed bidirectional causal relations between electricity consumption and economic growth, and one-way causality from globalization to electricity consumption.
From our findings, the policy variables relevant to pollution reduction in Turkey are electricity consumption and economic growth. The common factor to these policy variables is fossil fuel consumption.
Electricity generation is the second largest contributor to carbon emissions (41% of total global carbon emissions), mainly as a result of fossil fuel burnings. About 73% of carbon emissions from electricity generation comes from coal-fired power plants, which on the average generate about 950 grams of CO2 for every kilowatt-hour of electricity produced (Enerji, 2019). Gas-fired
power plants also generate about 350 grams of CO per kilowatt-hour of electricity. Likewise, to achieve economic growth, development strategies have mostly focused on intensification of industrialization, adoption of energy-intensive technological choices and extensive use of biochemical-based agricultural processes. These factors account for over 25% of total global carbon emissions (Enerji, 2019)
All the possible pathways towards curbing global warming identified by IPCC (2018) involve drastic decarbonization. Turkey, being one of the largest contributors to global carbon emissions, generating about 500 megatonnes of CO2 annually, has a responsibility to the global community
to decarbonize drastically (Akadiri et al, 2019). Most of the carbon emissions generated in Turkey come from fossil fuel burnings, mainly coal, for electricity generation, heating and industrial use. Other major contributors include natural gas electricity production and heating, and petroleum consumption by the Turkish transport sector.
Our findings have important policy implications for Turkey. A variety of measures can be taken by policymakers without slowing down the pace of Turkish economic growth. The so-called fossil-fuel capitalism, a socio-economic arrangement driven by fossil fuel consumption needs to be overhauled. A switch to low carbon, eco-friendly, energy mix is required. For example, the adverse effect of electricity production from renewable sources on the environment is not only quite minimal but also inexhaustible. Renewable energy sources such as hydro, wind, solar PV and solar thermal, only generate carbon emissions during their construction phase. Accordingly,
for every kilowatt-hour of electricity generated, a solar PV produces just between 60-150 grams of CO2 per kilowatt-hour of electricity. CO2 per kilowatt-hour of electricity from a typical wind
turbine ranges between 3-22 grams, that of a typical hydropower plant approximately 4 grams, and that of nuclear power plants only about 6 grams. These values from renewable energy sources are far lower than the approximate value of 950 grams released by coal-fired power plants. These renewable energy sources should thus be prioritized by policymakers.
The time has also come for policymakers to aggressively encourage the adoption of electric vehicles not as complements to internal combustion engine vehicles but as substitutes. Electric vehicles do not burn fossil fuels, neither do they generate carbon emissions.
Another policy direction for the Turkish government is the introduction of environmentally-sensitive taxes and subsidies in relevant sectors of the economy. Environmental taxes should be levied on sectors or industries that create levels of pollution beyond a certain threshold, while subsidies should be given to sectors or industries that adopt clean, ecofriendly technologies. The financial sector as a matter of policy should also be encouraged to channel credit facilities to the sectors or industries willing to adopt ecofriendly processes.
Turkey also needs to improve its level of participation in the global drive for decarbonization. Turkey is yet to ratify global agreements on decarbonization such as the Kigali amendment to the Montreal Protocol on hydro fluorocarbons regulation, and the Paris agreement on climate change.
It is noteworthy that to achieve low-carbon energy system, Turkey will require extensive planning and financing, and coordinated action across many sectors of the economy, involving numerous stakeholders such as energy producers, distributors and consumers.
Although the current study has carefully addressed and closed salient gap in extant studies, future study can applied a disaggregate energy consumption (such as coal, oil, gas, renewable, e.t.c.) as employed by Khan, Teng and Khan (2019) within the same framework.
References
Alola, A. A. (2019a). Carbon emissions and the trilemma of trade policy, migration policy and health care in the US. Carbon Management, 10(2), 209-218.
Alola, A. A. (2019b). The trilemma of trade, monetary and immigration policies in the United States: Accounting for environmental sustainability. Science of the Total Environment, 658, 260-267.
Alola, A. A., Alola, U. V., & Saint Akadiri, S. (2019). Renewable energy consumption in Coastline Mediterranean Countries: impact of environmental degradation and housing policy. Environmental Science and Pollution Research, 1-13.
Ari, I., & Koksal, M. A. (2011). Carbon dioxide emission from the Turkish electricity sector and its mitigation options. Energy Policy, 39(10), 6120-6135.
Atilgan, B., & Azapagic, A. (2016). Assessing the environmental sustainability of electricity generation in Turkey on a life cycle basis. Energies, 9(1), 31.
Bekun, F. V., Alola, A. A., & Sarkodie, S. A. (2019). Toward a sustainable environment: Nexus between CO2 emissions, resource rent, renewable and nonrenewable energy in 16-EU countries. Science of the Total Environment, 657, 1023-1029.
Bekun, F. V., Emir, F., & Sarkodie, S. A. (2019). Another look at the relationship between energy consumption, carbon dioxide emissions, and economic growth in South Africa.
Science of the Total Environment, 655, 759-765.
British Petroleum, BP (2018). BP statistical review of world energy. 2018. Available from:https://www.bp.com/en/global/corporate/energy-economics/statistical-review-of-world-energy/downloads.html. Retrieved 10 July 2019.
Banerjee, A., Dolado, J., & Mestre, R. (1998). Error-correction mechanism tests for cointegration in a single-equation framework. Journal of Time Series Analysis 19(3): 267- 283.
Bayer, C., & Hanck, C. (2013). Combining non-cointegration tests. Journal of Time Series
Analysis, 34(1): 83–95.
Boswijk, P. H. (1994). Testing for an unstable root in conditional and structural error correction models. Journal of Econometrics, 63(1): 37-60.
Cowan, W. N., Chang, T., Inglesi-Lotz, R., & Gupta, R. (2014). The nexus of electricity consumption, economic growth and CO2 emissions in the BRICS countries. Energy
Policy, 66, 359-368.
Destek, M. A., & Ozsoy, F. N. (2015). Relationships between economic growth, energy consumption, globalization, urbanization and environmental degradation in Turkey.
International Journal of Energy and Statistics, 3(04), 1550017.
Dickey, D. A., & Fuller, W. A. (1979). Distribution of the estimators for autoregressive time series with a unit root. Journal of the American statistical association, 74(366a), 427-431.
Dogan, E. (2015). The relationship between economic growth and electricity consumption from renewable and non-renewable sources: A study of Turkey. Renewable and Sustainable Energy Reviews, 52, 534-546.
Enerji (2019). The gross electricity consumption in Turkey in 2018 was 303.2 billion kilowatts per hour. https://www.enerji.gov.tr/en-US/Pages/Electricity. Retrieved 19 July 2019. Engle, R. F., & Granger, C. W. (1987). Co-integration and error correction: Representation,
estimation, and testing. Econometrica, 251-276.
Fisher, R. (1932). Statistical methods for research workers. London: Oliver and Boyd.
Global Economic Dynamics. (2019). The pros and cons of globalization. https://ged-project.de/allgemein-en/the-pros-and-cons-of-globalization/. Retrieved 10 July 2019. International Energy Agency (IEA). (2019a). Global Energy and CO2 Status Report.
https://www.iea.org/geco/emissions/. Retrieved 13 July 2019.
International Energy Agency (IEA). (2019b). Global Energy. https://www.iea.org/countries/Turkey/. Retrieved 19 July 2019.
Intergovernmental Panel on Climate Change (IPCC). (2006). IPCC Guidelines for National Greenhouse Gas Inventories〈http://www.ipcc-nggip.iges.or.jp/public/2006gl/index.html 〉. Retrieved 20 July 2019.
Intergovernmental Panel on Climate Change (IPCC). (2018). Special Report on the Impacts of Global Warming of 1.5°C: Summary for Policymakers. Incheon, Republic of Korea.
Johansen, S. (1991). Estimation and hypothesis testing of cointegration vectors in Gaussian vector autoregressive models. Econometrica, 59(6): 1551-1580.
Lütkepohl, H. (2006). Structural vector autoregressive analysis for cointegrated variables.
Allgemeines Statistisches Archiv, 90(1), 75-88.
Khan, M. K., Teng, J. Z., & Khan, M. I. (2019). Effect of energy consumption and economic growth on carbon dioxide emissions in Pakistan with dynamic ARDL simulations approach. Environmental Science and Pollution Research, 1-11.
Organization for Economic Co-operation and Development (OECD). (2019). OECD Environmental Performance Reviews: Turkey 2019. https://www.oecd.org/turkey/oecd-environmental-performance-reviews-turkey-2019-9789264309753-en.htm. Retrieved 20 July 2019.
Özer, B., Görgün, E., & İncecik, S. (2013). The scenario analysis on CO2 emission mitigation potential in the Turkish electricity sector: 2006–2030. Energy, 49, 395-403.
Ozcan, M. (2018). The role of renewables in increasing Turkey's self-sufficiency in electrical energy. Renewable and Sustainable Energy Reviews, 82, 2629-2639.
Pata, U. K. (2019). Environmental Kuznets Curve and Trade Openness in Turkey: Bootstrap ARDL Approach with a Structural Break. Environmental Science and Pollution
Research, 1-13.
Pesaran, M. H., Shin, Y., & Smith, J. R. (2001). Bounds testing approaches to the analysis of level relationships. Journal of Applied Econometrics, 16(3):289–326.
Phillips, P. C., & Perron, P. (1988). Testing for a unit root in time series regression. Biometrica,
Saint Akadiri, S., Alkawfi, M. M., Uğural, S., & Akadiri, A. C. (2019a). Towards achieving environmental sustainability target in Italy. The role of energy, real income and globalization. Science of the Total Environment, 671, 1293-1301.
Saint Akadiri, S., Alola, A. A., & Akadiri, A. C. (2019). The role of globalization, real income, tourism in environmental sustainability target. Evidence from Turkey. Science of the
Total Environment.
Saint Akadiri, S., Alola, A. A., Akadiri, A. C., & Alola, U. V. (2019b). Renewable energy consumption in EU-28 countries: policy toward pollution mitigation and economic sustainability. Energy Policy, 132, 803-810.
Saint Akadiri, S., Bekun, F. V., & Sarkodie, S. A. (2019). Contemporaneous interaction between energy consumption, economic growth and environmental sustainability in South Africa: What drives what? Science of the Total Environment, 686, 468-475.
Salahuddin, M., Alam, K., Ozturk, I., & Sohag, K. (2018). The effects of electricity consumption, economic growth, financial development and foreign direct investment on CO2 emissions in Kuwait. Renewable and Sustainable Energy Reviews, 81, 2002-2010.
Samu, R., Bekun, F. V., & Fahrioglu, M. (2019). Electricity consumption and economic growth nexus in Zimbabwe revisited: fresh evidence from Maki cointegration. International
Journal of Green Energy, 16(7), 540-550.
Shahbaz, M., Mahalik, M. K., Shahzad, S. J. H., & Hammoudeh, S. (2019). Testing the globalization-driven carbon emissions hypothesis: international evidence. International
Shahbaz, M., Loganathan, N., Muzaffar, A. T., Ahmed, K., & Jabran, M. A. (2016). How urbanization affects CO2 emissions in Malaysia? The application of STIRPAT model. Renewable and Sustainable Energy Reviews, 57, 83-93.
Soytas, U., & Sari, R. (2006). Energy consumption and income in G-7 countries. Journal of
Policy Modeling, 28, 739-750.
The Paris Agreement. (2015). https://unfccc.int/process/conferences/pastconferences/ paris-climate-change-conference-november-2015/ Paris-agreement. Retrieved 13 July 2019. Toda, H. Y., & Yamamoto, T. (1995). Statistical inference in vector autoregressions with
possibly integrated processes. Journal of econometrics, 66(1-2), 225-250.
United Nations Framework Convention on Climate Change (UNFCC). https://unfccc.int/. Retrieved 13 July 2019.
World Bank. (2018). Development Indicators. Accessed May, 2019
You, W., & Lv, Z. (2018). Spillover effects of economic globalization on CO2 emissions: a spatial panel approach. Energy Economics, 73, 248-257.
Zivot, E., & Andrews, D. W. K. (1992). Further evidence on the Great Crash, the oil price shock, and the unit root hypothesis. Journal of Business and Economic Statistics 10(3): 251-270. http://databank.worldbank.org.
Zhang, M., Liu, X., Wang, W., & Zhou, M. (2013). Decomposition analysis of CO2 emissions from electricity generation in China. Energy policy, 52, 159-165.
Appendix 1: ADF and PP unit root test results
Variables ADF PP Order
Level t-stat p-Value t-stat p-Value
lnCO2 -1.695 0.426 -1.753 0.398
lnY 0.461 0.983 0.493 0.984
lnG -0.527 0.875 -0.524 0.876 First Difference lnCO2 -6.218*** 0.000 -6.358*** 0.000 (1) lnY -6.267*** 0.000 -6.266*** 0.000 (1) lnE -4.518*** 0.000 -4.443*** 0.000 (1) lnG -6.475*** 0.000 -6.475*** 0.000 (1)