Economic analysis of aquaculture enterprises and determination of
factors affecting sustainability of the sector in Turkey
*Mehmet Saltuk ARIKAN
1, Yılmaz ARAL
21Department of Animal Health Economics and Management, Faculty of Veterinary Medicine, Fırat University, Elazığ, Turkey; 2Department of Animal Health Economics and Management, Faculty of Veterinary Medicine, Ankara University, Ankara, Turkey.
Summary: This research was conducted to carry out technical and economic analysis of the aquaculture enterprises in Muğla as well as to determine the factors affecting sustainability in the sector. The research material is the production data of 65 enterprises from 2014-2015 years activity period. Stratified random sampling method was used for the determination of the enterprises involved in this study and the data provided by using the data collection form with face-to-face interview. The production data of the enterprises are evaluated from the technical and economical perspectives and the factors that impact the unit profit are estimated by the multiple regression model. The average fattening period (months), the rate of shrinkage and mortality (%), and the FCR (kg feed/kg fish) for Seabream and Seabass were found to be 14.43-19.05; 10.70-14.33 and 1.84-1.98 respectively, among the enterprises. The unit cost and unit profit for the fish species in question were estimated to be 4.18 US$/kg and 4.57 US$/kg, and 1.29 US$/kg and 1.07 US$/kg, respectively. According to the estimated regression model; production type, capacity utilization rate, sales price and FCR are determined to be effective on the unit profit. It was concluded that aquaculture enterprises could achieve sustainability if; i) capacity utilisation rate was optimised; ii) dependence on foreign sources of feed and raw materials was reduced; iii) producer organisations played a more active role in the market; iv) a regulatory authority body was established to balance out prices and v) export opportunities were pursued further in foreign markets.
Keywords: Aquaculture enterprises, economic analysis, regression analysis, sustainability, Turkey.
Türkiye’de kültür balıkçılığı işletmelerinin ekonomik analizi ve sektörde sürdürülebilirlik üzerine
etkili faktörlerin belirlenmesi
Özet: Bu araştırma, Muğla ili kültür balıkçılığı işletmelerinin teknik ve ekonomik analizinin yanında sektörde sürdürülebilirlik üzerine etkili faktörleri tespit etmek amacıyla yapılmıştır. Araştırma materyali 65 adet işletmenin 2014-2015 faaliyet dönemine ait üretim verileridir. Araştırmaya dâhil edilen işletmelerin belirlenmesinde tabakalı tesadüfi örnekleme yöntemi kullanılmış, veri temininde ise veri temin formundan (yüz yüze görüşülerek) yararlanılmıştır. İşletmelere ait üretim verileri teknik ve ekonomik yönden değerlendirilmiş, birim kara etkili faktörler çoklu regresyon modeli ile tahmin edilmiştir. Tüm işletmelerde ortalama besi süresi (ay), fire-mortalite oranı (%) ve yemden yararlanma oranı (kg yem/kg balık) çipura ve levrek için sırasıyla; 14.43-19.05; 10.70-14.33 ve 1.84-1.98 tespit edilmiştir. Söz konusu türlerde birim maliyet ve kâr sırasıyla 4.18-4.57 US$/kg ve 1.29-1.07 US$/kg hesaplanmıştır. Tahmini regresyon modeline göre; üretim tipi, kapasite kullanım oranı, satış fiyatı ve yemden yararlanma oranının birim kâr üzerinde etkili olduğu belirlenmiştir. Sonuç olarak; i) işletmelerde kapasite kullanım oranlarının optimize edilmesi, ii) yem hammaddelerinin temininde dışa bağımlılığın azaltılması, iii) üretici örgütlerinin piyasada fiyat oluşumunda etkili olabilmesi, iv) iç pazarda fiyatların regülasyonunu sağlayan etkin bir yapının kurulması, v) dış pazarda ise ihracat olanaklarının geliştirilmesi ile işletmelerin sürdürülebilir ekonomik bir yapıya ulaşabileceği tespit edilmiştir.
Anahtar sözcükler: Ekonomik analiz, kültür balıkçılığı, regresyon analizi, sürdürülebilirlik, Türkiye.
Introduction
The share of the aquaculture sector in the Gross Domestic Product (current prices of 2012) in Turkey is 0.2%. With a growth rate of 22.7%, the sector provides more than 250 thousand people with employment opportunities in the areas of fishing and fish-farming (16).
* This artical was prepared from the first author’s PhD thesis entitled “Economic Analysis of the Aquaculture Enterprises and Determination of Factors Affecting Sustainability in Fishery Sector in Muğla Province”.
According to the data from the Turkish Statistical Institute, the total amount of aquaculture products obtained through fishing and farming in 2000 was 582,376 tons, 14% of which was obtained through farming. In 2015, this figure rose to 672,241 tons, and the share of farming increased to 35% (21). It was reported that the
fishing products decreased each year as a result of unregulated fishing and reduction in natural stocks, and that the aquaculture products obtained from inland waters and seas increased considerably (17).
Employing various production techniques in the aquatic resources in Turkey, the enterprises are predominantly engaged in trout farming in the inland waters and Seabream and Seabass production in the seas. Approximately 53% of 240,334 tons of product obtained through farming in 2015 consisted of Seabream and Seabass raised in net cages in the seas, and 55% of the sea fish production took place on the coasts of Muğla (21).
Significant developments have occurred in
aquaculture production. Particularly, the near-coastal net cages were required to be moved at least 1 km away from the coast to open and deep waters, and modern advanced technologies have been adopted (16). Many small-scale enterprises merged and moved their cages to open seas, resulting in increased enterprise scales and production costs.
Studies in the field of economic perspective suggested that the relationship between inputs used in the production process must be well understood to ensure that enterprises are sustainable and profitable (3), thus the enterprises should be administered by determining the alteration of production costs and from where the cost reduction can be acquired (5). Examining aquaculture in terms of business economics benefits producers as well as policymakers during the designing of policy measures which allow improved profitability in the sector (1). The authorities involved in this sector should better have proper knowledge of the different species and culture systems for aquaculture productivity, input cost and availability of resources, marketing demand and supply, and plausible economic decision offers on investment in aquaculture by investors (5).
Various studies have been carried out on structural and economic analysis of Seabream and Seabass production sector in Turkey (7, 9, 10, 14, 20). Whereas, this study is the first to analyze the cost and profitability of Seabass and Seabream production of Turkey in the
literature, considering the enterprise scale and fish species difference in the aquaculture production. Muğla province region was choosen to determine the enterprise scale and the grouping of fish species and the factors that affect sector sustainability.
Materials and Methods
Data collection and determination of sample size
The research consisted of the data for the production period 2014-2015, obtained from face-to-face interviews with the aquaculture production company owners in Muğla as well as via data collection forms. The sample of the research consisted of the aquaculture enterprises engaged in offshore farming of Seabream and Seabass through modern production methods in Muğla, members of the Association of Aquaculture Producers. Taking into account the levels of production, enterprises were grouped into three strata; namely, small-scale (0-500 tons), medium-scale (501-1,000 tons) and large scale (above 1,001 tons). In the selection of the sample, Neyman Method was used to determine the sample size. Taking into account the weights of the mean and variance of each stratum, a single sample size was determined for all strata (19).
In the Neyman Method, the total sample size was determined using the following formula:
n = N . Σ(Nh . Sh2) / N2. D2 + Σ(Nh . Sh2) [Equation 1]
where "n" is the sample size, "N" is the population size, "Nh" is the number of units in the stratum h, "Sh2" is the
variance of stratum h and "D2" is the ratio of the square of
the maximum error accepted to the square of the z value in the standard normal distribution table.
The population of the study consisted of 97 enterprises engaged in aquaculture enterprises at sea in Muğla. Through the Neyman Method, the sample size (n=55) calculated based on a confidence interval of 90% (Z=1.65) and a deviation of 10% was distributed into the strata using the formula below. The distribution is shown in Table 1
n = Nh.Sh.n / Σ Nh.Sh [Equation 2]
Table 1. Distribution of sample size into the strata through Neyman method. Tablo 1. Neyman yöntemi ile örneklem hacminin tabakalara dağılımı.
Stratum Number Stratum Limits Nh Sh Nh.Sh2 n
1 0-500 42 52.276 114776.7674 9
2 501-1000 32 168.005 903221.7608 23
3 1001 or more 23 233.000 1248647.000 23
Total 97 55
Nh: Number of enterprises in the stratum. Sh2: Variance of the relevant stratum n: Number of samples calculated
Considering that there might be enterprises that discontinue production due to any reason or have irrecoverable inconsistencies and omissions in their data, a sufficient number of reserve enterprises were included into the sample, which finally consisted of 65 enterprises, 15 of them being small-scale, 24 being medium-scale and 26 being large-scale.
Data analysis
Within the scope of the profitability analysis in the research, profitability ratio, economic profitability, profitability factor and cost-to-return ratio were calculated as well (6).
One-way ANOVA was used to compare the unit costs and unit profits on the basis of the company scales, and t-test was employed to compare the unit cost and profit on the basis of species. The factors affecting unit profit in the enterprises were estimated through the multi-linear regression analysis (11). The purpose for using this analysis is to reveal the effect of each independent variable has on the dependent variable. In the regression analysis we performed, all independent variables were included in the model and the stepwise selection method was applied
(13, 8). Because of that the unimportant variables were not included in this model. The formula used in the multi-linear regression analysis is as follows:
Y = b0+b1X1+b2X2+b3X3+b4X4+……..bnXn
[Equation 3] where the dependent variable Y is the unit profit of the
enterprises, and the independent variables X1 is the type of
production (producing only Seabream, producing only
Seabass, producing both Seabream and Seabass), X2 is the
capacity utilisation rates of the enterprises (%), X3 is the
scale of the enterprises (small, medium and large), X4 is
the unit sale price (US$/kg), X5 is the FCR (kg feed/kg
fish) and X6 is the species raised (Seabream or Seabass).
Results
The data for the aquaculture enterprises in Muğla were explored for each scale, and the general and technical findings are given in Table 2, the results of the economic analyses in Table 3-5, the results of the regression analysis in Table 6-7, and the findings on the rates of return in Table 8.
Table 2. General and technical parameters for enterprises. Tablo 2. İşletmelere ait genel ve teknik bulgular.
General and Technical Parameters Average of Small-Scale Enterprises (n=15) Average of Medium-Scale Enterprises (n=24) Average of Large-Scale Enterprises (n=26) Average of All Enterprises (n=65) Period of Enterprises in the Sector
(year)* 23.20±1.76 22.91±1.55 21.88±1.41 22.56±0.90
Enterprise Establishment Time (year)* 10.93±1.30 14.04±1.22 11.96±0.87 12.49±0.66 Legal Status of Enterprises 80% Incorporated
20% Limited 62.50% Incorporated 37.50% Limited 88.46% Incorporated 11.54% Limited 76.92% Incorporated 23.08% Limited Capacity Utilisation Rate (%)* 62.63±6.22 78.22±3.73 76.13±3.95 73.78±2.65 Amount of Seabream Production (Kg)* 185 934±45 843 531 536±60 622 1 233 081±115 297 732 272±74 341 Amount of Seabass Production (Kg)* 210 234±19 018 472 356±39 223 1 366 887±112 440 716 118±75 764
Production of Seabass Only (%) 13.33 8.34 11.54 10.77
Production of Seabream Only (%) 6.67 20.83 57.69 21.54
Production of Seabream and Seabass (%) 80.00 70.83 30.77 67.69
Sea Surface Rented (m2)* 12 906±1 896 32 416±2 674 58 919±3 430 38 515±2 855 Cage Volume (m3)* 36 057±2 423 111 819±11 531 246 467±22 576 148 195±14 546
Stock Density (kg/m3)* 10.98±1.79 8.97±0.87 10.54±1.31 9.77±0.75
Total HDPE** Cages (piece)* 169±2.79 484±1.83 693±3.83 1 346±1.94
Duration of Seabream Farming (month)* 15.23±0.51 14.40±0.40 14.00±0.42 14.43±0.26 Duration of Seabass Farming (month)* 20.21±0.66 18.15±0.42 19.11±0.37 19.05±0.29 Seabream's FCR (kg feed/kg fish)* 1.76±0.04 1.83±0.03 1.90±0.03 1.84±0.02 Seabass's FCR (kg feed/kg fish) * 2.03±0.04 1.94±0.02 1.97±0.02 1.98±0.02 Seabream's shrinkage and mortality (%)* 13.35±1.40 9.48±0.36 10.39±0.62 10.70±0.46 Seabass's shrinkage and mortality (%)* 15.82±1.11 13.24±0.63 14.34±0.73 14.33±0.47 *Mean±SEM
T ab le 3 . In p u t co sts, sa les re v en u es a n d u n it p ro fit s b y e n terp rise s sc ale. T ab lo 3 . İşle tm e ölçe klerin e gö re g ird i m ali ye tl eri, sa tı ş g eli rleri ve b iri m k âr. El em en ts o f to tal co st Av era g e co st i n sm all -sc ale en terp rise s (n = 1 5 ) Av era g e co st i n m ed iu m -s ca le e n terp rise s (n = 2 4 ) Av era g e co st i n larg e-sc ale en terp rise s (n = 2 6 ) Av era g e co st i n a ll en terp rise s (n = 6 5 ) S ea b re a m S ea b ass S ea b re a m S ea b ass S ea b re a m S ea b ass S ea b re a m S ea b ass US$ % US$ % US$ % US$ % US$ % US$ % US $ % US$ % Ju v en il e Co st 9 1 9 6 7 1 2 .5 9 1 1 6 9 3 9 1 1 .7 2 3 8 1 1 9 1 5 .2 9 3 5 0 5 9 1 2 .0 8 8 6 8 9 0 6 1 5 .8 3 7 5 4 4 3 8 1 2 .2 0 4 8 7 3 2 2 1 4 .5 7 4 0 0 4 7 6 1 2 .0 0 F ee d Co st 4 6 2 5 4 3 6 1 .0 1 6 2 6 6 0 2 6 3 .2 4 1 6 8 3 1 6 6 4 .5 9 2 5 6 4 4 5 6 3 .4 1 3 5 2 0 6 3 1 6 5 .2 0 4 1 1 3 6 4 3 6 5 .9 6 2 0 1 8 5 1 8 6 3 .6 0 2 1 2 5 0 3 7 6 4 .2 0 L ab o u r Co st 2 6 9 6 3 4 .2 1 4 5 2 5 6 4 .5 1 2 1 4 4 5 3 .6 4 2 1 4 4 5 4 .7 6 1 3 5 3 1 1 3 .1 6 2 2 8 9 3 6 3 .9 5 8 4 5 8 0 3 .6 7 1 2 9 3 4 0 4 .1 4 V it am in s a n d M in era ls Co st 4 6 5 4 0 .5 8 5 0 6 8 0 .5 1 1 5 4 5 0 .6 3 2 2 2 9 0 .5 4 2 9 9 5 3 0 .5 6 3 2 9 0 2 0 .5 3 1 7 9 6 7 0 .5 9 1 7 2 7 9 0 .5 3 F ish Ca re Co st 1 5 5 7 0 .2 1 1 1 7 5 8 1 .2 2 771 0 .2 5 3 6 5 4 1 .2 1 1 3 4 1 4 0 .2 4 8 3 0 8 7 1 .3 6 7 7 2 6 0 .2 3 4 1 9 7 9 1 .2 6 Fu el Co st 1 6 8 3 6 2 .8 1 2 3 2 1 0 2 .4 8 8 6 2 6 2 .2 0 8 7 7 7 2 .1 5 9 0 5 7 9 1 .9 7 1 2 8 3 4 1 2 .1 3 5 5 1 4 1 2 .3 2 6 8 7 4 3 2 .2 5 Drin k in g W ater Co st 394 0 .0 6 563 0 .0 5 181 0 .0 5 181 0 .0 4 2 3 8 3 0 .0 4 3 3 3 8 0 .0 3 1 4 2 2 0 .0 5 1 7 8 8 0 .0 4 S ea Re n tal 1 9 9 8 0 .3 6 2 6 9 3 0 .3 1 1 0 5 2 0 .3 0 2 1 8 5 0 .4 1 9 9 5 5 0 .2 2 1 2 8 4 4 0 .2 4 6 3 0 3 0 .2 9 8 0 0 5 0 .3 2 L o an In tere st 1 2 3 2 0 .2 5 2 0 0 8 0 .2 2 1 7 3 7 0 .2 4 3 2 2 3 0 .2 7 1 0 8 0 2 0 .2 2 1 3 0 8 4 0 .2 1 6 1 1 8 0 .2 4 6 9 8 9 0 .2 3 T ra n sp o rtatio n Co st 1 2 9 9 0 .2 4 1 7 4 2 0 .2 0 335 0 .1 8 452 0 .2 1 5 6 7 1 0 .1 5 9 6 7 3 0 .1 8 3 6 3 2 0 .1 9 5 4 9 3 0 .2 0 In su ra n ce Co st 4 6 2 1 2 .0 4 1 3 3 9 4 1 .0 0 1 0 5 0 2 1 .0 0 4 8 7 8 7 2 .2 3 4 7 4 3 4 0 .7 4 5 2 6 9 0 0 .7 5 3 4 1 9 2 1 .2 6 4 1 4 4 7 1 .3 3 S erv ice P ro cu re m en t 5 0 3 7 0 .5 8 4 4 0 7 0 .4 7 1 2 6 5 0 .5 2 1 2 6 5 0 .3 6 2 8 3 0 9 0 .4 9 2 9 2 4 2 0 .4 5 1 7 6 6 1 0 .5 3 1 4 8 0 0 0 .4 3 Bil g e Co st 827 0 .1 2 1 2 2 9 0 .1 1 650 0 .1 4 1 0 8 9 0 .1 6 5 2 1 6 0 .1 0 6 7 6 2 0 .1 1 3 2 1 1 0 .1 2 3 9 6 8 0 .1 3 Oth er Ex p en se s 1 7 7 9 0 .3 7 2 9 2 8 0 .3 3 2 5 0 5 0 .3 0 4 2 0 5 0 .3 7 1 2 3 1 3 0 .2 7 1 8 0 4 1 0 .3 1 7 1 4 4 0 .3 1 9 6 9 9 0 .3 4 T o tal V ariab le Co st 6 1 7 4 4 2 8 5 .4 3 8 4 7 5 8 7 8 6 .3 7 2 6 9 5 0 1 8 9 .3 3 3 4 5 5 0 1 8 8 .2 0 4 7 4 7 8 8 0 8 9 .1 9 5 4 4 8 9 6 6 8 8 .4 1 2 7 2 3 8 2 1 8 7 .9 8 2 8 4 1 4 3 1 8 7 .6 6 Ov erh ea d Co sts 1 0 8 7 0 .2 3 1 8 1 4 0 .2 0 1 5 5 4 0 .1 8 2 4 7 9 0 .2 2 7 5 5 3 0 .1 7 1 1 1 2 2 0 .1 9 4 3 7 4 0 .1 9 5 9 1 7 0 .2 0 De p re ciatio n Co st 5 4 5 7 3 9 .5 1 9 0 5 6 1 8 .7 8 3 6 5 3 7 6 .2 0 4 0 1 1 0 7 .0 5 3 2 1 7 6 8 6 .4 3 4 2 0 3 9 7 6 .7 3 1 9 2 0 3 0 7 .3 8 2 4 0 3 8 0 7 .5 2 M ain ten an ce a n d Re p air Co st 3 0 2 5 8 4 .8 3 4 6 4 0 6 4 .6 5 2 1 5 0 5 4 .2 9 2 1 5 1 4 4 .5 3 1 9 4 2 0 4 4 .3 0 2 9 4 9 5 8 4 .6 8 1 1 2 2 6 1 4 .4 4 1 5 2 5 9 6 5 .0 1 T o tal F ix ed Co st 8 2 5 7 1 1 4 .5 7 1 3 4 4 0 7 1 3 .6 3 7 2 3 7 3 1 0 .6 7 7 2 3 7 3 1 1 .8 0 5 1 7 5 7 1 1 0 .8 1 7 1 2 2 4 8 1 1 .5 9 2 9 4 7 9 3 1 2 .0 2 3 8 2 3 5 5 1 2 .3 4 T O TAL COST 7 0 0 0 1 2 100 9 8 1 9 9 4 100 3 5 4 4 6 0 100 4 1 7 8 7 4 100 5 2 6 5 4 5 1 100 6 1 6 1 2 1 5 100 3 0 1 8 6 1 4 100 3 2 2 3 7 8 6 100 Co st o f 1 k g 4 .2 3 4 .7 8 3 .3 4 4 .0 9 4 .3 4 4 .5 6 4 .1 8 4 .5 7 Sale s Re v en u e 1 0 4 2 7 1 5 1 2 3 1 8 7 3 2 8 9 2 7 1 1 2 5 6 8 3 0 9 6 8 0 1 7 4 7 7 5 4 8 1 1 2 4 0 2 8 1 9 1 3 9 5 9 0 2 2 Un it P ro fit (US$ /Kg ) 1 .2 9 1 .1 6 1 .3 9 1 .0 8 1 .1 6 0 .9 8 1 .2 9 1 .0 7 *Th e ca lc ulatio ns m ad e in T urk ish L ira (₺ ) w ere c on ve rted in to U S do llar u si ng th e ex ch an ge ra te i n th e re lev an t p erio d (A v ara g e e x ch an g e ra te f o r 2 0 1 4 -2 01 5: US $1 = ₺ 2. 19 ).
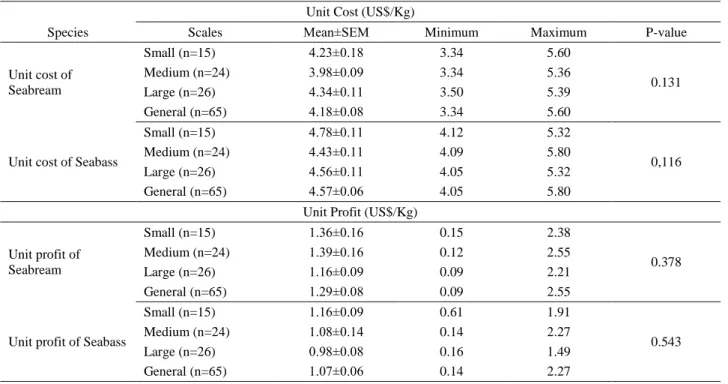
Table 4. Findings on unit cost and profit of Seabream and Seabass in the enterprises. Tablo 4. İşletmelerde çipura ve levrek türünde birim maliyet ve kâra ilişkin bulgular.
Unit Cost (US$/Kg)
Species Scales Mean±SEM Minimum Maximum P-value
Unit cost of Seabream Small (n=15) 4.23±0.18 3.34 5.60 Medium (n=24) 3.98±0.09 3.34 5.36 0.131 Large (n=26) 4.34±0.11 3.50 5.39 General (n=65) 4.18±0.08 3.34 5.60
Unit cost of Seabass
Small (n=15) 4.78±0.11 4.12 5.32
0,116
Medium (n=24) 4.43±0.11 4.09 5.80
Large (n=26) 4.56±0.11 4.05 5.32
General (n=65) 4.57±0.06 4.05 5.80
Unit Profit (US$/Kg) Unit profit of Seabream Small (n=15) 1.36±0.16 0.15 2.38 Medium (n=24) 1.39±0.16 0.12 2.55 0.378 Large (n=26) 1.16±0.09 0.09 2.21 General (n=65) 1.29±0.08 0.09 2.55
Unit profit of Seabass
Small (n=15) 1.16±0.09 0.61 1.91
Medium (n=24) 1.08±0.14 0.14 2.27
0.543
Large (n=26) 0.98±0.08 0.16 1.49
General (n=65) 1.07±0.06 0.14 2.27
Table 5. Comparison of the costs and profits of Seabream and Seabass in the enterprises. Tablo 5. İşletmelerde çipura ve levrek türlerinin maliyet ve kâra göre karşılaştırılması.
Parameters Species Mean±SEM P-value
Unit Cost (US$/Kg) Seabream (n=58) 4.18±0.08 0.001
Seabass (n=51) 4.57±0.06
Unit Profit (US$/Kg) Seabream (n=58) 1.29±0.08 0.033
Seabass (n=51) 1.07±0.06
Table 6. Correlations between the independent variables estimating unit profit in the enterprises. Tablo 6. İşletmelerde birim kârı tahmin eden bağımsız değişkenler arasındaki korelasyonlar.
Variables (Y) (X1) (X2) (X4) (X5)
Unit Profit (Y) 1
Type of Production (X1) -0.050 1
Capacity Utilisation Rate (X2) 0.313** -0.281 1
Sale Price (X4) 0.338** -0.166 -0.311 1
FCR (X5) -0.182** -0.117 -0.032 0.412** 1
**P<0.01
Table 7. Results of the regression analysis for estimating unit profit of enterprises. Tablo 7. İşletmelerde birim kârın tahminine ait regresyon analizi sonuçları.
Variables β (X±Sx) t P R2 F P
Constant -4.870 ±1.566 -3.109 0.002** 0.52 18.116 0.000***
Type of Production (X1) .370 ±0.136 2.716 0.008** Capacity Utilisation Rate (X2) .031 ±0.004 7.327 0.000***
Scale (X3) -.075 ±0.111 -0.672 0.503
Sale Price (X4) .835 ±0.098 8.481 0.000***
FCR (X5) -2.754 ±0.639 -4.307 0.000***
Fish Species (X6) -.347 ±0.192 -1.809 0.073
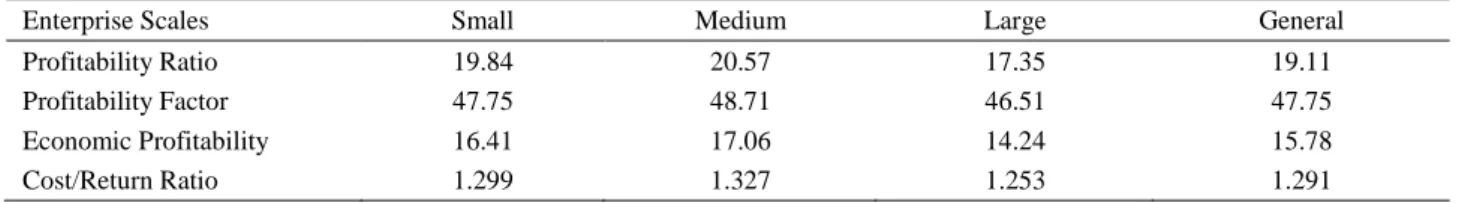
Table 8. Findings on rate of return in the enterprises. Tablo 8. İşletmelerde rantabilite rasyolarına ait bulgular.
Enterprise Scales Small Medium Large General
Profitability Ratio 19.84 20.57 17.35 19.11
Profitability Factor 47.75 48.71 46.51 47.75
Economic Profitability 16.41 17.06 14.24 15.78
Cost/Return Ratio 1.299 1.327 1.253 1.291
There is no statistically significant difference between the enterprise scales in terms of the unit cost and profit of Seabream and Seabass raised in the enterprises (P>0.05), whereas the unit cost of Seabass was found to be 0.39 US$ higher than that of Seabream (P<0.05) and the unit profit of Seabream was 0.22 US$ higher than that of Seabass (P<0.05).
In the enterprises within the scope of the research, the average unit cost of Seabream is 4.18±0.08 US$/kg, and as the scale of enterprises grows, the unit cost first decreases and then increases (P>0.05).
The average unit cost of Seabass among the enterprises is 4.57±0.06 US$/kg, and as the scale of enterprises grows, the unit cost first decreases and then increases (P>0.05).
In the enterprises covered by the study, the average unit profit from sale of Seabream is 1.29±0.08 US$/kg, and as the scale grows, the unit profit first increases and then decreases. The average unit profit from sale of Seabass is 1.07±0.06 US$/kg, and as the scale grows, the unit profit decreases.
According to the results of the regression analysis for
estimating the unit profit of enterprises, no
multicollinearity problem was detected between the
independent variables in the model. R2 in this study shows
that, the unit profit of enterprises, the dependent variable in the model, is explained by 52% of the independent variables. The model's F value was also found to be statistically significant (P<0.001). Accordingly, the multi-regression model of the factors estimating unit profit of enterprises is as follows:
Y = - 4.870 + 0.370X1 + 0.031X2 - 0.075X3 + 0.835X4 -
2.754X5 – 0.347X6 [Equation 4]
It was also found that type of production (X1),
capacity utilisation rate (X2), sale price (X4) and FCR (X5)
had a significant effect on unit profit. According to the model, a one-unit increase in the FCR decreases the unit profit by 2.754 units, a one-unit increase in the sale price increases unit profit by 0.835 unit, a one-unit increase in the capacity utilisation rate increases unit profit by 0.031 unit, and the production of both species increases unit profit by 0.370 unit.
The average profitability ratio in the enterprises is 19.11%, whereas the profitability factor is 47.75% and the
economic profitability is 15.78%. The cost-to-return ratio was calculated to be 1.291.
Discussion and Conclusion
In the aquaculture sector, enterprises need to have the necessary factors of production and use them in the right combination to bring the profits to an optimum level. In order to be able to achieve maximum benefit with minimum costs using the factors of production, the enterprises need to keep track of annual production costs regularly and on a continuous basis.
According to the results of this research, the variable costs of the offshore aquaculture enterprises are lower than those of enterprises carrying out production in net cages (7), earthen ponds (9) and of the Greek and Spanish enterprises (2), and the fixed costs are higher.
In the enterprises within the scope of this research that raise Seabream and Seabass, the juvenile, feed and labour costs are of primary importance.
In the enterprises using net cages, feed cost has the largest share among the production inputs. While the compositions and unit prices of the feeds used for Seabream farming and Seabass farming do not differ, the share of feed cost in the total cost is higher in Seabass farming, as its term of production is longer.
The share of feed costs in the total costs of Seabream and Seabass production in net cages in Turkey is higher than that in other countries. The share of feed cost in the total costs of the enterprises farming Seabream and Seabass ranges from 47.60% to 47.90% in Greece and 38.01% to 38.10% in Spain, which are the leader countries in the sector (2).
The feed costs incurred by the enterprises in Turkey are directly associated with the price of fish meal. Since the price of fish meal depends on exchange rates and the domestic production of fish meal is not sufficient to meet the domestic demand, the integrated companies operating in the sector rely on foreign sources to meet their demand for fish meal.
The share of juvenile fish cost in the total cost for both species increase as the scale of enterprises grow. The difference between the juvenile fish costs of the two species arises from the fact that the unit price of juvenile Seabream is somewhat higher than that of juvenile Seabass in the hatcheries.
Ertekin (4) found that the share of juvenile fish cost in total costs of farming in net cages was 12.28% for Seabream and 12.29% for Seabass. Other relevant literature findings indicate that the share of juvenile fish cost in the variable costs ranges from 6.30% to 10.43% in net cages (7) and from 8.63% to 11.67% in earthen ponds (9).
The share of labour cost in total costs of offshore enterprises in Turkey is lower compared to the enterprises in other countries farming Seabream and Seabass. It was reported that share of labour costs in total costs of Greek enterprises ranged from 15.03% to 17.96% and the share of labour costs in total costs of Spanish enterprises ranged from 18.06% to 18.10% (2).
In a research report on the market structure of Seabream and Seabass, it was noted that the feed, juvenile and labour costs constituted 70% of the total cost of production, and that there was no significant difference between the dominant countries in the market, excluding Turkey, for the reason that the producer countries have reached maximum efficiency in terms of the three cost items specified. It was also stated that this discrepancy in Turkey was associated with the fact that the labour costs were 1.10 EUR/kg in Italy, 0.55 EUR/kg in Greece and 0.30 EUR/kg in Turkey, which provides Turkey with an advantage in terms of exports (15).
The higher cost of fish care in farming Seabass compared to Seabream is associated with the fact that juvenile Seabasses are subjected to sizing and counting as well as being inoculated.
Ertekin (4) noted that the share of depreciation cost and of maintenance and repair costs in the total costs of enterprises farming both species in net cages were 3.87% and 3.11%, respectively.
The higher share of depreciation and maintenance/ repair costs in the total costs in this study than the abovementioned study may be associated with the fact that the production mechanization in the explored enterprises is advanced, resulting in increased costs.
The feed conversion ratio (FCR) is one of the most common parameters used in fish farming enterprises to determine the performance levels. When evaluating the previous studies of Turkey in terms of FCR; Aegean and Mediterranean regions showed an average rate of 1.8 (kg feed/kg fish) in both sea bream and sea bass grown in cages (4), also in the Middle-North Aegean region the average rate was reported to be between 1.8-2.4 in sea bream and 1.7-2.2 in sea bass as well as in the Southern Aegean-West Mediterranean region the values found as between 1.6-2.5 for sea bass and 1.5-2.2 (kg feed/kg fish) for sea bream (22).
The studies conducted on the same subject report that the unit costs of Seabream and Seabass range from 7.59
TL/kg and 13.20 TL/kg, and 2.34 US$ and 4.98 US$, respectively (4, 20, 7, 10, 14).
The cost of producing Seabream and Seabass in Greece was reported to be 2.2 US$/kg, with their sale price ranging from 4 US$/kg to 4.5 US$/kg and their average unit profit being 2 US$/kg. Greece has an advantageous position in creating markets, thanks to the subsidies granted by the EU (18).
In a study theoretically comparing the investment costs of two enterprises farming Seabream and Seabass in offshore and onshore net cages in the Mediterranean Sea, Lisac and Muir (12) found that the cost of production and the unit profit were 6.33 US$/kg and 1.69 US$/kg in the offshore enterprise and 7.77 US$/kg and 0.25 US$/kg in the onshore enterprise, respectively. They also noted that profit margin of the onshore enterprises was lower, as their variable costs were higher than that of the offshore enterprises.
Considering that a significant portion of the aquaculture enterprises in Muğla have for long specialized in the aquaculture sector, that the companies providing services to the enterprises have been concentrated in the region of production, that the products are exported to many countries, most notably EU countries, and their added value is enhanced, and taking into account the employment opportunities in the sector, the aquaculture farming has a considerable potential for socioeconomic growth. In order to be able to ensure sustainability of this potential, measures should be taken to ensure capacity growth in the small-scale enterprises and to increase profitability and productivity in the medium- and large-scale enterprises.
Our study verified that, although the primary input is feed, the sector increasingly relies on foreign sources in procuring feed raw materials. The fact that the fish meal and fish oil used in fish feed are imported and the feed companies seek to take advantage of vegetable protein resources to reduce their costs affects the FCR, resulting in prolonged production time and increased cost of production due to increased need for feeding the fish.
Consequently, in the process from research and development efforts to publicity and promotional activities in the market, investing in the diversification of production of alternative non-carnivorous species similar to Seabream and Seabass, which can be produced in farms and have a lower requirement for animal protein and fat, is important for the future of the sector.
In conclusion, with the contribution of our data it is plausible to say that, in the field of aquaculture farming, it would be useful to address and explore many issues such as the ways of increasing profitability by effective use of resources, determination of middleman commissions, market interactions of fishing and aquaculture products, ways of increasing productivity, structure of consumption
and demand, identification of consumer preferences, and rational production planning, and to conduct economic studies on these issues.
Acknowledgements
This research was supported by the Scientific and Technical Research Council of Turkey (TUBITAK), Scientific Research Project Fund-1002 (TUBITAK-TOVAG Project Number: 214O698). We would like to thank Turkish Aquaculture Producers Central Union (SUYMERBIR) and Muğla Aquaculture Fishermen’s Association for their kindly help in field studies and coordination with the aquaculture enterprises.
References
1. Ahmed N, Ahammed F, Van Brakel, M (2008): An economic analysis of freshwater prawn, Macrobrachium rosenbergii, farming in Mymensingh, Bangladesh. JWAS, 39, 37-50.
2. Barazi-Yeroulanos L (2010): Synthesis of mediterranean marine finfish aquaculture - a marketing and promotion strategy. Studies and Reviews-General Fisheries Comission for the Mediterranean, FAO, Rome, Italy.
3. Brugere C, Soto D, Bartley DM (2007): Comparative environmental costs of aquaculture and other food production sectors: environmental and economic factors conditioning the global development of responsible aquaculture. 25-36. In: Bartley DM, Brugere C, Soto D, Gerber P, Harvey B (Ed), Comparative Assessment of the Environmental Costs of Aquaculture and other Food Production Sectors: Methods for Meaningful Comparisons. FAO/WFT Expert Workshop, Vancouver, Canada. 4. Ertekin H (2011): Comparative economic analysis Seabass
(Dicentrarchus labrax) in earthen ponds and sea cages. Graduate School of Natural and Applied Sciences of Selçuk University, M.Sc. Thesis. Konya, Turkey.
5. Gammanpila M, Singappuli MS (2014): Economic viability of Asian Seabass (Lates calcarifer) and Tilapia (Oreochromis niloticus) small scale aquaculture systems in Sri Lanka. Sri Lanka J. Aquat. Sci, 17, 47-57.
6. Gökhan EE (2003): Malatya ve çevre iller alabalık işletmelerinde kaynak kullanımında etkinlik ve verimlilik. DAUM, 2, 164-172.
7. Gündoğmuş E, Tekelioğlu N, Gökçe G, et al. (2010): Economic performance of Seabass and Seabream culture. Japan International Cooperation Agency Turkey Office, Turkey.
8. Kalaycı S (2010): SPSS Appilied Multivariate Statistical Techniques. Asil Publishing, Ankara, Turkey.
9. Kiştin F (2011): Economical analysis of Seabream-Seabass aquaculture farms in earthen ponds: Muğla province Milas district case. Graduate School of Natural and Applied Sciences of Akdeniz University, M.Sc. Thesis. Antalya, Turkey.
10. Koçak Ö, Tatlidil FF (2004): Cost analysis gilthead Seabream and Seabass production in Milas district-Muğla province, Turkey. TrJFAS, 4, 33-38.
11. Kohler H (1985): Statistics for Business and Economics. Scott Foresman, USA.
12. Lisac D, Muir J (2000): Comparative economics of offshore and mariculture facilities. 203-211. In: Muir J, Basurco B (Ed), Mediterranean Offshore Mariculture. CIHEAM, Zaragoza.
13. Özdamar K (2001): Biostatistic with SPSS. Kaan Press, Eskişehir, Turkey.
14. Peker K, Ertekin H (2011): Economic analysis and development strategies of Seabass enterprises in the mediterranean region of Turkey. Bulletin UASVM Horticulture, 68, 156-159.
15. Roth E (2004): Study of the market for aquaculture produced Seabass and Seabream species. European Commission DG Fisheries Final Report, University of Stirling Institute of Aquaculture, Department of Marketing. 16. RTMD. Republic of Turkey Ministry of Development (2014): Republic of Turkey Ministry of Development, 10th
Development Plan (2014-2018). Special report on fisheries commission, Ankara, Turkey.
17. RTMFAL. Republic of Turkey Ministry of Food, Agriculture and Livestock (2016): Aquaculture products statistics
http://www.tarim.gov.tr/sgb/Belgeler/SagMenuVeriler/BS GM.pdf. (28.10.2016).
18. RTMSPO. Republic of Turkey Ministry of State Planning Organization (2007): 9th Development Plan (2007-2013). Special report on fisheries commission. Ankara, Turkey.
19. Sümbüloğlu K, Sümbüloğlu V (1997): Sampling Methods. Hatipoğlu Press, Ankara, Turkey.
20. Tosun DD (2010): Structural and economical analysis of Seabass (Dicentrarchus labrax, L., 1758) farms in Blacksea and Aegean regions. Graduate School of Natural and Applied Sciences of İstanbul University, Ph. D. Thesis. İstanbul, Turkey.
21. TSI. Turkish Statistical Institute (2016): Aquaculture products statistics.
https://biruni.tuik.gov.tr/medas/?kn=97&locale=tr. (15.12.2016).
22. Yıldırım Ş, Alpbaz A (2005): An investigation on some of the production area characteristics of the fish farms in Turkish seas whose annual productions are 100 tonnes and over. EgeJFAS, 22, 53-58.
Geliş tarihi : 20.12.2017 / Kabul tarihi : 09.03.2018 Address for Correspondence:
Asst. Prof. Dr. Mehmet Saltuk ARIKAN
Fırat University, Faculty of Veterinary Medicine
Department of Animal Health Economics and Management 23119 Elazığ, Turkey