Ultrasonics Sonochemistry 72 (2021) 105421
Available online 30 December 2020
1350-4177/© 2020 The Author(s). Published by Elsevier B.V. This is an open access article under the CC BY-NC-ND license (http://creativecommons.org/licenses/by-nc-nd/4.0/).
Ultrasonic-assisted production of precipitated calcium carbonate particles
from desulfurization gypsum
Mahmut Altiner
a,*, Soner Top
b, Burçin Kaymako˘glu
caDepartment of Mining Engineering, Çukurova University, Adana 01330, Turkey
bDepartment of Materials Science and Nanotechnology Engineering, Abdullah Gul University, Kayseri 38080, Turkey cDepartment of Materials Engineering, Adana Alparslan Turkes Science and Technology University, Adana 01250, Turkey
A R T I C L E I N F O Keywords:
Gypsum
Precipitated calcium carbonate Venturi tube
Ultrasonication Calcite Vaterite
A B S T R A C T
This study aimed to investigate the effect of ultrasonic application on the production of precipitated calcium carbonate (PCC) particles from desulfurization gypsum via direct mineral carbonation method using conven-tional and venturi tube reactors in the presence of different alkali sources (NaOH, KOH and NH4OH). The venturi tube was designed to determine the effect of ultrasonication on PCC production. Ultrasonic application was performed three times (before, during, and after PCC production) to evaluate its exact effect on the properties of the PCC particles. Scanning electron microscope (SEM), X-ray diffraction (XRD), Atomic force microscope (AFM), specific surface area (SSA), Fourier transform infrared spectrometry (FTIR), and particle size analyses were performed. Results revealed the strong influence of the reactor types on the nucleation rate of PCC particles. The presence of Na+
or K+
ions in the production resulted in producing PCC particles containing only calcite crystals, while a mixture of vaterite and calcite crystals was observed if NH4+ions were present. The use of ultrasonic power during PCC production resulted in producing cubic calcite rather than vaterite crystals in the presence of all ions. It was determined that ultrasonic power should be conducted in the venturi tube before PCC production to obtain PCC particles with superior properties (uniform particle size, nanosized crystals, and high SSA value). The resulting PCC particles in this study can be suitably used in paint, paper, and plastic industries according to the ASTM standards.
1. Introduction
Precipitated calcium carbonate (PCC) particles can be prepared with different properties, which play a crucial role in their use in the industry. Owing to its nontoxic property, it is highly used in various applications such as drug carrier [1,2], paint [3], papermaking [4], and hydrophobic coating [5]. Owing to the importance of the properties of PCC particles in these sectors, many studies have been conducted regarding the pro-duction of PCC particles with different polymorphs such as calcite [6], aragonite [7,8], vaterite [9], and amorphous PCC [10]). The particle size distributions and crystal shapes are also studied from different re-sources such as industrial tailings [11–15], dolomite [7,16], lime [17], or limestone [18]), using different production methods, including chemical precipitation [19,20] and mineral carbonation [21]. Re-searchers [22] indicate that many reactors are designed to be used for the production of PCC particles.
Recently, several studies have evaluated the effect of ultrasonic
treatment in the production of different materials with extraordinary properties [23–31]. Conducting ultrasonic irradiation accelerated the carbonation mechanism resulting in a faster production of PCC particles was determined [23,24,30,31]. During production, formed PCC parti-cles were crushed and the corresponding particle morphology was altered owing to a shaping effect, which led to the formation of spherical particles rather than other crystal shapes [32]. PCC particles produced with the use of ultrasonication exhibited reduced particle size (3 µm) compared to that without ultrasonication (12 µm) [28,29,33]. Mean-while, studies on the polymorph (d50) properties of PCC particles revealed that after ultrasonic treatment, vaterite transformed into aragonite crystals [28,34]. However, vaterite crystals were observed rather than calcite crystals in the acquired X-ray diffraction patterns
[29].
Presently, no general opinion has been made on how and at what stage ultrasonic treatment will yield best results. Moreover, the exact effect of ultrasonic treatment is still under discussion. This study aims to
* Corresponding author.
E-mail address: maltiner@cu.edu.tr (M. Altiner).
Contents lists available at ScienceDirect
Ultrasonics Sonochemistry
journal homepage: www.elsevier.com/locate/ultson
https://doi.org/10.1016/j.ultsonch.2020.105421
determine the role of ultrasonic treatment on the production of PCC particles from desulfurization gypsum (DG, CaSO4⋅2H2O) by conducting the direct mineral carbonation method in the presence of various chemicals (NaOH, KOH and NH4OH). Ultrasonic power was applied three times as follows: (1) before, (2) during, and (3) after the PCC production. Three reactors (conventional, venturi tube, and venturi tube with an ultrasonic probe) were used. A new venturi tube was designed to use ultrasonic power in the carbonation zone during PCC production. This study is the first to create a carbonation zone, where the solution under a turbulent flow was exposed to ultrasonic power using the new apparatus. The pH of the solution was monitored in each experiment. Experimental findings obtained in this study were discussed in detail by conducting some instrumental analyses such as particle size distribution, scanning electron microscopy (SEM), specific surface area (SSA) char-acterization, X-ray diffraction (XRD), atomic force microscopy (AFM), and Fourier transform infrared spectrometry (FTIR).
2. Experimental procedure 2.1. Materials
DG particles were provided from a thermal power station in Adana/ Turkey. The chemical composition of DG determined using X-ray fluo-rescence (Panalytical, MiniPal XRF) was: 46.51% SO3, 32.50% CaO, 19.70% H2O, and 1.29% impurities (Al2O3, MnO, and Fe2O3). CO2 gas (purity, 99.99%) was purchased from Cangaz, Adana. Tap water (19.0 mg/L Cl, <44 mg/L Ca, 0 mg/L CaCO3, 21.9 mg/L Mg, <0.02 mg/L Al) was used in each experiment. NaOH, KOH, and NH4OH (Sigma Aldrich) were of analytical grade and used without conducting any purification. Smooth and well-crystallized DG particles with streaky structures were obtained, as shown in the SEM image in Fig. 1.
2.2. Method
The conversion of DG to PCC particles was conducted using a direct carbonation method, where the formation of calcium hydroxide and its transformation into PCC particles occurred at the same time. The cor-responding chemical reaction followed the equation below.
CaSO4⋅2H2O + 2XOH + CO2 → CaCO3 +X2SO4 +3H2O(1) where X can be Na+, K+or NH
4
+ions based on chemicals used. Parameters used to prepare PCC particles from DG were as follows: 5- g DG, 2:1 M ratio of [OH]−/Ca2+, 1:20 of solid-to-liquid ratio (g:mL), 1 L/min of CO2 flow rate, 250 rpm of stirring speed at a temperature of 20 ◦C. In the experiments, conventional and venturi tube carbonation
reactors were used separately. Ultrasonic-assisted production was con-ducted using Bandelin sonicator (SONOPULS HD 2070.2) with a fre-quency of 20 kHz. A titanium flat probe tip (TT13, diameter: 6 mm, length: 116 mm) was fixed to the ultrasonic converter. The equipment was adapted to the venturi tube carbonation reactor to determine the effect of ultrasonic power on the production of PCC particles. Conven-tional and venturi tube reactors used in this study are shown in Fig. 2. The experimental apparatus was divided into different parts: (1) a sta-bilization tank, (2) mechanical stirrer, (3) pump for liquid circulation, (4) venturi tube for mixing solution and CO2 gas (this was only for the venturi tube reactor), (5) CO2 gas, (6) CO2 flow meter, and (7) data logger (pH meter, Gondo, PL-700AL) to monitor pH value of the solution in the reactor. The Reynolds number of the solution that circulated in the venturi tube reactor was found to be 1858 × 106, indicating that the turbulent flow in the reactor occurred (Fig. 2(c)–(d)). The working principle of this apparatus was explained in detail in our previous study
[12]. In each experiment, the CO2 flow was switched off to complete the carbonation when the pH of the solution decreased to the desired level. The solid-to-liquid separation was performed and the obtained product was dried at 105 ◦C for 4 h in an oven. Finally, samples were prepared for different characterizations.
The experimental conditions conducted along with their corre-sponding notations are summarized in Table 1. For instance, the nota-tion K-V-UA indicates that PCC particles were produced using the venturi tube as a carbonation zone in the presence of K+ions and ob-tained PCC particles were exposed to the ultrasonic power after the experiment. UA indicates that the ultrasonic power was applied after the PCC production, whereas UB in the experiment code reveals that the ultrasonic power was applied before switching on CO2 flow. US indicates that the ultrasonic power was applied during the production of PCC particles. The amplitude of the ultrasonic power was kept as 100%. The application time for UA- and UB-coded experiments was 2 min whereas ultrasonic power with the highest amplitude was applied until the re-action was complete for US-coded experiments. Furthermore, UN in-dicates that no ultrasonic power was applied in the experiment.
2.3. Characterization test
Phase properties of the produced PCC particles were evaluated using an XRD, Rigaku Miniflex II and Bruker D8 Discover) equipped with Cu–Ka radiation in the 2ø range of 15˚–85˚with a 0.02-step size. The obtained patterns were examined using PDXL and Diffrac-suite EVA software for mineral identification, while Rietveld analysis was per-formed using a Diffrac-suite TOPAS software. Surface morphologies of the PCC particles were imaged by SEM (Gemini 300, Zeiss), and the particle size distribution of the PCC particles was determined using Malvern Mastersizer (300H). The surface topology of the selected PCC particles was measured by AFM (NanoSurf Flex Amf C3000) in static mode. FTIR (Thermo Scientific Nicolet 6700) analysis was used to evaluate the polymorphic transformation of the selected PCC particles.
3. Results and discussion
3.1. Effect of ultrasonic treatment on the reaction time required for producing PCC particles
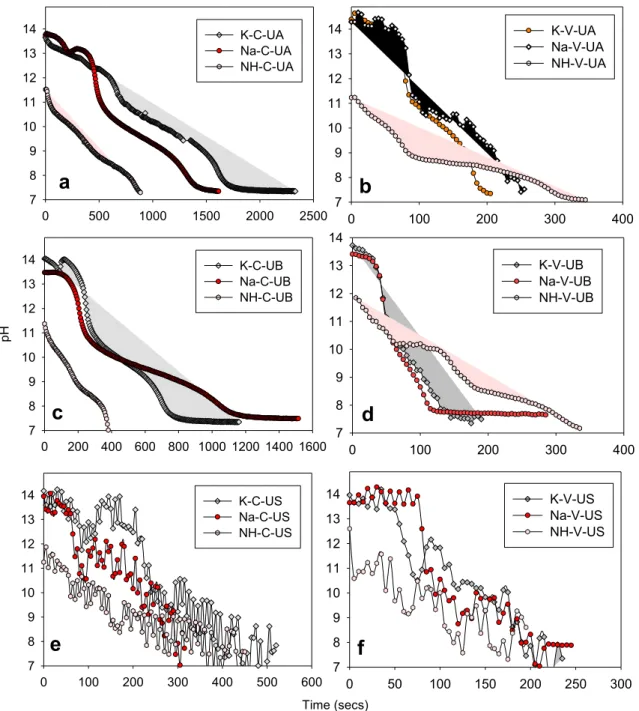
A series of experiments were performed to evaluate the production conditions used for producing PCC particles. Fig. 3 shows the change in the pH of the solution during carbonation where three reactors (con-ventional, venturi tube, and ultrasonic probe adopted to the venturi tube) were used. The decrease in pH from 12 to ~7.50 was owing to the reaction of Ca2+ions with CO2 gas in the solution. This implies that the dissolution of CO2 as HCO3− ions in the reactor results in an acidic so-lution [35]. The reaction was completed when the pH of the solution decreased to approximately 7.50 to prevent the dissolution of obtained PCC particles. The observed cavitation owing to the ultrasonic power
resulted in obtaining a bumpy decreasing trend in the pH of the solution (Fig. 3(e) and (f)).
The required reaction time for producing PCC particles was strongly dependent on the type of carbonation reactor. Shorter reaction time was required for producing PCC particles from DG via the venturi tube, which was used as the carbonation zone, compared to the conventional carbonation reactor. Using Na+ions, the required time for PCC particle production was 1435 and 250 s for the conventional reactor (exp. code; Na-C-UA, Fig. 2(a)) and venturi tube reactor (experiment code; Na-V- UA, Fig. 2(b)), respectively. This agreed well with those from our pre-vious study and indicated that the venturi tube had a strong effect on the precipitation rate of PCC [12]. Furthermore, the use of ultrasonic treatment in the carbonation zone of the venturi tube resulted in a faster reaction due to the higher nucleation rate of PCC particles (experiment code; Na-C-UV and Na-V-US, Fig. 2(e) and (f).).
The nucleation rate (NR) of PCC particles was strongly influenced by the reaction conditions. Table 2 shows the calculated NR values based on the pH curves given in Fig. 3. In the presence of Na+ions, the NR values of PCC were found to be 20.28, 20.78, and 66.13 µM/s under the con-ditions of Na-C-UA, Na-C-UB, and Na-C-US, respectively.
Higher NR was achieved using venturi tubes as carbonation zone compared with that using conventional carbonation reactor. The NR
value of PCC obtained with the use of the venturi tube was 116.39, 102.10, and 132.26 µM/s for Na-V-UA, Na-V-UB, and Na-V-US, respec-tively. The adaptation of the ultrasonic probe to the venturi tube resulted in increased NR values for producing PCC particles. According to the NR values obtained in this study, the reactors were ordered as follows (from the highest to the lowest) (1) ultrasonic adopted to the venturi tube, (2) venturi tube, and (3) conventional reactor.
3.2. The effect of ultrasonic treatment on the properties of PCC particles 3.2.1. Ultrasonic treatment after the production of PCC particles
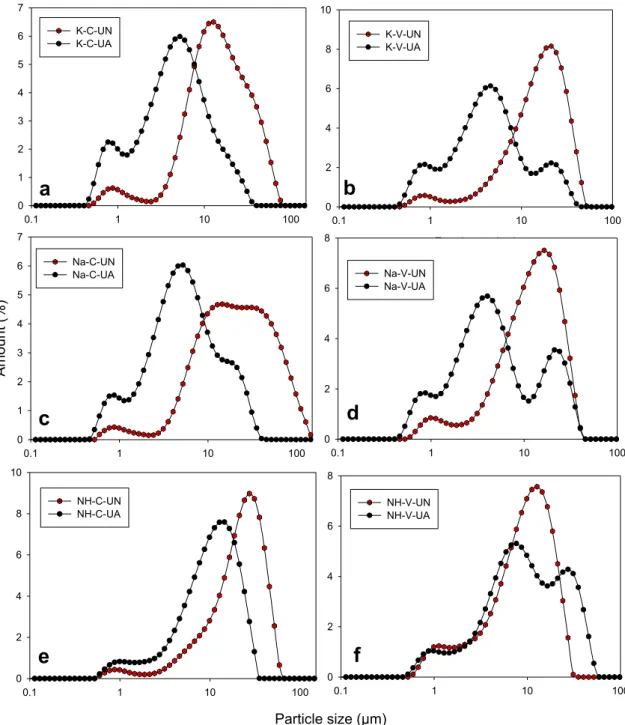
In this stage, an ultrasonic treatment with an amplitude of 100% was applied for 2 min after the production of PCC particles using conven-tional and venturi tube reactors. Fig. 4 shows the particle size distri-bution of PCC particles, which were obtained from two stages: (1) when CO2 was switched off and (2) after applying the ultrasonic treatment on the prepared PCC particles. The particle size values of d10, d50, d90, and SPAN factor for PCC particles are given in Table S1. A unimodal particle size distribution of PCC particles was obtained with a peak value greater than 9 µm, corresponding to the d50 values of each PCC particle obtained without ultrasonic treatment. With applied ultrasonic treatment, clus-tered crystals in PCC crushed into small particles owing to the cavitation effect, which resulted in a bimodal particle size distribution and reduced average particle size (d50) of the produced PCC particles. A similar behavior was observed with previous studies [25,26,28] where one suggested that the use of ultrasonic treatment led to obtaining vaterite crystals with smaller particle sizes [28]. Here, the d50 value of PCC particles in the presence of K+ions was found to be 4.83 and 4.55 µm for the conventional reactor and the venturi tube reactor, respectively. In the presence of Na+ions, the d
50 value of PCC particles was found to be 5.44 and 4.64 µm for the conventional and venturi tube reactors, respectively. Alternatively, PCC particles with d50 values of 11.20 and 8.87 µm were prepared in the presence of NH4+ions for the conventional and venturi tube reactors, respectively.
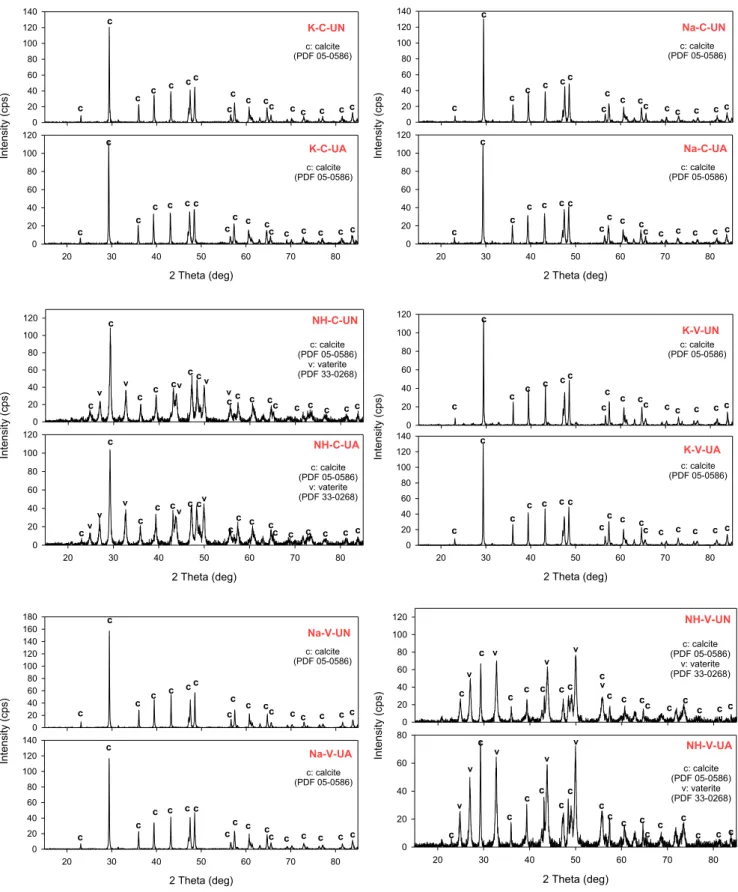
The polymorphs of produced PCC particles were determined by XRD analysis (Fig. 5). It was clear that the polymorph properties of PCC particles were not influenced by the types of reactors. Similar results were obtained with the use of a conventional reactor or venturi tube reactor. All PCC particles with sharp peaks corresponding to calcite crystals in an XRD analysis were obtained in the presence of K and Na+ ions (exp. code: K-C-UN, Na-C-UN, K-V-UN, and Na-V-UN), whereas a mixture of calcite and vaterite crystals in PCC particles were obtained as NH4+ions resulted in producing vaterite crystals (exp. code: NH-C-UN and NH-V-UN).
Many studies have focused on the effect of ultrasonic treatment on the polymorph properties of PCC particles [25]. The ultrasonic treat-ment resulted in transforming metastable vaterite into calcite crystals, which are the most stable CaCO3 mineral under ambient atmosphere conditions [25]. When the ultrasonic treatment was applied in this study, no change was observed in the polymorph properties of all pro-duced PCC particles. After conducting the ultrasonic treatment, calcite crystals in PCC particles were observed under the conditions of K-C-UA, Na-C-UA, K-V-UA, and Na-V-UA, while a mixture of calcite and vaterite in PCC particles were determined for experiments under the conditions of NH-C-UA and NH-V-UA. Although no polymorph change was observed in the PCC particles with NH4+ions, a ratio of calcite and vaterite in PCC particles increased after the ultrasonic treatment, as revealed by the Rietveld analysis given in Table S2. The proportion of calcite crystals in the produced PCC particles was found to be 53.64% under the NH-C-UN condition. After applying ultrasonic treatment (100% amplitude and 2 min), the proportion of calcite crystals in PCC particles increased to 56.44% (exp. code: NH-C-UA). Similar results were observed in the PCC particles obtained using the venturi tube (exp. code: NH-V-UN and NH-V-UA). However, these findings do not agree with those from the previous study, in which ultrasonic treatment pro-motes an increase in the proportion of vaterite crystals [25,36].
Table 1
Experimental conditions for producing PCC from DG.
Experiment
no Experiment code Alkali source Reactor type When was ultrasonic power applied? 1 K-C-UN KOH Conventional No applied 2 K-C-UA KOH Conventional After the PCC
production 3 Na-C-UN NaOH Conventional No applied 4 Na-C-UA NaOH Conventional After the PCC
production 5 NH-C-UN NH4OH Conventional No applied 6 NH-C-UA NH4OH Conventional After the PCC
production 7 K-V-UN KOH Venturi tube No applied 8 K-V-UA KOH Venturi tube After the PCC
production 9 Na-V-UN NaOH Venturi tube No applied 10 Na-V-UA NaOH Venturi tube After the PCC
production 11 NH-V-UN NH4OH Venturi tube No applied 12 NH-V-UA NH4OH Venturi tube After the PCC
production 13 K-C-UB KOH Conventional Before the PCC
production 14 Na-C-UB NaOH Conventional Before the PCC
production 15 NH-C-UB NH4OH Conventional Before the PCC
production 16 K-V-UB KOH Venturi tube Before the PCC
production 17 Na-V-UB NaOH Venturi tube Before the PCC
production 18 NH-V-UB NH4OH Venturi tube Before the PCC
production 19 K-C-US KOH Conventional During the PCC
production 20 Na-C-US NaOH Conventional During the PCC
production 21 NH-C-US NH4OH Conventional During the PCC
production 22 K-V-US KOH Venturi tube During the PCC
production 23 Na-V-US NaOH Venturi tube During the PCC
production 24 NH-V-US NH4OH Venturi tube During the PCC
production
Na = NaOH, K = KOH, NH = NH4OH, V = Venturi tube reactor, C = Conven-tional reactor.
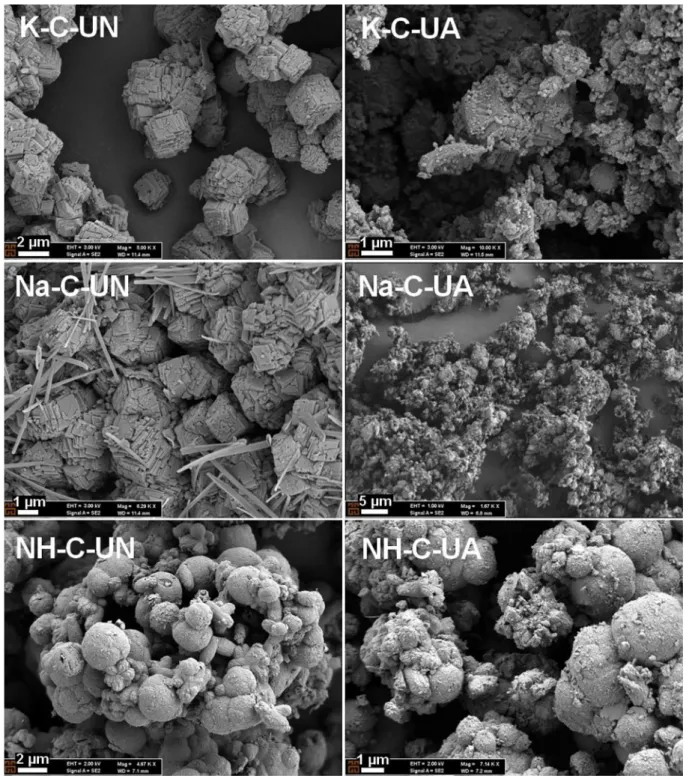
Furthermore, the amorphous ratio in all PCC particles increased, indicating that the surface structures in PCC particles were damaged due to the cavitation effect. Therefore, peak intensities representing the calcite and vaterite crystals decreased. To confirm, SEM images of pro-duced PCC particles were taken before and after the ultrasonic treatment as shown in Figs. 6 and 7. Agglomerated cubic crystals (approximately 1
µm) were observed when the PCC particles were produced in the pres-ence of K+or Na+ions. Smaller cubic crystals (approximately 400 nm) were produced via the venturi tube reactor compared to the conven-tional reactor. The acquired XRD spectra identified the PCC, which contained cubic crystals as a typical calcite. This further verified the SEM results. 0 500 1000 1500 2000 2500 7 8 9 10 11 12 13 14 K-C-UA Na-C-UA NH-C-UA
0
100
200
300
400
7
8
9
10
11
12
13
14
K-V-UA
Na-V-UA
NH-V-UA
0 200 400 600 800 1000 1200 1400 1600 pH 7 8 9 10 11 12 13 14 K-C-UB Na-C-UB NH-C-UB Time (secs) 0 100 200 300 400 500 600 7 8 9 10 11 12 13 14 K-C-US Na-C-US NH-C-US0
50
100
150
200
250
300
7
8
9
10
11
12
13
14
K-V-US
Na-V-US
NH-V-US
a
b
c
e
f
0
100
200
300
400
7
8
9
10
11
12
13
14
K-V-UB
Na-V-UB
NH-V-UB
d
Fig. 3. Change in pH values of the solution in the presence of different alkali sources: (a) C-UA, (b) V-UA, (c) C-UB, (d) V-UB, (e) C-US and (f) V-US.
Table 2
Nucleation rate (NR) of PCCs and required reaction time at different production conditions.
Exp. Code NR (µM/s) Reaction Time (s) Exp. Code NR (µM/s) Reaction Time (s) Exp. Code NR (µM/s) Reaction Time (s)
K-C-UA 16.53 1760 K-C-UB 36.60 795 K-C-US 92.37 315
Na-C-UA 20.28 1435 Na-C-UB 20.78 1400 Na-C-US 66.13 440
NH-C-UA 34.43 845 NH-C-UB 77.59 375 NH-C-US 64.66 450
K-V-UA 149.22 195 K-V-UB 153.14 190 K-V-US 149.22 195
Na-V-UA 116.39 250 Na-V-UB 102.10 285 Na-V-US 132.26 220
NH-V-UA 100.34 290 NH-V-UB 93.86 310 NH-V-US 176.35 165
0.1 1 10 100 0 1 2 3 4 5 6 7 K-C-UN K-C-UA 0.1 1 10 100
)
%(
tn
uo
m
A
0 1 2 3 4 5 6 7 Na-C-UN Na-C-UAParticle size (µm)
0.1 1 10 100 0 2 4 6 8 10 NH-C-UN NH-C-UA Tane boyutu (µm) 0.1 1 10 100 0 2 4 6 8 10 K-V-UN K-V-UA 0.1 1 10 100 0 2 4 6 8 Na-V-UN Na-V-UA 0.1 1 10 100 0 2 4 6 8 NH-V-UN NH-V-UAa
b
c
d
e
f
Fig. 4. Particle size distribution of produced PCC particles under the condition of (a) K-C-UN and K-C-UA, (b) Na-C-UN and Na-C-UA, (c) NH-C-UN and NH-C-UA, (d) K-V-UN and K-V-UA, (e) Na-V-UN and Na-V-UA, (f) NH-V-UN and NH-V-UA.
0 20 40 60 80 100 120 140 K-C-UN 2 Theta (deg) 20 30 40 50 60 70 80 )s pc( yti sn et nI 0 20 40 60 80 100 120 K-C-UA c c c c c c c cc c cc c c c cc c c c c c c c cc c cc c c c c c c: calcite (PDF 05-0586) c: calcite (PDF 05-0586) 0 20 40 60 80 100 120 140 Na-C-UN 2 Theta (deg) 20 30 40 50 60 70 80 )s pc( yti sn et nI 0 20 40 60 80 100 120 Na-C-UA c c c c c c c cc c cc c c c cc c c c c c c c cc c cc c c c c c c: calcite (PDF 05-0586) c: calcite (PDF 05-0586) 0 20 40 60 80 100 120 NH-C-UN 2 Theta (deg) 20 30 40 50 60 70 80 )s pc( yti sn et nI 0 20 40 60 80 100 120 NH-C-UA c c c c c c c c c c cc c c c cc c c c c c c c cc c cc c c c c c c: calcite (PDF 05-0586) v: vaterite (PDF 33-0268) c: calcite (PDF 05-0586) v: vaterite (PDF 33-0268) v v v v v v v v v v 0 20 40 60 80 100 120 K-V-UN 2 Theta (deg) 20 30 40 50 60 70 80 )s pc( yti sn et nI 0 20 40 60 80 100 120 140 K-V-UA c c c c c c c cc c cc c c c cc c c c c c c c cc c cc c c c c c c: calcite (PDF 05-0586) c: calcite (PDF 05-0586) 0 20 40 60 80 100 120 140 160 180 Na-V-UN 2 Theta (deg) 20 30 40 50 60 70 80 )s pc( yti sn et nI 0 20 40 60 80 100 120 140 Na-V-UA c c c c c c c cc c cc c c c cc c c c c c c c cc c cc c c c c c c: calcite (PDF 05-0586) c: calcite (PDF 05-0586) 0 20 40 60 80 100 120 NH-V-UN 2 Theta (deg) 20 30 40 50 60 70 80 )s pc( yti sn et nI 0 20 40 60 80 NH-V-UA c c c c c c c c c c cc c c c cc c c c c c cc c c c c c c c c c c c: calcite (PDF 05-0586) v: vaterite (PDF 33-0268) c: calcite (PDF 05-0586) v: vaterite (PDF 33-0268) v v v v v v v v v v
The PCC particles produced in the presence of NH4+ions had sphe-roidal and cubic crystals, which represent vaterite and calcite minerals, respectively. Coarse cubic crystals obtained under the K-C-UN and Na-C- UN conditions were destroyed and transformed into irregular or amor-phous shapes via the ultrasonic treatment conducted after PCC pro-duction. No significant change was observed in the SEM images of the produced PCC particles before and after the ultrasonic treatment using the venturi tube reactor. However, the crystal size of PCC decreased via the ultrasonic treatment (from 400 to ~300 nm). Alternatively, no change in the crystal size was observed in the presence of NH4+ions after the application of ultrasonic treatment. Spheroidal crystals were not destroyed as shown in the SEM images (NH-C-UN and NH-C-UA, NH-V- UN and NH-V-UA).
3.2.2. Ultrasonic treatment before the production of PCC particles
In this stage, the ultrasonic treatment (100% amplitude) was applied for 2 min before PCC production. SEM images in Fig. 8 show that the ultrasonic treatment destroyed rod-like crystals with a size of 100 µm in the DG particles into different flake or needle-like crystals (approxi-mately 10 µm) in the presence of K+and Na+ions. However, some rod- like crystals were observed after ultrasonic treatment in the presence of NH4+ions.
Fig. 9 shows that PCC particles with a unimodal particle size distri-bution could be produced using the conventional reactor, while pro-duced PCC particles via the venturi tube in the presence of Na+ions revealed a bimodal pattern with d10, d50, and d90 values of 2.00, 10.8, and 29.2 µm, respectively. The SPAN factor was found to be 2.516,
which was higher than the SPAN factors calculated for PCC particles produced under the condition of K-C-UB, Na-C-UB, and NH-C-UB. The values of d10, d50, d90, and SPAN factor for all produced PCC particles after conducting ultrasonic treatment are given in Table S3.
The XRD patterns in Fig. 10 show that the characteristic peaks (29.41◦, 47.50◦, and 48.50◦) representing the calcite crystals were observed in the PCC particles that were produced using both reactors in the presence of K+or Na+ions (exp. code: K-C-UB, K-V-UB, Na-C-UB, and Na-V-UB). However, a mixture of vaterite and calcite crystals was determined when the NH4+ions are present. Rietveld analysis given in
Table S4 confirmed that the proportion of calcite crystals in the PCC was found to be 23.45% for the conventional reactor and 23.45% for the venturi tube reactor.
SEM images in Fig. 11 showed that lumpy and spherical calcite crystals with a size of less than 200 nm were formed under the condition of K-C-UB and Na-C-UB. Similar spherical calcite crystals were observed under the condition of Na-V-UB with a lower crystal size (below 50 nm). Some hollow calcite crystals with a size of 400 nm were observed under the condition of K-V-UB. A mixture of spherical and cubic crystals started to form on the rod-like crystal particles (exp. code: NH-C-UB). Finally, PCC particles with larger polycrystalline crystals were pro-duced as nanosized cubic crystals were agglomerated.
3.2.3. Ultrasonic treatment during the production of PCC particles
An ultrasonic probe with a diameter of 13 mm was adopted to the venturi tube where Ca2+ions reacted with CO2 gas to produce PCC particles. The image taken during the production of PCC in the presence of ultrasonication can be seen in Fig. 12. The particle size distributions of produced PCC particles are shown in Fig. 13.
It was thought that ultrasonication creates a cavitation effect and
micro-level diffusion & mixing that have a strong effect on the particle size properties of produced PCC particles when the conventional reactor was used. However, the ultrasonication in the venturi tube reactor was a batch type as the solution was circulated continuously in the reactor via the pump. No cavitation effect was present in the solution tank in the venturi tube reactor. Hence, the cavitation effect due to ultrasonication was minimal in this reactor. This was proven by the particle size analysis of produced PCC particles. In the presence of ultrasonication, it was possible to produce PCC particles with a homogeneous size distribution using the venturi tube reactor compared to using the conventional reactor. Two main peaks presenting the bimodal patterns in the particle size analysis were observed when using the conventional reactor. Furthermore, these peaks resulted in producing PCC particles with higher SPAN factors that were calculated using the d10, d50, and d90 values of PCC particles. For example; the d10, d50, and d90 values of produced PCC particles were found to be 1.162, 6.43, and 44.4 µm, respectively for the condition of K-C-US, whereas these values were 3.22, 9.61, and 20.4 µm, respectively for the condition of K-V-US. The particle size distribution and SPAN factors of all PCC particles in the presence of ultrasonication are presented in Table S5.
The XRD patterns in Fig. 14 agree well with those of a previous study
[25], which indicates that the presence of ultrasonication during PCC production produces PCC containing calcite crystals. In the presence of K+, Na+, and NH
4
+ ions, all PCC particles were identified as calcite minerals, which was confirmed by the Rietveld analysis (Table S6). Previous studies reported similar results [25,37]. It was determined that the use of ultrasonication during PCC production triggered the forma-tion of PCC particles with cubic crystals rather than spherical or lumpy crystals. All produced PCC particles were well-crystallized and exhibited a cubic structure as shown in the SEM images (Fig. 15). However,
0.1 1 10 100 ) %( tn uo m A 0 2 4 6 8 K-C-UB K-V-UB 0.1 1 10 100 0 2 4 6 8 10 Na-C-UB Na-V-UB Particle size (µm) 0.1 1 10 100 Am oun t (%) 0 1 2 3 4 5 6 7 NH-C-UB NH-V-UB
a
b
c
Fig. 9. Particle size distribution of produced PCC particles under the condition of (a) K-C-UB and K-V-UB, (b) Na-C-UB and Na-V-UB, and (c) NH-C-UB and NH-V-UB.
2 Theta (deg) 20 30 40 50 60 70 80 0 50 100 150 200 250 300 350 K-C-UB c c c c c cc cc c cc c c c c c c: calcite (PDF 05-0586) 2 Theta (deg) 20 30 40 50 60 70 80 0 100 200 300 400 c c c c c cc cc c cc c c c c c c: calcite (PDF 05-0586) 2 Theta (deg) 20 30 40 50 60 70 80 )s pc( yti sn et nI 0 20 40 60 80 100 c c c c c c c c c c c c c c c c c c: calcite (PDF 05-0586) v: vaterite (PDF 33-0268) v v v v v 2 Theta (deg) 20 30 40 50 60 70 80 0 20 40 60 80 100 120 c c c c c cc cc c c c c c c c c c: calcite (PDF 05-0586) 2 Theta (deg) 20 30 40 50 60 70 80 0 20 40 60 80 100 120 c c c c c cc cc cc c c c c cc c: calcite (PDF 05-0586) 2 Theta (deg) 20 30 40 50 60 70 80 0 20 40 60 80 100 c c c c c c c c c c c c c c c c c c: calcite (PDF 05-0586) v: vaterite (PDF 33-0268) v v v v v NH-V-UB NH-C-UB Na-C-UB Na-V-UB K-V-UB
produced PCC particles in the presence of NH4+ions exhibited ellipsoidal crystals rather than cubic crystals via the ultrasonication in a previous study [25].
3.3. SSA, AFM, and FTIR analyses of the selected PCC particles
The SSD values of the selected PCC particles in Table 3 ranged from 2.156–16.097 m2/g depending on the production conditions. The ob-tained results indicated that the ultrasonication had a strong effect on the SSA value of the PCC particles. The SSA value of the PCC particles obtained under the condition of K-C-UN was found to be 2.363 m2/g. This value then increased to 12.652 m2/g when the PCC particles were
exposed to ultrasonic power. SSA value of PCC particles with the use of ultrasonic power before switching the CO2 gas on was found to be 11.747 and 16.097 m2/g under the conditions of K-V-UB and Na-V-UB, respectively.
AFM analyses were conducted to evaluate the surface topography of the selected PCC particles obtained in the presence of different condi-tions with the corresponding images shown in Fig. 16. The surface topography of the produced PCC particles in the presence of Na+ions was strongly influenced by the production conditions. The surface roughness (Ra) of PCC particles obtained under the condition of Na-C- UN decreased from 66.48 to 18.504 nm when applying ultrasonic treatment. Decreased Ra values correlated with the SEM results in Fig. 6
0.1 1 10 100 ) %( tn uo m A 0 2 4 6 8 10 K-C-US K-V-US 0.1 1 10 100 0 2 4 6 8 10 Na-C-US Na-V-US Particle size (µm) 0.1 1 10 100 A m oun t (%) 0 2 4 6 8 NH-C-US NH-V-US
a
b
c
Fig. 13. Particle size distribution of produced PCC particles under the condition of (a) K-C-US and K-V-US, (b) Na-C-US and Na-V-US, and (c) NH-C-US and NH-V-US.
Solution entering into the venturi tube
CO2inlet
Ultrasonic probe (13 mm)
Reaction zone Solution left from the venturi tube
in which the produced PCC particles with cubic shapes were destroyed owing to ultrasonic treatment. If ultrasonic treatment was applied before producing PCC particles, the Ra value of the produced PCC par-ticles was 35.47 nm, which was approximately two times lower than the Ra value of produced PCC particles under the condition of Na-C-UN. This was because conducting ultrasonication before carbonation produced smaller particles, which consequently resulted in low Ra values. The Ra values of produced PCC particles under the conditions of Na-V-UN, Na- V-UA, and Na-V-US were found to be 105.74, 20.279, and 73.243 nm, respectively. However, the Ra values of produced PCC particles in the presence of NH4+ions for both reactors were found to be lower than those of the Ra values of PCC particles in the presence of Na+ions (Fig. 17). This may be attributed to the presence of spherical vaterite crystals together with calcite in the produced PCC particles as shown in Fig. 6.
Fig. 18 reveals that it was possible to determine the polymorph properties of the produced PCC particles via the FTIR spectrum. Calcite and vaterite have different functional groups [19] with characteristic peaks at 1085 and 742 cm−1 for vaterite crystals and 872 and 713 cm−1 for calcite crystals [38]. These verified the XRD results in which PCC particles with calcite crystals were produced in the presence of Na+ions, but a mixture of vaterite and calcite crystals in PCC were observed in the presence of NH4+ions (Fig. 18(a) and Fig. 18(b)). However, the presence of ultrasonication during production only resulted in PCC particles with calcite crystals as indicated in Fig. 18(c) and Fig. 18(d). XRD (Fig. 14) and SEM (Fig. 15) analyses confirmed these results.
3.4. Evaluation of the selected PCC particles in terms of their usage in the industry
The potential usage area of the PCC particles produced here was evaluated according to the ASTM D 1199-86 [39] and ASTM STP 1135
[40] standards. The PCC particles produced under the condition of Na-V- UB were classified as Grade I (fine paint grade) and Grade V (superfine grade) for the paint industry according to the criteria given in the ASTM
standard (ASTM D1199–86). It was determined that the cubic PCC particles produced in the presence of ultrasonication can be used as a filler material in the paper industry to improve paper opacity while making a dense sheet of paper (ASTM STP 1135). In addition, PCC nanocrystals with an SSA value of <10 m2/g can be used as a functional filler for rheology modification in PVC production [41].
4. Conclusion
This study explored the effect of ultrasonic application on the pro-duction of PCC particles from DG via mineral carbonation method, using three reactors (conventional, venturi tube and venturi tube with an ul-trasonic probe) in the presence of different alkali sources (NaOH, KOH and NH4OH). Ultrasonic application was performed three times (before, during and after the PCC production) to evaluate its exact effect on the properties of the PCC particles. The PCC particles produced were char-acterized using SEM, XRD, AFM, SSA, FTIR, and particle size analyses. The nucleation time required to produce PCC was dependent on the reactor types and these were ordered as follows: (from shortest to longest) (i) venturi tube with an ultrasonic probe, (ii) venturi tube, and (iii) conventional reactors.
The particle size distribution of each product was strongly influenced by ultrasonic treatment. All produced PCC particles were identified as calcite in the presence of Na+or K+ions, while a mixture of vaterite and calcite crystals was formed with NH4+ions. Furthermore, it was deter-mined that the use of ultrasonic power during the PCC production resulted in the formation of single calcite crystals rather than a mixture (calcite and vaterite) in the presence of NH4+ions.
The use of ultrasonic power before starting CO2 gas flows into the venturi tube reactor resulted in producing PCC particles with superior properties such as higher SSA value, uniform particle size, and nano-sized crystal properties. Finally, the PCC particles produced in this study can be used as a filler in many industrial areas including paint, paper, and plastic depending on production conditions. The residual solution 2 Theta (deg) 20 30 40 50 60 70 80 0 100 200 300 400 500 K-C-US c c c c c c c cc c cc c c c c c c: calcite (PDF 05-0586) 2 Theta (deg) 20 30 40 50 60 70 80 0 100 200 300 400 500 c c c c c cc cc c cc c c c c c c: calcite (PDF 05-0586) 2 Theta (deg) 20 30 40 50 60 70 80 0 50 100 150 200 250 300 350 c c c c c cc c c c c c c c c c c c: calcite (PDF 05-0586) 2 Theta (deg) 20 30 40 50 60 70 80 0 100 200 300 400 c c c c c c c cc c cc c c c c c c: calcite (PDF 05-0586) 2 Theta (deg) 20 30 40 50 60 70 80 0 100 200 300 400 c c c c c cc cc c cc c c c c c c: calcite (PDF 05-0586) 2 Theta (deg) 20 30 40 50 60 70 80 0 50 100 150 200 250 300 350 c c c c c cc c c c c c c c c c c c: calcite (PDF 05-0586) Na-C-US NH-C-US Na-V-US NH-V-US K-V-US
after PCC production can be further evaluated in chemistry or fertilizer industries depending on its content.
CRediT authorship contribution statement
Mahmut Altiner: Conceptualization, Methodology, Investigation,
Writing, Validation, Supervision. Soner Top: Investigation, Writing, Validation. Burçin Kaymako˘glu: Investigation.
Declaration of Competing Interest
The authors declare that they have no known competing financial interests or personal relationships that could have appeared to influence
Fig. 15. SEM images of produced PCC particles in the presence of ultrasonication.
Table 3
SSA values of the selected PCC particles.
Experiment Code SSA (m2/g) Experiment Code SSA (m2/g)
K-C-UN 2.363 NH-V-UA 5.485 K-C-UA 12.652 Na-V-UN 6.443 Na-C-UN 2.652 Na-V-UA 10.255 Na-C-UA 11.351 K-V-UB 11.747 NH-C-UN 2.156 Na-V-UB 16.097 NH-C-UA 5.658 K-V-US 7.652 K-V-UN 2.556 Na-V-US 8.152 K-V-UA 7.071 NH-V-US 7.859 NH-V-UN 2.658
Fig. 16. AFM images of the selected PCC particles in the presence of Na+ions.
the work reported in this paper.
Acknowledgment
This study was supported by the Scientific and Technological Research Council of Turkey (TUBITAK) [Project No: 119M134]. The authors would like to thank anonymous reviewers for their valuable comments. Also, the authors would like to thank Enago for the English review.
Appendix A. Supplementary data
Supplementary data to this article can be found online at https://doi. org/10.1016/j.ultsonch.2020.105421.
References
[1] J.-L. Wu, C.-Q. Wang, R.-X. Zhuo, S.-X. Cheng, Multi-drug delivery system based on alginate/calcium carbonate hybrid nanoparticles for combination chemotherapy, Colloids Surf., B 123 (2014) 498–505, https://doi.org/10.1016/j.
colsurfb.2014.09.047.
[2] Y. Svenskaya, B. Parakhonskiy, A. Haase, V. Atkin, E. Lukyanets, D. Gorin, R. Antolini, Anticancer drug delivery system based on calcium carbonate particles loaded with a photosensitizer, Biophys. Chem. 182 (2013) 11–15, https://doi.org/ 10.1016/j.bpc.2013.07.006.
[3] F. Karakas¸, M.S. Çelik, Effect of quantity and size distribution of calcite filler on the quality of water borne paints, Prog. Org. Coat. 74 (3) (2012) 555–563, https://doi. org/10.1016/j.porgcoat.2012.02.002.
[4] I. Ghosh, C. Sharma, R. Tandon, Structural evaluation of chitosan-modified precipitated calcium carbonate composite fillers for papermaking applications, SN Appl. Sci. 2 (9) (2020), https://doi.org/10.1007/s42452-020-03313-w. [5] ] W.J. Haskins, E.J. Osterhuber, Aragonitic precipitated calcium carbonate pigment
for coating rotogravure printing papers, in, Google Patents, 1999.
[6] M. Altiner, M. Yildirim, Production of precipitated calcium carbonate particles with different morphologies from dolomite ore in the presence of various hydroxide additives, 53 (2017) 413–426.
[7] M. Altiner, M. Yildirim, Production and characterization of synthetic aragonite prepared from dolomite by eco-friendly leaching–carbonation process, Adv. Powder Technol. 28 (2) (2017) 553–564, https://doi.org/10.1016/j. apt.2016.10.024.
[8] R.M. Santos, J. Thijs, E. Georgakopoulos, Y.W. Chiang, A. Creemers, T. Van Gerven, Improving the yield of sonochemical precipitated aragonite synthesis by scaling up intensified conditions, Chem. Eng. Commun. 203 (12) (2016) 1671–1680, https:// doi.org/10.1080/00986445.2016.1230105.
[9] B.o. Wang, Z. Pan, H. Cheng, Y. Guan, Z. Zhang, F. Cheng, CO2 sequestration: high conversion of gypsum into CaCO3 by ultrasonic carbonation, Environ Chem Lett 18 (4) (2020) 1369–1377, https://doi.org/10.1007/s10311-020-00997-9. [10] D.J. Tobler, J.D. Rodriguez Blanco, H.O. Sørensen, S.L.S. Stipp, K. Dideriksen,
Effect of pH on Amorphous Calcium Carbonate Structure and Transformation, Cryst. Growth Des. 16 (8) (2016) 4500–4508, https://doi.org/10.1021/acs. cgd.6b00630.s001.
[11] O. Rahmani, CO2 sequestration by indirect mineral carbonation of industrial waste red gypsum, J. CO2 Util. 27 (2018) 374–380.
[12] M. Altiner, S. Top, B. Kaymako˘glu, ˙I.Y. Seçkin, H. Vapur, Production of precipitated calcium carbonate particles from gypsum waste using venturi tubes as a carbonation zone, J. CO2 Util. 29 (2019) 117–125.
[13] M. Altiner, Effect of alkaline types on the production of calcium carbonate particles from gypsum waste for fixation of CO2 by mineral carbonation, Int. J. Coal Prepar. Utiliz. 39 (2018) 113–131.
[14] K. Song, W. Kim, S. Park, J.-H. Bang, C.W. Jeon, J.-W. Ahn, Effect of polyacrylic acid on direct aqueous mineral carbonation of flue gas desulfurization gypsum, Chem. Eng. J. 301 (2016) 51–57.
[15] B. Wang, Z. Pan, Z. Du, H. Cheng, F. Cheng, Effect of impure components in flue gas desulfurization (FGD) gypsum on the generation of polymorph CaCO3 during carbonation reaction, 369 (2019) 236–243.
[16] M. Abeywardena, R. Elkaduwe, D. Karunarathne, H. Pitawala, R. Rajapakse, A. Manipura, M.J.A.P.T. Mantilaka, Surfactant assisted synthesis of precipitated calcium carbonate nanoparticles using dolomite: Effect of pH on morphology and particle size, 31 (2020) 269–278.
[17] Z. Tao, X. Cheng, C.J.M.C. Huo, L. Crystals, The precipitation of calcium carbonate via a bubbling method in the presence of Mg2+ and glucose, 703 (2020) 52–66. [18] S.J.C.E. Jenkins, Precipitated Calcium Carbonate from Limestone, 123 (2016) 36. [19] S. Polat, P. Sayan, Ultrasonic-assisted eggshell extract-mediated polymorphic
transformation of calcium carbonate, Ultrason. Sonochem. 66 (2020), 105093. [20] V. Arkhypova, R. Smotraiev, K. Sorochkina, Y. Manidina, Influence of synthesis
conditions on the calcium carbonate microparticle properties obtained by 1000 2000 3000 4000 ) %( ec nat ti ms nar T 30 40 50 60 70 80 90 100 Na-C-UN Na-C-UA 2513.21 1393.28 1794.99 871.02 712.01 1000 2000 3000 4000 NH-V-UN NH-V-UA 3333.64 1400.73 872.89 745.42 1128.75 2038.76 Wavenumbers (cm-1) 1000 2000 3000 4000 20 40 60 80 100 Na-V-US Na-C-US 1392.78 872.73 71 2. 59 11 44 .56 21 63 .52 17 94 .75 1000 2000 3000 4000 NH-V-US NH-C-US 1405.56 873.05 71 2. 59 11 52 .19 25 13 .48 17 95 .54
a
b
c
d
homogeneous and heterogeneous precipitation, Braz. J. Chem. Eng. 37 (3) (2020) 525–531, https://doi.org/10.1007/s43153-020-00053-7.
[21] R.M. Rivera, T. Van Gerven, Production of calcium carbonate with different morphology by simultaneous CO2 capture and mineralisation, 41 (2020) 101241. [22] N.C.D. Konopacka-Lyskawa, The overview of reactors used for the production of
precipitated calcium carbonate via carbonation route, Aparatura Badawcza I Dydaktyczna 24 (2019) 83–90.
[23] S. Aldea, M. Snåre, K. Er¨anen, H. Grenman, A.-R. Rautio, K. Kord´as, J.-P. Mikkola, T. Salmi, D.Y. Murzin, Crystallization of nano-calcium carbonate: the influence of process parameters, Chem. Ing. Tech. 88 (11) (2016) 1609–1616, https://doi.org/ 10.1002/cite.201600028.
[24] I. Nishida, Precipitation of calcium carbonate by ultrasonic irradiation, Ultrason Sonochem 11 (2004) 423–428.
[25] H. Cheng, X. Wang, B. Wang, J. Zhao, Y. Liu, F. Cheng, Effect of ultrasound on the morphology of the CaCO3 precipitated from CaSO4-NH3-CO2-H2O system, J. Cryst. Growth 469 (2017) 97–105.
[26] S.R. Shirsath, B.A. Bhanvase, S.H. Sonawane, P.R. Gogate, A.B. Pandit, A novel approach for continuous synthesis of calcium carbonate using sequential operation of two sonochemical reactors, Ultrason. Sonochem. 35 (2017) 124–133. [27] S.R. Shirsath, S.H. Sonawane, D.R. Saini, A.B. Pandit, Continuous precipitation of
calcium carbonate using sonochemical reactor, Ultrason. Sonochem. 24 (2015) 132–139.
[28] B. Wang, Z. Pan, H. Cheng, Z. Chen, F. Cheng, High-yield synthesis of vaterite microparticles in gypsum suspension system via ultrasonic probe vibration/ magnetic stirring, J. Cryst. Growth 492 (2018) 122–131.
[29] Y. Kojima, K. Yamaguchi, N. Nishimiya, Effect of amplitude and frequency of ultrasonic irradiation on morphological characteristics control of calcium carbonate, Ultrason Sonochem 17 (2010) 617–620.
[30] M. Su, J. Han, Y. Li, J. Chen, Y. Zhao, K. Chadwick, Ultrasonic crystallization of calcium carbonate in presence of seawater ions, Desalination 369 (2015) 85–90.
[31] M. Mihai, D. Turtoi, C. Mateescu, I. Chilibon, Calcium carbonate synthesis in ultrasonic field, Rev. Chim. 60 (2009) 626–631.
[32] B. Gielen, Y. Thimmesch, J. Jordens, G. Janssen, L.C.J. Thomassen, T. Van Gerven, L. Braeken, Ultrasonic precipitation of manganese carbonate: reactor design and scale-up, Chem. Eng. Res. Des. 115 (2016) 131–144, https://doi.org/10.1016/j. cherd.2016.09.012.
[33] F.J. Yu, Z.H. Wang, Study on the Synthesis of High Quality Nanometer Calcium Carbonate Using Ultrasonic Technology, in: Advanced Materials Research, Trans Tech Publ, 2010, pp. 235–240.
[34] C.D. Mateescu, M. Mocioi, C. Sarbu, R. Isopescu, I. Chilibon, F. Branzoi, Calcium carbonate precipitation in ultrasonic field, in: 13th International Workshop on Industrial Crystallization, 2006, pp. 193–200.
[35] G.H. Rau, K. Caldeira, Management, Enhanced carbonate dissolution: a means of sequestering waste CO2 as ocean bicarbonate, 40 (1999) 1803–1813. [36] B. Njegi´c Dˇzakula, J. Kontrec, M. Ukrainczyk, S. Sviben, D. Kralj, Polymorphic
composition and morphology of calcium carbonate as a function of ultrasonic irradiation, Cryst. Res. Technol. 49 (2014) 244–256.
[37] S.H. Sonawane, S.P. Gumfekar, S. Meshram, M.P. Deosarkar, C.M. Mahajan, P. Khanna, Combined effect of surfactant and ultrasound on nano calcium carbonate synthesized by crystallization process, 7 (2009).
[38] M. Schmidt, T. Stumpf, C. Walther, H. Geckeis, T. Fangh¨anel, i. science, Phase transformation in CaCO3 polymorphs: A spectroscopic, microscopic and diffraction study, 351 (2010) 50–56.
[39] ASTM D 1199-86, Standard Specification for Calcium Carbonate Pigments, in, West Conshohocken, PA, 2020, 2020, pp. 1–3.
[40] ASTM STP 1135, Innovations and Uses for Lime, in: Innovations and Uses for Lime, Philadelphia, PA, 1992, pp. 1–7.
[41] H. Zhang, J.F. Chen, H.K. Zhou, G.Q. Wang, J. Yun, Preparation of nano-sized precipitated calcium carbonate for PVC plastisol rheology modification, J. Mater. Sci. Lett. 21 (16) (2002) 1305–1306.