Full Terms & Conditions of access and use can be found at
https://www.tandfonline.com/action/journalInformation?journalCode=tphy20
ISSN: (Print) (Online) Journal homepage: https://www.tandfonline.com/loi/tphy20
Assessment and simulation of water transfer for
the megacity Istanbul
Selmin Burak, Ayşe Hümeyra Bilge & Duygu Ülker
To cite this article: Selmin Burak, Ayşe Hümeyra Bilge & Duygu Ülker (2021): Assessment and simulation of water transfer for the megacity Istanbul, Physical Geography, DOI: 10.1080/02723646.2021.1904698
To link to this article: https://doi.org/10.1080/02723646.2021.1904698
Published online: 02 Apr 2021.
Submit your article to this journal
Article views: 24
View related articles
ARTICLE
Assessment and simulation of water transfer for the megacity
Istanbul
Selmin Burak a, Ayşe Hümeyra Bilge b and Duygu Ülker a
aMarine Environment Department, Institute of Marine Sciences and Management, Istanbul University, Fatih,
Istanbul, Turkey; bIndustrial Engineering, Faculty of Engineering and Natural Science, Kadir Has University,
Cibali, Istanbul, Turkey
ABSTRACT
The population of Istanbul increased from three to fifteen million from 1970 to 2018. The city, which has no perennial fresh water resources within its metropolitan boundaries, has long imported water from other basins. In this study, the performance of a reservoir system fed by surface runoff and inter-basin water transfer is investigated and applied. Simulations are run for water demand estimates and with Gamma-distributed realizations of monthly pre-cipitation, based on 105-year temperature and precipitation data. The research shows that after 2060, existing and transferred water alone will not be sufficient to meet demand and it is expected that the megacity Istanbul will be on a path towards water crisis after this date, if not before. It is concluded that it is vital to adopt a more diversified water supply and demand management portfolio with extensive Integrated Water Resources Management (IWRM) mea-sures for “Water Sensitive Cities”. Strategies for reliable system opera-tion that take foreseeable environmental problems into account are proposed.
ARTICLE HISTORY
Received 24 January 2020 Accepted 20 January 2021
KEYWORDS
Megacity Istanbul; runoff coefficient; water supply; water transfer; winter drought
Introduction
Design of water supply schemes for growing cities with limited hydrologic resources, like Istanbul, has always been challenging. Inter-basin water transfer has been a major part of water supply schemes in many metropolitan areas where perennial fresh water resources do not exist nearby (Downward & Taylor, 2007; Feng et al., 2007; Toosi & Samani, 2012). The volume of water transferred is determined by technical, environmental and social factors and always has limits. Long-term, accurate and reliable predictions related to hydrologic data are crucial for efficient system operation.
Many countries have investigated water projects to supply demands. In countries with a significant hydrologic imbalance between regions, water transfers have been common (Margat, 2009). Water transfer projects have been widely implemented in many water- scarce regions globally (Sinha et al., 2020) and in almost all Mediterranean countries during the 20th century (Benblidia & Margat, 2013; Burak & Margat, 2016). In Spain, national water planning was based on water transfers until recently (Downward & Taylor, 2007). In Iran, water has been transferred from one of the largest rivers (River CONTACT DUYGU Ülker duygu.ulker@istanbul.edu.tr
Karun) to the central areas (Toosi & Samani, 2012). In the USA, water transfer from three upstate watersheds has been implemented to supply the demands of New York City (National Academies of Sciences Engineering and Medicine, 2018); in California, water from two river basins, namely Northern Sierra and Colorado, has been imported to meet the needs of the city population and tourists (The Metropolitan Water District of Southern California, 2016). In China, South-to-North (S2N) water transfer projects from several rivers have been implemented to supply increasing demand of northern China (Feng et al., 2007; Zhao et al., 2020). Nevertheless, although water transfers are an efficient short-run solution to supply increasing demand (Burak & Margat, 2016; Gleick, 1998; Ranatunga et al., 2014), in the long-run water scarcity can be intensified by unsustainable solutions (Gohari et al., 2013).
In our case, water transfers from adjacent/outside basins was planned to supply water demands of Istanbul in the 1990s. A more extensive transfer was built to supply the population as it grew from about 7 million in 1990 to 15 million in 2018. At present, water supply is supplemented by this inter-basin transfer which is planned to be fully operational after the impoundment of the “Melen Dam” in the near future, by 2025.
The Istanbul water supply scheme is operated as an interconnected reservoir system fed by natural inflow and water transfers (Burak et al., 2017; Leeuwen & Sjerps, 2016). Operation of the reservoir system follows an annual cycle, starting with minimal stored water in October. Therefore, precipitation distribution throughout the year is needed for a satisfactory operational performance. Accurate estimations of water demand and natural inflow to the reservoir system are crucial for reliable long-term projections, including climatic disturbances. However, in the operational framework of the system discussed in this paper, managerial decisions pertain mostly to the water transfer scheme.
In this study, the water supply scheme is modelled as a network. The algorithm for the operation of the reservoir system is run with simulated precipitation for a monthly timeframe. A sigmoidal (S-curve) extrapolation of actual water supply is combined with Gamma-distributed realizations of monthly precipitation. To the best of our knowl-edge, no simulation work based on the longest historic available data has been done so far to predict the future water supply conditions of Istanbul until 2100 with the present and planned water supply potential. The objective of this study is for this purpose and shows that water supply is expected to fall short of demands after 2060 in Istanbul. The algorithm can be replicated in other cities that operate water transfers.
This study assesses the future of water supply for Istanbul in the light of the results. We put forward the risks of water shortage expected to happen under the existing supply conditions because technically and economically feasible development of natural water resources has come to an end with the latest water transfer project “Melen”. We further discuss the need to incorporate the measures of Integrated Water Resource Management-Water Sensitive City (IWRM-Water Sensitive City) approach with a diversified water portfolio to attain a water secured livable city.
Overview of Istanbul’s Water Supply System
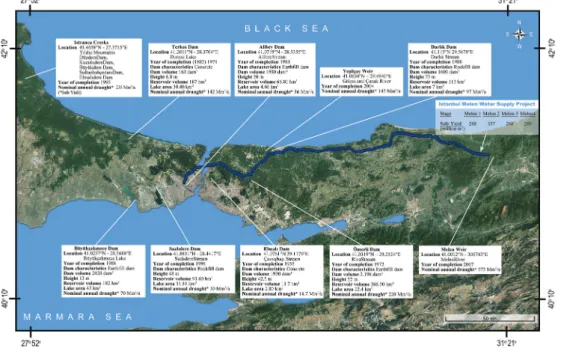
Istanbul straddles Asia and Europe between 28°10ʹ and 29°40ʹ East longitudes and 40°50ʹ and 41°30ʹ North latitudes, extending from the Marmara Sea to the Black Sea, on both sides of Istanbul Strait (Bosphorus). The study area covers Istanbul province with an area
of 5400 km2 comprising seven watersheds with creeks and lakes/impounded reservoirs for local water supply as shown on Figure 1. Details of the hydraulic structures and their related physical and operational features are given in (Burak et al., 2017).
The area’s climate is temperate with a moderate soil water deficit in summer. There is strong seasonality in precipitation in the whole region with a 2- or 3-month dry period in summer and a rainfall peak in winter (Serengil et al., 2007).
Approximately 60% of the population reside on the European side and 40% on the Asian side, whereas most water resources are on the Asian side. Two transmission mains cross the Bosphorus from the Asia to the European side. The city’s administrative boundaries contain no perennial fresh water resources that could supply the entire city.
Demographic features and water demand
Population growth in Istanbul has been high and fast as in other megacities of the developing world (Leeuwen & Sjerps, 2016; Tortajada, 2006; Varis et al., 2006). Natural growth and in-migration altogether resulted in rapid urbanization from the 1970s onwards creating many infrastructural problems including water sector (Altinbilek, 2006; Burak & Mat, 2020).
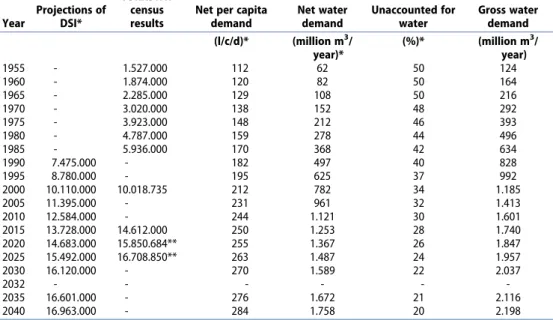
An accurate population estimate is part of reliable water demand projections and efficient resource management. When we compare population estimates for water supply projects to Istanbul by the State Hydraulic Works (DSI), we see that census results of the Turkish Statistical Institute (TURKSTAT) and the population estimates of DSI generally agree. However, an increasing trend in census after 2015 is noticed, compared to the estimates of DSI, as shown in Table 1. The population growth has an inflection point near
2007, which is mirrored by a similar trend in the water supply to the city, justifying its modelling by a sigmoid.
Water resources in the Istanbul area
Istanbul is supplied with water from dam reservoirs within the province, namely, Elmalı, Ömerli and Darlık on the Asian side, Terkos, Büyük-Çekmece, Alibeyköy and Sazlıdere on the European side (Figure 1). The reservoirs including those outside Istanbul are run with an interlinked and flexible operational system. Ömerli and Terkos reservoirs are the main sources of local water supply. There are also smaller reservoirs, some of which act as backup systems (ISKI, 2019)
The major water supply from adjacent basins to Istanbul is at present sourced via water transfer from the Yesilcay and Melen regulators on the Asian Side and from the Istranca System on the European side as shown in Figure 1.
Methods
This paper presents simulations based on a network model to assess the performance of the Istanbul water supply system until 2100. The model includes water resources in Greater Istanbul provincial boundaries and water transfers from outside basins. Water transferred from the Istranca creeks to the Terkos dam is considered as part of the reservoirs in Istanbul, which are modelled as a single node. The water supply is supplemented directly or indirectly by the Yesilcay and Melen rivers, but for our simulation, we consider these as a single external input to the Istanbul water supply. All water treatment systems are represented as a single output.
Table 1. Population projections and water demand (DSI, 1991; TURKSTAT, 2018).
Year Projections of DSI* TURKSTAT census results
Net per capita demand Net water demand Unaccounted for water Gross water demand (l/c/d)* (million m3/ year)* (%)* (million m3/ year) 1955 - 1.527.000 112 62 50 124 1960 - 1.874.000 120 82 50 164 1965 - 2.285.000 129 108 50 216 1970 - 3.020.000 138 152 48 292 1975 - 3.923.000 148 212 46 393 1980 - 4.787.000 159 278 44 496 1985 - 5.936.000 170 368 42 634 1990 7.475.000 - 182 497 40 828 1995 8.780.000 - 195 625 37 992 2000 10.110.000 10.018.735 212 782 34 1.185 2005 11.395.000 - 231 961 32 1.413 2010 12.584.000 - 244 1.121 30 1.601 2015 13.728.000 14.612.000 250 1.253 28 1.740 2020 14.683.000 15.850.684** 255 1.367 26 1.847 2025 15.492.000 16.708.850** 263 1.487 24 1.957 2030 16.120.000 - 270 1.589 22 2.037 2032 - - - -2035 16.601.000 - 276 1.672 21 2.116 2040 16.963.000 - 284 1.758 20 2.198
A preliminary data analysis showed that annual water balance is insufficient to explore water transfers, so, the model runs on a monthly time-step. The ratio of water transfer to total supply is 23.2% on the average over the period 2007–2016. In 2014, this ratio was 39.1%, well above the average, despite precipitation also being 15% above average, as seen in Table 2. This is explained by a serious drought during the winter of the previous year that shows the need to use monthly models. Considering that Turkey receives most rainfall in winter and spring, winter droughts significantly impact water supply. Therefore, monthly predictions of inflow to the reservoir system are central to the confidence of the operational decisions (Komuscu, 2001; Raymond et al., 2016; Trigo et al., 2013).
Data needed for simulations consist of monthly water supplied to the city and water inflow to the basins. The long-term model for the water supplied to the city is based on the water use for 1955–2040. A 5-point sigmoidal fit to these estimates is used to project the demand until 2100 and spline interpolation is used to generate monthly values.
Simulations are based on generating Gamma-distributed random samples for pre-cipitation; and runoff is evaluated in terms of real evapotranspiration ETR. Estimation of watershed yields is based on accurate evaluation of the real evapotranspiration, ETR. ETR is a major component of the water cycle (Gudulas et al., 2013). ETR values are computed using Turc’s formula and Thornthwaite’s method as implemented by (Gudulas et al., 2013). Monthly runoff coefficients obtained from Turc’s formula, Thornthwaite’s method, its actual measurements are compared and Turc’s formula is preferred for its simplicity. Statistical analysis of temperature and precipitation data over 105 years from 1912 to 2016, gathered as the longest period of available data is used for computing real (actual) evapotranspiration (ETR) and runoff (Burak et al., 2020).
Modelling monthly temperature and precipitation
We use monthly precipitation and temperature data from 1912 to 2016 as the longest available period of data as given in (Tables A1 and A2). These data were obtained from the Kandilli Observatory and Earthquake Research Institute in Istanbul (Boun-koeri,
Table 2. Total supply, water transfer and precipitation.
Years Yeşilçay (million m3/ year)* Melen (million m3/ year)*
Yeşilçay and Melen
(million m3/year) Total supply to Istanbul (million m3/year)** Total precipitation (mm/year)*** of (%)Ratio
2005 15.9 - 15.9 - 889.5 -2006 30.7 - 30.7 - 840.2 -2007 109.6 - 109.6 714.3 575.3 15.3 2008 110.0 129.6 239.6 718.3 899.2 33.4 2009 110.0 77.9 187.9 723.6 930.8 26.0 2010 11.4 5.6 17.0 778.0 1 192.2 2.2 2011 109.4 53.4 162.8 823.7 615.4 19.8 2012 109.3 50.3 159.6 872.9 810.2 18.3 2013 101.4 170.5 271.9 909.4 553.0 29.9 2014 110.0 251.4 361.4 924.4 967.8 39.1 2015 62.1 135.2 197.3 965.1 919.4 20.4 2016 33.0 242.8 275.8 998.6 912.0 27.6 (*) Data is provided by
(ISKI, 2017a), (**) Data is provided by (ISKI, 2017c), (***) Data is derived from supplemental data Table A2 (Boun-koeri, 2017).
2017). Precipitation for each month and linear projections are graphed in Figure 2, which indicates no overall long-term decrease in the precipitation.
The Gamma probability distribution is common for monthly precipitation data (Svensson et al., 2017). The parameters of the best fitting Gamma distribution for each month are computed and used to generate independent simulated values.
Monthly mean temperatures recorded at Kandilli Observatory over the period 1912–2016 are shown on Figure 3, (upper graph), together with their 2-standard devia-tion bounds. Similarly, the 95% and 5% bounds for the Gamma distribudevia-tion and actual precipitation data are shown on Figure 3, (lower graph).
Calculation of monthly runoff coefficients
On a water balance basis, precipitation is the sum of actual evapotranspiration, the increase in the soil moisture, infiltration and runoff (Trenberth et al., 2007). The relationship between precipitation and runoff depends on not only the soil type and evaporation characteristics, but also on the strength and the duration of the precipitation and involves delays from snow melt, and it can be far from being linear. Nevertheless, the ratio of runoff to precipitation, denoted as the runoff coefficient, is a common method for estimating runoff. Estimation of
Figure 2. Monthly precipitation (mm) in Istanbul over the period 1912–2016 and projections to 2100 via linear regression.
real evapotranspiration provides an indirect evaluation of the runoff via water balance (Olivera-Guerra et al., 2014).
Here, we used two methods for estimating runoff via evapotranspiration. The first is Turc’s formula adopted for monthly values that expresses evapotranspiration in terms of precipitation and mean temperatures. This method is based on the assumption that the precipitation (P) is the sum of real evapotranspiration (E) and the runoff (R), hence E ≤ P. The real evapotranspiration E is given by the formula (Eq.1).
E ¼ ffiffiffiffiffiffiffiffiffiffiffiffiffiffiffiP 0:9þ P2 L Tð Þ ½ �2 q , if P2 L Tð Þ ½ �2 >0:1 and E = P, if P2 L Tð Þ ½ �2 <0:1 (Eq.1)
where P is the mean monthly precipitation in mm/month, T is the mean annual temperature in degrees Celsius and L Tð Þ ¼300 þ 25T þ 0:05T3Runoff is defined as the difference between precipitation and evapotranspiration, R = P-E.
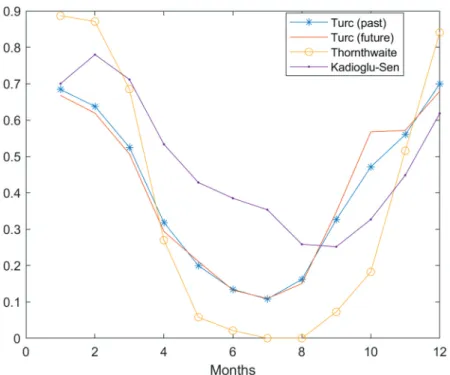
The second method is Thornthwaite’s method based on equating the sum of evapotranspiration and runoff to the sum of precipitation and soil moisture. Monthly runoff and precipitation measurements at seven watersheds in Istanbul were presented by (Kadioglu & Şen, 2001). Figure 4, presents; (i) runoff coefficients computed from Turc’s formula based on observed (past) values on 1912–2016, (ii) runoff coefficients computed from Turc’s formula based on simulated (future)
Figure 3. Monthly temperature, mean and 2-standard deviation bounds and precipitation mean and 95% and 5% bounds of the corresponding Gamma distribution fits in Istanbul, 1912–2016.
values, (iii) runoff coefficients computed by Thornthwaite’s method based on past values and (iv) the mean of the runoff coefficients for seven watersheds based on the measurements given in (Burak et al., 2020; Kadioglu & Şen, 2001).
We used runoff coefficients calculated from Turc’s formula by applying actual and simulated values (Burak et al., 2020). As seen from Figure 4., these are close to each other, so Turc’s formula based on actual data was used to compute runoff coefficients.
Precipitation and runoff
This section examines the impacts of winter and summer droughts on runoff. In summer, a small proportion of precipitation converts to runoff, but in fall and winter, a higher proportion of precipitation converts to runoff. Thus, for storing water in reservoirs, the effects of winter droughts are expected to be more severe and the time series for monthly runoff is needed. As described in the previous section, we obtained a time series for the monthly runoff coefficients then we multiplied this series with simulated monthly time series for the precipitation to obtain monthly runoff.
In Figure 5, we present actual and monthly averages (from 105 years of data) for precipitation and runoff respectively. The upper graph shows extended periods of low precipitation in the summers of 2007, 2008 and 2009, and an extended period of low precipitation in the winter of 2013–2014. The lower graph shows that runoff levels during the summers of 2007, 2008 and 2009 are close to the
Figure 4. Runoff coefficients computed by Turc’s formula based on actual and simulated data (Burak et al., 2020), by the Thornthwaite’s method and mean of the runoff coefficients computed from runoff and precipitation measurements for 7 watersheds in Istanbul, as given in (Kadioglu & Şen, 2001).
average values but runoff in the winter of 2013–2014 is well below average. Lower monthly average precipitation in summer months has little effect on runoff, but, lower-than-usual monthly precipitation in winter leads to much lower runoff. Since the hydrologic cycle in Turkey starts in October, the reservoirs are at their lower levels in October and droughts in the subsequent months have a drastic effect on water supply. Water transfers are especially crucial in such situations. This effect occurred in 2013–2014, as seen in Figure 5. Such effects cannot be observed in the annual water balance. In fact, the ratios of the water transferred to the total water supplied to the city were 18.3%, 29.9%, 39.1% and 20.4%, respec-tively, in the years 2012, 2013, 2014 and 2015, while total precipitation in these years were 810.2 mm/year, 553.0 mm/year, 967.8 mm/year and 919.4 mm/year as given in Table 2. From these values, water transfer and precipitation were both high in 2014, because, as seen from Figure 5, precipitation was low at the end of 2013 and the beginning of 2014, reservoirs were empty and transferred water had to be used. In summer of 2014, precipitation was above average, which slightly increased runoff.
Figure 5. Actual and average precipitation (a) and runoff (b) for Istanbul. Below-average precipitation during summer and winter seasons are indicated. Below-average precipitation periods during summer months disappear in runoff but “winter drought” persists.
This example shows that yearly averages may hide monthly variations that are more important for each watershed, where significant variations of scarcity and abundance may occur.
Evaluation of the Results
Analysis of temperature and precipitation data from 1912 to 2016 shows a general increase in temperature from February to October, but long-term temperatures seem stable from November to January. For reservoir management, this feature reduced negative effects of global warming, because, normally precipitation is concentrated in winter. This observation is consistent with climate change effects as predicted in (IPCC, 2014b). In addition to stable temperatures in winter, as in Figure 2, no significant decrease in average precipitation is foreseen. The combined effect of the changes in temperature and precipitation is reflected to runoff via various semi-empirical formulas; all of which predict very low runoff in summer, regardless of precipitation. Thus, it can be argued that increase in temperatures in summer has little influence on runoff. On the other hand, any climatic disturbance during winter, such as increased frequency of winter droughts would have significant adverse effects on reservoir management as shown on Figure 5.
In this model, all reservoirs in the basin are denoted by a single node, and it is assumed that water can be transferred from external basins if necessary and discharged if there is a surplus. For the present study, we run a simulation for the monthly operation of the water supply scheme. Basic components of the simulation are described below:
Water demand
Water demand up to 2100 is estimated by fitting a 5-point sigmoidal curve (Carrillo, 2003) to the actual and estimated annual water demand over the period 1955 to 2040, and cubic splines are used for monthly interpolation. The formula (Eq.2) for the 5-point sigmoid is given below.
f xð Þ ¼D þ ðA DÞ
1 þ x C
�b
h ie (Eq:2)
where f(0) = A, D is the limiting value as x goes to infinity, C is a scaling of x and the (positive) parameters b and e determine the asymmetrical shape of the curve.
Inflow to the reservoirs
Simulations of the inflow to the reservoir system are based on the modelling of monthly precipitation, Rm, by Gamma-distributed random variables. Runoff coefficients com-puted from Turc’s formula are used to generate estimated runoff until 2100.
Reservoir levels
For water supply management, the reservoir capacity at a given month, Wn, is charac-terised with three storage capacities, dead storage Wn = 0, maximal volume, Wn = Wmax
and a critical volume Wn = αWmax where 0 < α < 1, respectively. For this study, simulations are carried out for α = 0.50. In the network model, depletion of storage capacity to Wn = 0, is identified as a “system failure” indicating that operational precau-tions should be foreseen prior to that stage.
Water transfer
Safe yields of the water transferred from the Melen and Yeşilçay systems are obtained from ISKI (ISKI, 2017b). Total water to be transferred at a given period is denoted by Yn and it is bounded by the safe yield of the system at the given period, Ymax. For each operating strategy, the decision variable is the amount of water transfer during each step.
Operating principles
Let An be the natural inflow, Yn be the transferred water, Sn be the water demand, Dn be the discharge and Xn be the amount of water supplied from the reservoir storage (positive) or added to the reservoir (negative). These quantities are related by An + Yn + Xn = Sn + Dn . It follows that Xn = Sn + Dn – An – Yn, at any period. At the end of the period, the amount of stored water, Wn is updated as Wn+1 = Wn – Xn. As a basic operating principle, water is discharged only if precipitation exceeds the demand and reservoirs are full, i.e, Dn = max {An – Sn – (Wmax,n-Wn),0}. In our model, the operation strategy consists of the choice of a critical storage parameter, α, such that, besides meeting the demand, transferred water is used to fill the reservoir system up to the critical storage level α Wmax. Let Fn = Wmax,n-Wn and Gn = α Wmax,n – Wn. These variables are updated as Fn+1 = Wmax,n – Wn+1, Gn+1 = max{α Wmax,n – Wn+1, 0}. Once the parameter α is chosen, the amount of water to be transferred is determined by the algorithm below.
Case 1: An> SnþFn; ! Yn¼0;
Case2: An>SnþGn; ! Yn¼0
Case 3: An>Sn; ! Yn¼min Gf n AnþSn;Ymaxg
Case 4: An<Sn; Ymax>Sn AnþGn! Yn¼Gn AnþSn
Case 5: An<Sn; Ymax>Sn An! Yn¼Ymax
Case 6: An<Sn; Ymax<Sn A; Wn> Sn An Ymax! Yn¼ Ymax
Case7:
An<Sn; Ymax<Sn An;Wn< Sn An Ymax! Yn¼Ymax;Sn¼AnþYmaxþWn
(a)Simulation starts with a state where the storage capacity is full. At any state n, if the inflow An is sufficient to meet the water demand Sn and to fill the reservoirs at least up to the critical
level, there is no water transfer.
(b)If the reservoirs are filled completely, the surplus is discharged (Case 1 and Case 2). (c)If the inflow An is greater than the demand
Sn water transfer is used to fill the reservoirs up to the critical level, if possible (Case 3).
(d)If the inflow An is insufficient to meet the water demand Sn, then transferred water is used
to meet the demand and to fill the reservoirs up to the critical level, if possible (Case 4 and Case 5).
(e)If the inflow An and maximum water transfer are insufficient to meet the demand, then
the storage capacity of the reservoirs is used.
(f)If the sum of these resources is sufficient, there is no water rationing (Case 6). Otherwise, there is water rationing. This means that the stored volume in the reservoirs is not sufficient to meet the demand of the population connected to the water distribution network, as no hedging is available at present with alternative/manufactured sources; therefore, water rationing will be practiced. (Case 7)
The results for monthly simulation are displayed on Figure 6. Although the timing, frequency of occurrence and the severity of system failures depend on randomly gener-ated precipitation, in general, they are expected to occur in the steady-state operation of the water supply system.
Discussion
Because the current water transfer system of Istanbul cannot be expanded further, physi-cally and techniphysi-cally, it is necessary to counterbalance water shortage expected to happen around 2060, with water conservation/demand management, grey water use, rainwater harvesting and/or desalination. Emerging environmental concerns and uncertainties related to increased climatic disturbances on water resources also raise demand and operation management approaches, quantity and quality management at the same time with “fit-for-purpose” measures which can be summarised as the principle of not wasting higher water quality for the use that can be done with a lower quality (UN-Water, 2015). Therefore, improved and enhanced operation and demand management tools must be
incorporated in the supply system. For instance, a study in 2017 showed that a substantial amount of grey water (2 million m3/day) is produced within the city (Beler-Baykal & Oructut, 2017). Making grey water useful and socially acceptable in new buildings would reduce growth in water transfer demand. These measures must be developed and enforced in a timely manner. Persuading people to accept changes in social behaviour takes time. Demand management requires governance and appropriate tools to motivate people, to understand and accept measures to alleviate pressure on freshwater resources.
Water scarcity from economic and population growth is an important threat for human societies and a constraint for sustainable development (Greve et al., 2018; UN- Water, 2015). This statement is also true for Istanbul, especially with continued popula-tion growth (Savun-Hekimoğlu et al., 2020). Historically, water managers have tried to meet water demand in Istanbul by diverting/conveying water from adjacent resources since the 16th century (Altinbilek, 2006; Ozis et al., 2020; Saatci, 2013). As such, this city is a pertinent example of a megacity with massive water transfer for urban use. Once the gap between demand and supply was closed via water transfer, continuous urbanisation paralleling in-migration gave rise to increased water demand met by further water transfers such as Istranca, Yeşilçay and Melen projects, after the severe drought occurred in 1993, in particular.
This cycle shows that water shortage cannot be resolved for Istanbul unless water transfer is accompanied by additional sustainable management policy measures. Similar situations occur in other regions of the World, where it was put forward that “Soon after completion of each water transfer project, the water scarcity reappears due to continuous development and in-migration intensified by a false perception of water availability” (Gohari et al., 2013). Because continuous increase of urbanization and poor planning are the reasons for most urban water shortages as argued by (Muller, 2018).
Furthermore, some researchers state that water transfers may entail negative long- term social, economic and environmental impacts from its effectiveness to water shortage (Klein, 2006; Olden & Naiman, 2010; Yan et al., 2012). Inter-basin transfers should be based on a holistic view which takes into accounts for the socio-economic, ecologic and environmental concerns with hydrologic aspects altogether. It is expected that almost 14% of water withdrawal at global scale, implemented via inter-basin water transfer will rise to 25% by the year 2025 according to International Commission on Irrigation and Drainage (ICID) (ICID, 2005). This reflects supply-oriented management decisions based on inter-basin transfer continuing to be preferred because people are attracted by large metropolises for better living conditions. This relieves the symptom of water shortage problem, but it hides at the same time a larger management issue by postponing it. In England, the Environment Agency released a national framework for water resources to describe challenges considering future water demands and potential for new supplies and water transfer (Harou, 2019). Several questions were raised in this report; among these, the question of “how will transfers be operated given different scarcity levels in the recipient and donor basins?” is still a pending issue to be addressed also for Istanbul.
This study predicts that after 2060, the existing water supply scheme will fall short to meet demand under the prevailing conditions. Diversifying the water portfolio provides hedging against supply risks (Leroux & Martin, 2016). These include unexploited natural resources opportunities (e.g., surface and ground water stocks) and manufactured water
(e.g., wastewater reclamation, desalination). The key question is to determine the optimal mix between them with regard to resource conservation and investment & operational cost (Erfani et al., 2018; Leroux & Martin, 2016)
There are good examples for water supply diversification in other megacities of the World. For instance, in California, treated wastewater is reclaimed as raw water aug-mentation to the water supply system instead of discharging it into the Pacific Ocean, as a measure of new layer of resiliency to Southern California’s water needs. This decision has been accompanied by the establishment of “Raw Water Augmentation Regulations for Direct Potable Reuse”. These initiatives were launched within the scope of the Integrated Regional Plan 2015 (IRP) which is a regional example of long-term, diversified strategic plan that evolves and adapts to address changing needs of future generation (The Metropolitan Water District of Southern California, 2016).
In Istanbul, there is a considerable potential for treated wastewater reuse and rainwater harvesting. At present, out of 1,4x10⁹ m3/year wastewater generated, 62% undergoes primary treatment, 38% undergoes biological and tertiary treatment prior to being discharged in the Bosphorus and the Marmara Sea. Only 1,84% was reused by the Istanbul Water and Sewerage Administration (ISKI) in 2019 corresponding to 25,4 x10⁶ m3/year. To use this potential, an efficient sewerage network operation is needed. The rehabilitated and extended sewerage infrastructure is designed as separate sanitary sewers and storm water drains (ISKI, 2019). However, there are illegal sewer cross-connections to storm water network in some areas that contribute to the pollution of the watersheds and consequently drinking water supply reser-voirs and the sea. Separate storm water flows from sewage will help to improve the functioning of wastewater treatment plants with further consequences of saving rainwater for different beneficial uses including drinking water. Another improve-ment will relate to the water quality of receiving waters in watersheds and coastal waters.
The latest master plan has been based on heavy engineering works (i.e., water supply, wastewater treatment and drainage) whereas the new master plan is expected to reach the target of “Water sensitive city” as proposed in the first stakeholders meeting of the new master plan organized by ISKI in November 2019. Water sensitive city is an approach to sustainable water resource management (Dean et al., 2016). The concept calls for a city that is a “watershed for water supply”, provides “ecosystem services” and is home to “water sensitive communities”. “Water sensitive city” plan-ning necessitates a “whole of government” approach where land-use planplan-ning and urban water management are integrated (Serrao-Neumann et al., 2017). It is recog-nized worldwide that business-as-usual approaches has failed to address urban water management (Brown et al., 2011). It is expected that increased urbanisation will continue to degrade water quantity and quality and upset natural hydrologic flows (Serrao-Neumann et al., 2019). In a recent study undertaken in three city regions of Australia, researchers have investigated urban water management with the objective to inform water-sensitive city planning by bridging the gap between past urban water management policies and water sensitive city, incorporating land-use planning and sustainably managing water (Serrao-Neumann et al., 2019). The water sensitive city concept cannot be operational unless legal and institutional framework is improved to match with adaptive behaviour. It has been experienced that unconcerned public
sector and traditional engineering solutions are prominent constraints. Successful megacities in sustainable water management have put forward that a concurrent emphasis on supply and demand management, wastewater and storm water manage-ment, institutional effectiveness and creating an enabling environment is necessary, as it has been for Singapore (Tortajada, 2006). Similarly, in our case the institutional and legal issues need to be improved to cope with more sustainable water governance issues to reach the target of the “Water Sensitive City”.
Limitations of the Approach
IPCC (2014a, 2018) identified a wide range of limitations with regard to the potential impacts of a changing climate on water resources and these are not fully understood. It is also suggested that small increases in global temperature can have statistically significant impacts on stream flow, but this effect is often hidden by the uncertainty in precipitation trends projected by GCMs (Hattermann et al., 2018). Müller (2018) suggests that “ . . . historical hydrology should still provide reliable perspectives for the next few decades . . . ” However, using regional models considering watershed-specific features can decrease such uncertainties in hydrological models (UN-Water, 2020). Regional climate models can predict some variables (e.g., evapotranspiration, soil moisture) (Tramblay et al., 2020).
This study has not run any sophisticated regional climate model but has run a simple monthly system with simulated precipitation. Istanbul is under the influence of the Mediterranean and Black Sea climates. Consequently, precipitation projections with climate change differ from the Mediterranean region. Slight changes in precipitation and temperature are predicted to happen unlike in the Mediterranean basin (Burak et al., 2020). This agrees with the study of (Turkes et al., 2020) as cited in (IPCC, 2019) where strong decrease in precipitation is predicted by the model REGCM4.4 in almost all of Turkey with the exception of northern parts. In our study, climate change is not addressed in the analysis because the linear regression results show that although summer temperatures will be affected, runoff will be less affected.
Conclusion
We conclude with the following thoughts on the management similar to other megacities in the developing world:
● Assessment of water imports for water supply in the megacity Istanbul cannot be separated from its hydrologic, geographic and most importantly its demographic and socio-economic features.
● Simulation results show that water imports alone are not a reliable solution to meet
the demand beyond 2060, the time when water demand is expected to increase by 30% beyond the present.
● A “false perception of water availability” can result in uncontrolled urbanisation to develop to the detriment of forests and watersheds. Land-use planning must go in parallel with water resources planning.
● Watersheds within Istanbul must be monitored and adequate intervention and additional protection measures must be put in force considering that water transfer from outside watersheds is an additional source.
● The users of the donor basins may object to deliver water to Istanbul if their own
activities are jeopardised because of reduced water quantity. Therefore, possible controversies must be foreseen in this regard. Since ISKİ is responsible by law for the enforcement of the “Regulations related to the Protection of Watersheds Supplying Drinking and Utility Water to Istanbul”, efficient pro-active and pre-emptive measures must be taken.
Supplementing the gap between demand and supply with increased water use efficiency (a) reducing physical losses to the best possible; (b) allocations & demand reductions; (c) not wasting higher water quality for uses that can employ lower quality water, must be one of the principles which will be avoiding wastage of fresh water.
Istanbul is a good example of the challenges faced in water supply in heavily populated cities, where urbanization has spread over watersheds in provincial boundaries. This research shows that after 2060, existing and transferred water resources alone will not be sufficient to meet demand. To rely on traditional solutions based on the assumption of ever-abundant water is expected to put the megacity on a path towards a water crisis after 2060 if not before. There is a need to adopt a more diversified water supply and demand management portfolio which have been implemented successfully in other megacities and have hedged supply risks.
As a concluding remark, laxity from a false perception of water availability, be it socio-political or institutional, is a threat to water security in Istanbul. It is vital to incorporate the extensive measures of IWRM-Water Sensitive City approaches with a diversified water portfolio in short-term decisions, because persuading people to adopt new behavioral attitudes and a changed mindset in the face of emerging issues takes time.
Acknowledgements
The authors convey their thanks to the Boğaziçi University - Kandilli Observatory and to the ISKI- R&D Department for data acquisition. The authors are grateful to the anonymous referees for their constructive comments.
Disclosure statement
No potential conflict of interest was reported by the authors.
Funding
This project is supported by the Istanbul University Scientific Research Projects Coordination Unit with project number BEK-2017-25709;
ORCID
Selmin Burak http://orcid.org/0000-0003-0780-0687
Ayşe Hümeyra Bilge http://orcid.org/0000-0002-6043-0833
Duygu Ülker http://orcid.org/0000-0002-6279-7321
Data availability statement
Data available within the article and its supplementary materials http://www.koeri.boun.edu.tr/ new/
References
Altinbilek, D. (2006). Water management in Istanbul. International Journal of Water Resources
Development, 22(2), 241–253. https://doi.org/10.1080/07900620600709563
Beler-Baykal, B., & Oructut, N. (2017). Grey water as reliable/renewable source of water for cities of the future and an appraisal based on Istanbul, Turkey. IWA cities of the future conference:
embrace the water. Gothenburg, Sweden.
Benblidia, M., & Margat, J. (2013). Organisé conjointement par le ministère des ressources en eau et.
les grands transferts d’eau en méditerranée. (organized jointly by the ministry of water resources. large water transfers in the Mediterranean (pp. 9-10). Alger: The Mediterranean Water Institute.
Boun-koeri. (2017). Temperature and precipitation data. Boğaziçi University - Kandilli Observatory and Earthquake Research Institute. Retrieved September 15, 2017, from http:// www.koeri.boun.edu.tr
Brown, R., Ashley, R., & Farrelly, M. (2011). Political and professional agency entrapment: An agenda for urban water research. Water Resources Management, 25(15), 4037–4050. https://doi. org/10.1007/s11269-011-9886-y
Burak, S., Bilge, A. H., & Dernek, D. (2017). A network model simulation proposal for river basin management plans (RBMPs) in Turkey. 10th world congress on water resources and environment
“Panta Rhei” (pp. 5-9), Athens, Greece.
Burak, S., Bilge, A. H., & Ulker, D. (2020). Computation of monthly runoff coefficients for Istanbul (Turkey). Thermal Science, 147. https://doi.org/10.2298/TSCI191102147B
Burak, S., & Margat, J. (2016). Water management in the mediterranean region: concepts and policies. Water Resources Management, 30(15), 5779–5797. https://doi.org/10.1007/s11269- 016-1389-4
Burak, S., & Mat, H. (2020). Urban and Industrial Water Uses. In: N. Harmancioglu, & D. Altinbilek (Eds.), Water Resources of Turkey. World Water Resources, (vol. 2, pp. 341–398). Springer: Cham. https://doi.org/10.1007/978-3-030-11729-0_11
Carrillo, M. (2003). Growth, life cycle and dynamic modelling. Mathematical and Computer
Modelling of Dynamical Systems, 9(2), 121–136. https://doi.org/10.1076/mcmd.9.2.121.16518
Dean, A. J., Lindsay, J., Fielding, K. S., & Smith, L. D. G. (2016). Fostering water sensitive citizenship–Community profiles of engagement in water-related issues. Environmental Science
& Policy, 55(1), 238–247. https://doi.org/10.1016/j.envsci.2015.10.016
Downward, S. R., & Taylor, R. (2007). An assessment of Spain’s Programa AGUA and its implications for sustainable water management in the province of Almería, southeast Spain.
Journal of Environmental Management, 82(2), 277–289. https://doi.org/10.1016/j.jenvman.2005. 12.015
DSI. (1991). Feasibility study for the Buyuk Melen System, stage 1. General Directorate of State Hydraulic Works.
Erfani, T., Pachos, K., & Harou, J. J. (2018). Real-options water supply planning: multistage scenario trees for adaptive and flexible capacity expansion under probabilistic climate change uncertainty. Water Resources Research, 54(7), 5069–5087. https://doi.org/10.1029/ 2017WR021803
Feng, S., Li, L. X., Duan, Z. G., & Zhang, J. L. (2007). Assessing the impacts of south-to-north water transfer project with decision support systems. Decision Support Systems, 42(4), 1989–2003.
https://doi.org/10.1016/j.dss.2004.11.004
Gleick, P. H. (1998). Water in crisis: Paths to sustainable water use. Ecological Applications, 8(3), 571–579. https://doi.org/10.1890/1051-0761(1998)008[0571:WICPTS]2.0.CO;2
Gohari, A., Eslamian, S., Mirchi, A., Abedi-Koupaei, J., Massah Bavani, A., & Madani, K. (2013). Water transfer as a solution to water shortage: A fix that can backfire. Journal of Hydrology, 491, 23–39. https://doi.org/10.1016/J.JHYDROL.2013.03.021
Greve, P., Kahil, T., Mochizuki, J., Schinko, T., Satoh, Y., Burek, P., . . . Langan, S. (2018). Global assessment of water challenges under uncertainty in water scarcity projections. Nature
Sustainability, 1(9), 486–494. https://doi.org/10.1038/s41893-018-0134-9
Gudulas, K., Voudouris, K., Soulios, G., & Dimopoulos, G. (2013). Comparison of different methods to estimate actual evapotranspiration and hydrologic balance. Desalination and
Water Treatment, 51(13–15), 2945–2954. https://doi.org/10.1080/19443994.2012.748443
Harou, J. J. (2019). Towards a national water resources planning framework in England.
Proceedings of the Institution of Civil Engineers-Water Management, 172(6), 271–272. https:// doi.org/10.1680/jwama.2019.172.6.271
Hattermann, F. F., Vetter, T., Breuer, L., Su, B., Daggupati, P., Donnelly, C., . . . Hoffmann, P. (2018). Sources of uncertainty in hydrological climate impact assessment: A cross-scale study.
Environmental Research Letters, 13(1), 15006. https://doi.org/10.1088/1748-9326/aa9938/meta
ICID. (2005). Experiences in interbasin water transfers for irrigation, drainage and flood
manage-ment. New Delhi: International Commission on Irrigation and Drainage ICID-CIID.
IPCC. (2014a). Contribution of working group ii to the fifth assessment report of the intergovern-mental panel on climate change. In C. B. Field, & V. R. Barros, (Eds.), Climate change 2014:
impacts, adaptation, and vulnerability. part a: global and sectoral aspects (pp. 1132). Cambridge
University Press. https://www.ipcc.ch/site/assets/uploads/2018/02/WGIIAR5-PartA_FINAL. pdf
IPCC. (2014b). Mitigation of climate change. In Contribution of Working Group III to the Fifth
Assessment Report of the Intergovernmental Panel on Climate Change. USA.
IPCC. (2018). Summary for policymakers Global Warming of 1.5°C: an IPCC Special Report on the Impacts of Global Warming of 1.5 C Above Pre-Industrial Levels and Related Global Greenhouse Gas Emissions Pathways, in the Context of Strengthening the Global Response to the Threat of Climate Change. World Meteorological Organization, 1-24. www.ipcc.ch/sr15/chapter/spm/
IPCC. (2019). Desertification. In: Climate Change and Land: An IPCC special report on climate
change, desertification, land degradation, sustainable land management, food security, and greenhouse gas fluxes in terrestrial ecosystems. In press. https://www.ipcc.ch/site/assets/ uploads/sites/4/2019/11/06_Chapter-3.pdf
ISKI. (2017a). Dam detail diagrams. Istanbul Water and Sewerage Administration. Retrieved February 22, 2017, from http://www.iski.istanbul/web/tr-TR/baraj-detay-grafikleri
ISKI. (2017b). Water Resources. Istanbul Water and Sewerage Administration. Retrieved July 17, 2017, from https://www.iski.istanbul/web/tr-TR/kurumsal/iski-hakkinda1/su-kaynaklari1
ISKI. (2017c). Water transfer from Yeşilçay and Melen weirs. Istanbul Water and Sewerage Administration.
ISKI. (2019). Activity report of 2019. Istanbul Water and Sewerage Administration. https://www. iski.gov.tr/web/assets/SayfalarDocs/faaliyetraporlari/faaliyetraporu/pdf/2019-FAALİYET- RAPORU.pdf
Kadioglu, M., & Şen, Z. (2001). Monthly precipitation-runoff polygons and mean runoff coefficients.
Hydrological Sciences Journal, 46(1), 3–11. https://doi.org/10.1080/02626660109492796
Klein, C. A. (2006). Water transfers: The case against transbasin diversions in the Eastern States.
UCLA J. Envtl. L. & Pol’y, 25, 249. https://heinonline.org/HOL/LandingPage?handle=hein. journals/uclalp25&div=12&id=&page=
Komuscu, A. U. (2001). An analysis of recent drought conditions in Turkey in relation to circulation patterns. Drought Network News, 13(2–3), 5-6. https://digitalcommons.unl.edu/ cgi/viewcontent.cgi?article=1021&context=droughtnetnews
Leeuwen, K. V., & Sjerps, R. (2016). Istanbul: The challenges of integrated water resources management in Europa’s megacity. Environment, Development and Sustainability, 18(1), 1–17. https://doi.org/10.1007/s10668-015-9636-z
Leroux, A. D., & Martin, V. L. (2016). Hedging supply risks: An optimal water portfolio. American
Journal of Agricultural Economics, 98(1), 276–296. https://doi.org/10.1093/ajae/aav014
Margat, J. (2009). The physical geography of the Mediterranean. Vol. 8. Ed. J. Woodward. Oxford University Press on Demand
Muller, M. (2018). Cape Town’s drought: Don’t blame climate change. Nature Publishing Group. National Academies of Sciences Engineering and Medicine. (2018). Review of the New York City
Department of Environmental Protection Operations Support Tool for Water Supply. Review of
the New York City Department of Environmental Protection Operations Support Tool for Water Supply (pp. 214). Washington, DC: The National Academies Press. https://doi.org/10.17226/ 25218.
Olden, J. D., & Naiman, R. J. (2010). Incorporating thermal regimes into environmental flows assessments: Modifying dam operations to restore freshwater ecosystem integrity. Freshwater
Biology, 55(1), 86–107. https://doi.org/10.1111/j.1365-2427.2009.02179.x
Olivera-Guerra, L., Mattar, C., & Galleguillos, M. (2014). Estimation of real evapotranspiration and its variation in mediterranean landscapes of central-southern Chile. International Journal of Applied
Earth Observation and Geoinformation, 28, 160–169. https://doi.org/10.1016/j.jag.2013.11.012
Ozis, U., Alkan, A., & Ozdemir, Y. (2020). Water Works of Ancient Civilizations. In: N. Harmancioglu, & D. Altinbilek (Eds.), Water Resources of Turkey. World Water Resources, (vol 2). Cham: Springer. https://doi.org/10.1007/978-3-030-11729-0_2
Ranatunga, T., Tong, S. T. Y., Sun, Y., & Yang, Y. J. (2014). A total water management analysis of the Las Vegas Wash watershed, Nevada. Physical Geography, 35(3), 220–244. https://doi.org/ doi.org/10.1080/02723646.2014.908763
Raymond, F., Ullmann, A., Camberlin, P., Drobinski, P., & Smith, C. C. (2016). Extreme dry spell detection and climatology over the mediterranean basin during the wet season. Geophysical
Research Letters, 43(13), 7196–7204. https://doi.org/10.1002/2016GL069758
Saatci, A. M. (2013). Solving water problems of a metropolis. Journal of Water Resource and
Protection, 5(4), 7–10. https://doi.org/10.4236/jwarp.2013.54A002
Savun-Hekimoğlu, B., Erbay, B., Hekimoğlu, M., & Burak, S. (2020). Evaluation of water supply alternatives for Istanbul using forecasting and multi-criteria decision making methods. Journal
of Cleaner Production, 287(125080), 1-14. https://doi.org/10.1016/j.jclepro.2020.125080
Serengil, Y., Gökbulak, F., Özhan, S., Hızal, A., & Şengönül, K. (2007). Alteration of stream nutrient discharge with increased sedimentation due to thinning of a deciduous forest in Istanbul. Forest Ecology and Management, 246(2–3), 264–272. https://doi.org/10.1016/j.foreco. 2007.04.008
Serrao-Neumann, S., Renouf, M., Kenway, S. J., & Choy, D. L. (2017). Connecting land-use and water planning: Prospects for an urban water metabolism approach. Cities, 60 (Part A), 13–27.
https://doi.org/10.1016/j.cities.2016.07.003
Serrao-Neumann, S., Renouf, M. A., Morgan, E., Kenway, S. J., & Choy, D. L. (2019). Urban water metabolism information for planning water sensitive city-regions. Land Use Policy, 88(104144).
https://doi.org/10.1016/j.landusepol.2019.104144
Sinha, P., Rollason, E., Bracken, L. J., Wainwright, J., & Reaney, S. M. (2020). A new framework for integrated, holistic, and transparent evaluation of inter-basin water transfer schemes. Science of
the Total Environment, 721(137646). https://doi.org/10.1016/j.scitotenv.2020.137646
Svensson, C., Hannaford, J., & Prosdocimi, I. (2017). Statistical distributions for monthly aggrega-tions of precipitation and streamflow in drought indicator applicaaggrega-tions. Water Resources
Research, 53(2), 999–1018. https://doi.org/10.1002/2016WR019276
The Metropolitan Water District of Southern California. (2016). Integrated Water Resources Plan:
2015 Update - Report No, 1518, 106. http://www.mwdh2o.com/PDF_About_Your_Water/
Toosi, S. L. R., & Samani, J. M. V. (2012). Evaluating water transfer projects using analytic network process (ANP). Water Resources Management, 26(7), 1999–2014. https://doi.org/10.1007/ s11269-012-9995-2
Tortajada, C. (2006). Water management in Singapore. Water Resources Development, 22(2), 227–240. https://doi.org/10.1080/07900620600691944
Tramblay, Y., Koutroulis, A., Samaniego, L., Vicente-Serrano, S. M., Volaire, F., Boone, A., . . . Burak, S. (2020). Challenges for drought assessment in the Mediterranean region under future climate scenarios. Earth-Science Reviews, 210(103348). https://doi.org/10.1016/j.earscirev.2020. 103348
Trenberth, K. E., Smith, L., Qian, T., Dai, A., & Fasullo, J. (2007). Estimates of the global water budget and its annual cycle using observational and model data. Journal of Hydrometeorology, 8 (4), 758–769. https://doi.org/10.1175/JHM600.1
Trigo, R. M., Añel, J., Barriopedro, D., García-Herrera, R., Gimeno, L., Nieto, R., . . . Massey, N. (2013). The record winter drought of 2011–12 in the Iberian Peninsula. Bulletin of the American
Meteorological Society, 94(9), S41–S45.
Turkes, M., Turp, M. T., An, N., Ozturk, T., & Kurnaz, M. L. (2020). Impacts of Climate Change on Precipitation Climatology and Variability in Turkey. In: N. Harmancioglu, & D. Altinbilek (Eds.), Water Resources of Turkey. World Water Resources, (vol 2, pp. 467-491). Cham: Springer.
https://doi.org/10.1007/978-3-030-11729-0_14
TURKSTAT. (2018). Population Projections. Turkish Statistical Institute. http://www.tuik.gov.tr/ PreTablo.do?alt_id=1047
UN-Water. (2015). Compendium of water quality regulatory frameworks: which water for which
use? UN-Water. https://www.iwa-network.org/which-water-for-which-use
UN-Water, U. (2020). United Nations World Water Development Report 2020: Water and Climate
Change. UNESCO: France.
Varis, O., Biswas, A. K., Tortajada, C., & Lundqvist, J. (2006). Megacities and water management.
Water Resources Development, 22(2), 377–394. https://doi.org/10.1080/07900620600684550
Yan, D. H., Wang, H., Li, H. H., Wang, G., Qin, T. L., Wang, D. Y., & Wang, L. H. (2012).
Quantitative Analysis on the Environmental Impact of Large-scale Water Transfer Project on Water Resource Area in a Changing Environment. Hydrology & Earth System Sciences, 16, 8.
https://doi.org/10.5194/hess-16-2685-2012
Zhao, Y., He, G., Wang, J., Gao, X., Li, H., Zhu, Y., & Jiang, S. (2020). Water stress assessment integrated with virtual water trade and physical transfer water: A case study of Beijing, China.
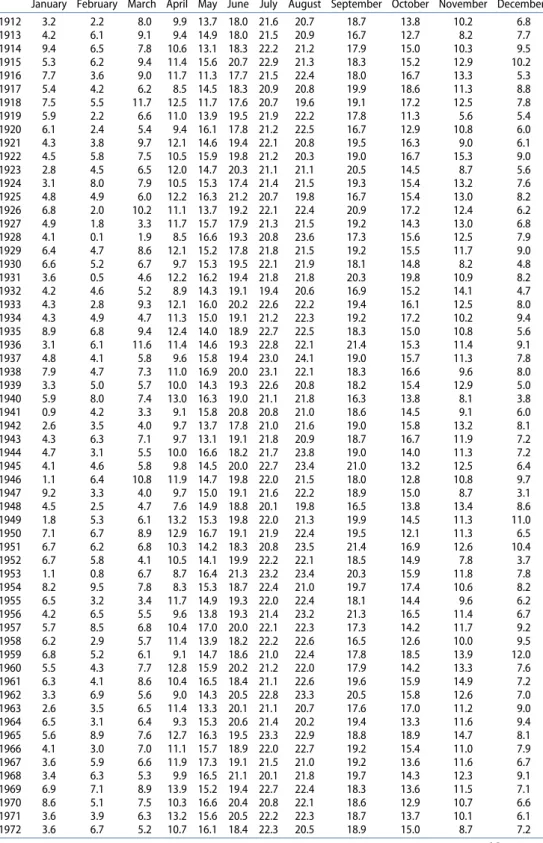
Table A1. Monthly temperature data for Istanbul between 1912–2016.
January February March April May June July August September October November December
1912 3.2 2.2 8.0 9.9 13.7 18.0 21.6 20.7 18.7 13.8 10.2 6.8 1913 4.2 6.1 9.1 9.4 14.9 18.0 21.5 20.9 16.7 12.7 8.2 7.7 1914 9.4 6.5 7.8 10.6 13.1 18.3 22.2 21.2 17.9 15.0 10.3 9.5 1915 5.3 6.2 9.4 11.4 15.6 20.7 22.9 21.3 18.3 15.2 12.9 10.2 1916 7.7 3.6 9.0 11.7 11.3 17.7 21.5 22.4 18.0 16.7 13.3 5.3 1917 5.4 4.2 6.2 8.5 14.5 18.3 20.9 20.8 19.9 18.6 11.3 8.8 1918 7.5 5.5 11.7 12.5 11.7 17.6 20.7 19.6 19.1 17.2 12.5 7.8 1919 5.9 2.2 6.6 11.0 13.9 19.5 21.9 22.2 17.8 11.3 5.6 5.4 1920 6.1 2.4 5.4 9.4 16.1 17.8 21.2 22.5 16.7 12.9 10.8 6.0 1921 4.3 3.8 9.7 12.1 14.6 19.4 22.1 20.8 19.5 16.3 9.0 6.1 1922 4.5 5.8 7.5 10.5 15.9 19.8 21.2 20.3 19.0 16.7 15.3 9.0 1923 2.8 4.5 6.5 12.0 14.7 20.3 21.1 21.1 20.5 14.5 8.7 5.6 1924 3.1 8.0 7.9 10.5 15.3 17.4 21.4 21.5 19.3 15.4 13.2 7.6 1925 4.8 4.9 6.0 12.2 16.3 21.2 20.7 19.8 16.7 15.4 13.0 8.2 1926 6.8 2.0 10.2 11.1 13.7 19.2 22.1 22.4 20.9 17.2 12.4 6.2 1927 4.9 1.8 3.3 11.7 15.7 17.9 21.3 21.5 19.2 14.3 13.0 6.8 1928 4.1 0.1 1.9 8.5 16.6 19.3 20.8 23.6 17.3 15.6 12.5 7.9 1929 6.4 4.7 8.6 12.1 15.2 17.8 21.8 21.5 19.2 15.5 11.7 9.0 1930 6.6 5.2 6.7 9.7 15.3 19.5 22.1 21.9 18.1 14.8 8.2 4.8 1931 3.6 0.5 4.6 12.2 16.2 19.4 21.8 21.8 20.3 19.8 10.9 8.2 1932 4.2 4.6 5.2 8.9 14.3 19.1 19.4 20.6 16.9 15.2 14.1 4.7 1933 4.3 2.8 9.3 12.1 16.0 20.2 22.6 22.2 19.4 16.1 12.5 8.0 1934 4.3 4.9 4.7 11.3 15.0 19.1 21.2 22.3 19.2 17.2 10.2 9.4 1935 8.9 6.8 9.4 12.4 14.0 18.9 22.7 22.5 18.3 15.0 10.8 5.6 1936 3.1 6.1 11.6 11.4 14.6 19.3 22.8 22.1 21.4 15.3 11.4 9.1 1937 4.8 4.1 5.8 9.6 15.8 19.4 23.0 24.1 19.0 15.7 11.3 7.8 1938 7.9 4.7 7.3 11.0 16.9 20.0 23.1 22.1 18.3 16.6 9.6 8.0 1939 3.3 5.0 5.7 10.0 14.3 19.3 22.6 20.8 18.2 15.4 12.9 5.0 1940 5.9 8.0 7.4 13.0 16.3 19.0 21.1 21.8 16.3 13.8 8.1 3.8 1941 0.9 4.2 3.3 9.1 15.8 20.8 20.8 21.0 18.6 14.5 9.1 6.0 1942 2.6 3.5 4.0 9.7 13.7 17.8 21.0 21.6 19.0 15.8 13.2 8.1 1943 4.3 6.3 7.1 9.7 13.1 19.1 21.8 20.9 18.7 16.7 11.9 7.2 1944 4.7 3.1 5.5 10.0 16.6 18.2 21.7 23.8 19.0 14.0 11.3 7.2 1945 4.1 4.6 5.8 9.8 14.5 20.0 22.7 23.4 21.0 13.2 12.5 6.4 1946 1.1 6.4 10.8 11.9 14.7 19.8 22.0 21.5 18.0 12.8 10.8 9.7 1947 9.2 3.3 4.0 9.7 15.0 19.1 21.6 22.2 18.9 15.0 8.7 3.1 1948 4.5 2.5 4.7 7.6 14.9 18.8 20.1 19.8 16.5 13.8 13.4 8.6 1949 1.8 5.3 6.1 13.2 15.3 19.8 22.0 21.3 19.9 14.5 11.3 11.0 1950 7.1 6.7 8.9 12.9 16.7 19.1 21.9 22.4 19.5 12.1 11.3 6.5 1951 6.7 6.2 6.8 10.3 14.2 18.3 20.8 23.5 21.4 16.9 12.6 10.4 1952 6.7 5.8 4.1 10.5 14.1 19.9 22.2 22.1 18.5 14.9 7.8 3.7 1953 1.1 0.8 6.7 8.7 16.4 21.3 23.2 23.4 20.3 15.9 11.8 7.8 1954 8.2 9.5 7.8 8.3 15.3 18.7 22.4 21.0 19.7 17.4 10.6 8.2 1955 6.5 3.2 3.4 11.7 14.9 19.3 22.0 22.4 18.1 14.4 9.6 6.2 1956 4.2 6.5 5.5 9.6 13.8 19.3 21.4 23.2 21.3 16.5 11.4 6.7 1957 5.7 8.5 6.8 10.4 17.0 20.0 22.1 22.3 17.3 14.2 11.7 9.2 1958 6.2 2.9 5.7 11.4 13.9 18.2 22.2 22.6 16.5 12.6 10.0 9.5 1959 6.8 5.2 6.1 9.1 14.7 18.6 21.0 22.4 17.8 18.5 13.9 12.0 1960 5.5 4.3 7.7 12.8 15.9 20.2 21.2 22.0 17.9 14.2 13.3 7.6 1961 6.3 4.1 8.6 10.4 16.5 18.4 21.1 22.6 19.6 15.9 14.9 7.2 1962 3.3 6.9 5.6 9.0 14.3 20.5 22.8 23.3 20.5 15.8 12.6 7.0 1963 2.6 3.5 6.5 11.4 13.3 20.1 21.1 20.7 17.6 17.0 11.2 9.0 1964 6.5 3.1 6.4 9.3 15.3 20.6 21.4 20.2 19.4 13.3 11.6 9.4 1965 5.6 8.9 7.6 12.7 16.3 19.5 23.3 22.9 18.8 18.9 14.7 8.1 1966 4.1 3.0 7.0 11.1 15.7 18.9 22.0 22.7 19.2 15.4 11.0 7.9 1967 3.6 5.9 6.6 11.9 17.3 19.1 21.5 21.0 19.2 13.6 11.6 6.7 1968 3.4 6.3 5.3 9.9 16.5 21.1 20.1 21.8 19.7 14.3 12.3 9.1 1969 6.9 7.1 8.9 13.9 15.2 19.4 22.7 22.4 18.3 13.6 11.5 7.1 1970 8.6 5.1 7.5 10.3 16.6 20.4 20.8 22.1 18.6 12.9 10.7 6.6 1971 3.6 3.9 6.3 13.2 15.6 20.5 22.2 22.3 18.7 13.7 10.1 6.1 1972 3.6 6.7 5.2 10.7 16.1 18.4 22.3 20.5 18.9 15.0 8.7 7.2 (Continued)
Table A1. (Continued).
January February March April May June July August September October November December
1973 2.7 5.4 5.9 9.7 15.2 19.4 21.2 20.7 19.0 17.8 10.9 6.9 1974 5.4 3.8 10.1 13.2 15.7 20.3 22.9 21.6 19.6 14.6 9.6 5.5 1975 5.2 2.9 4.8 11.3 14.5 18.8 22.0 19.3 17.9 14.5 11.3 7.5 1976 5.9 9.3 7.1 10.9 15.2 19.7 21.6 22.3 17.8 12.1 12.5 5.5 1977 4.7 6.6 7.7 11.0 15.7 20.1 21.4 20.2 17.7 14.5 9.5 7.6 1978 5.7 5.7 9.5 11.6 15.8 21.1 21.2 21.8 18.8 14.0 11.4 8.1 1979 3.2 3.7 5.6 9.9 15.5 19.3 21.4 21.1 16.9 16.6 11.8 7.9 1980 4.6 4.5 8.0 11.0 13.4 20.3 20.6 21.1 18.3 16.5 8.6 9.5 1981 4.8 3.1 5.6 9.7 13.8 20.1 20.2 20.9 20.0 15.4 10.4 9.1 1982 4.5 4.5 7.3 12.6 17.0 18.7 22.2 20.8 18.7 13.5 9.1 7.7 1983 6.7 4.9 6.2 8.4 17.5 19.3 20.7 20.2 20.4 16.4 11.1 6.5 1984 5.8 0.8 5.1 11.9 17.0 19.6 20.5 22.1 18.0 12.7 11.4 8.2 1985 7.0 5.2 5.5 12.4 14.1 20.6 21.8 23.0 19.2 13.6 8.4 5.8 1986 4.7 6.1 3.4 9.3 15.0 19.8 22.2 20.4 19.1 13.2 11.3 6.2 1987 6.4 5.7 8.2 10.4 15.1 20.3 23.3 22.5 18.8 13.5 6.7 6.1 1988 3.9 5.8 8.7 14.4 15.2 19.4 21.6 22.6 19.2 13.8 8.9 6.4 1989 4.1 5.4 8.4 12.4 14.3 19.6 21.8 21.6 18.0 14.9 13.3 8.4 1990 5.1 4.0 5.3 9.7 14.9 19.5 22.1 22.5 18.5 15.3 10.8 3.8 1991 3.9 3.1 6.8 11.7 13.3 20.3 20.6 23.3 18.5 17.3 10.2 4.7 1992 3.9 2.4 6.3 10.5 14.6 20.0 21.0 22.3 18.9 16.8 8.7 8.4 1993 7.4 4.9 8.1 13.3 17.1 19.5 22.8 23.2 22.4 17.3 9.3 5.9 1994 5.6 6.7 8.5 11.0 15.7 21.5 22.4 22.4 19.5 13.6 8.0 6.9 1995 3.8 4.6 3.8 9.0 17.5 19.8 22.0 22.3 18.3 13.4 11.9 9.0 1996 5.9 4.7 5.2 8.2 15.6 19.8 22.4 20.4 16.2 13.5 11.0 7.5 1997 5.8 5.2 5.2 13.3 15.5 21.1 22.8 23.4 19.3 16.2 10.8 5.6 1998 6.2 5.7 8.5 13.5 16.4 20.6 23.7 23.1 19.6 15.4 10.7 10.0 1999 2.5 5.6 7.1 13.5 15.6 19.5 23.9 22.7 19.9 14.7 13.2 8.8 2000 7.7 7.1 11.9 12.8 15.8 20.5 24.4 23.7 20.7 15.9 10.1 3.9 2001 4.2 8.0 8.8 9.9 15.6 21.1 25.0 22.9 19.5 15.6 12.3 5.6 2002 7.1 1.6 4.0 8.5 16.8 21.4 23.4 23.8 18.4 15.5 10.1 7.0 2003 4.6 5.6 7.9 11.5 15.4 19.9 21.6 21.9 19.5 16.1 11.1 8.1 2004 6.2 5.2 6.7 11.7 15.7 19.0 22.8 23.6 19.7 14.0 9.6 8.0 2005 3.7 4.8 8.1 11.5 16.2 20.6 22.2 24.5 19.1 15.8 10.0 7.4 2006 7.8 6.7 8.5 10.7 17.9 22.9 23.9 24.5 19.8 16.0 10.0 6.2 2007 4.0 5.4 10.4 13.9 16.9 21.6 23.1 23.9 19.2 15.7 12.2 8.4 2008 6.9 6.2 7.8 10.3 17.1 22.1 23.8 22.6 19.4 17.2 12.1 9.5 2009 5.8 7.3 7.6 11.5 17.4 20.1 22.7 24.8 19.8 13.6 15.0 9.5 2010 5.6 4.8 6.9 8.5 14.5 17.9 23.5 21.8 20.3 13.2 7.9 8.2 2011 3.7 2.8 6.3 13.4 16.0 21.7 24.4 23.2 20.5 18.2 13.2 7.0 2012 6.2 6.8 9.2 12.8 18.2 20.4 22.3 23.3 19.7 13.5 12.7 6.0 2013 8.1 7.6 9.7 12.7 16.7 19.8 22.8 23.3 19.6 15.2 11.0 8.6 2014 6.2 5.9 7.2 10.5 16.6 19.2 22.6 23.8 21.3 15.1 13.0 7.4 2015 5.2 9.3 9.7 14.9 16.3 21.4 23.0 23.3 19.9 14.7 11.1 4.2 2016 2.4 5.8 7.9 10.7 14.9 20.5 22.4 22.6 20.9 14.7 11.5 9.8
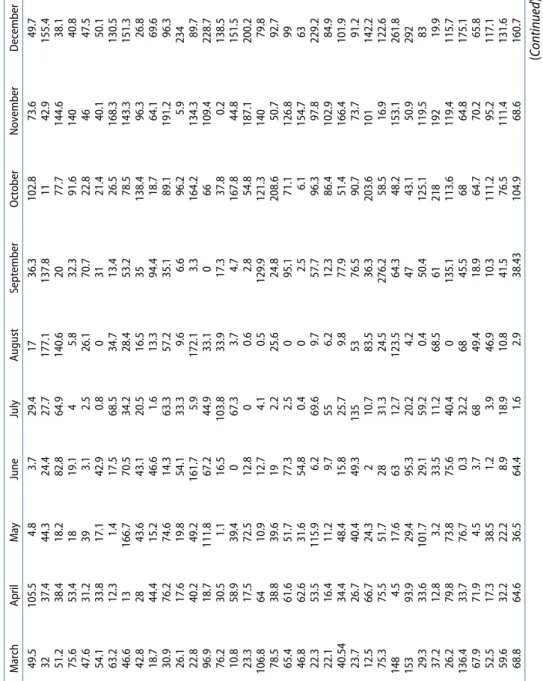
Table A2. Monthly precipitation data for Istanbul between 1912–2016. January February March April May June July August September October November December 1912 92.3 37.8 49.5 105.5 4.8 3.7 29.4 17 36.3 102.8 73.6 49.7 1913 161.9 115.3 32 37.4 44.3 24.4 27.7 177.1 137.8 11 42.9 155.4 1914 89.1 4 51.2 38.4 18.2 82.8 64.9 140.6 20 77.7 144.6 38.1 1915 92.3 87.4 75.6 53.4 18 19.1 4 5.8 32.3 91.6 140 40.8 1916 58.6 58.8 47.6 31.2 39 3.1 2.5 26.1 70.7 22.8 46 47.5 1917 102.9 69.6 54.1 33.8 17.1 42.9 0.8 0 31 21.4 40.1 50.1 1918 103.2 66.1 63.2 12.3 1.4 17.5 68.5 34.7 13.4 26.5 168.3 130.5 1919 50.6 89.7 46.6 13 166.7 70.5 34.2 28.4 53.2 78.5 143.3 151.3 1920 94.2 94.6 42.8 28 43.6 43.1 20.5 16.5 35 138.4 96.3 26.8 1921 22.5 39.6 18.7 44.4 15.2 46.6 1.6 13.3 94.4 18.7 64.1 69.6 1922 214 64.7 30.9 76.2 74.6 14.3 63.3 57.2 35.1 89.1 191.2 96.3 1923 96.7 93.8 26.1 17.6 19.8 54.1 33.3 9.6 6.6 96.2 5.9 234 1924 59.8 86.9 22.8 40.2 49.2 161.7 5.9 172.1 3.3 164.2 134.3 89.7 1925 20.1 11.1 96.9 18.7 111.8 67.2 44.9 33.1 0 66 109.4 228.7 1926 145.2 19.1 76.2 30.5 1.1 16.5 103.8 33.9 17.3 37.8 0.2 138.5 1927 42.3 201.9 10.8 58.9 39.4 0 67.3 3.7 4.7 167.8 44.8 151.5 1928 39.3 78.05 23.3 17.5 72.5 12.8 0 0.6 2.8 54.8 187.1 200.2 1929 86.2 9.04 106.8 64 10.9 12.7 4.1 0.5 129.9 121.3 140 79.8 1930 85.2 56.7 78.5 38.8 39.6 19 2.2 25.6 24.8 208.6 50.7 92.7 1931 103.9 125 65.4 61.6 51.7 77.3 2.5 0 95.1 71.1 126.8 99 1932 123.8 98 46.8 62.6 31.6 54.8 0.4 0 2.5 6.1 154.7 63 1933 85.2 106.5 22.3 53.5 115.9 6.2 69.6 9.7 57.7 96.3 97.8 229.2 1934 108.1 23.8 22.1 16.4 11.2 9.7 55 6.2 12.3 86.4 102.9 84.9 1935 96.5 92.4 40.54 34.4 48.4 15.8 25.7 9.8 77.9 51.4 166.4 101.9 1936 36 185.8 23.7 26.7 40.4 49.3 135 53 76.5 90.7 73.7 91.2 1937 125.3 79.9 12.5 66.7 24.3 2 10.7 83.5 36.3 203.6 101 142.2 1938 95.5 47 75.3 75.5 51.7 28 31.3 24.5 276.2 58.5 16.9 122.6 1939 53.1 60.3 148 4.5 17.6 63 12.7 123.5 64.3 48.2 153.1 261.8 1940 106.9 106.1 153 93.9 29.4 95.3 20.2 4.2 47 43.1 50.9 292 1941 67.1 84.8 29.3 33.6 101.7 29.1 59.2 0.4 50.4 125.1 119.5 83 1942 136.9 76.6 37.2 12.8 3.2 33.5 11.2 68.5 61 218 192 19.9 1943 124.4 24.1 26.2 79.8 73.8 75.6 40.4 0 135.1 113.6 119.4 115.7 1944 91.8 78.9 136.4 33.7 76.7 0.3 32.2 68 45.5 68 64.8 175.1 1945 198.9 67.54 67.9 71.9 4.5 3.7 68 49.4 18.9 64.7 70.2 65.8 1946 61.8 101.6 52.5 17.3 38.5 1.2 3.9 46.9 10.3 111.2 95.2 117.1 1947 97.5 110.6 59.6 32.2 22.2 8.9 18.9 10.8 41.5 76.5 111.4 131.6 1948 120.5 229.8 68.8 64.6 36.5 64.4 1.6 2.9 38.43 104.9 68.6 160.7 (Continued )
Table A2. (Continued). January February March April May June July August September October November December 1949 22.6 68 90.4 110.7 4 80.8 98.2 11.7 222.4 2.6 96.6 153.04 1950 131.7 53.2 127.5 20 27.9 10.6 17.5 23.4 27.5 110.3 116 78 1951 126.8 65 69.8 44.2 42.4 42.9 171.2 93.6 15.5 162.8 84.6 145.5 1952 135.1 126.7 66.9 5.7 30.8 33.5 13.7 2.1 38.2 87.8 139.2 92.9 1953 168.4 144.4 113.4 69.5 59.2 39.9 0.1 7 59.8 113.1 50.5 89.6 1954 131.6 84 43 29.2 30.2 8.3 4.7 39.8 82 14.2 61 86.7 1955 86.1 84.2 80.2 66 2.2 19.6 62.7 81.6 89.6 50.7 348.1 84.7 1956 80.3 225.1 125.8 25.7 14.7 24.8 8.4 5.9 32 37.5 73.6 71.9 1957 46.9 43.6 52.4 49.6 65.72 3.1 2.6 21 20.4 42.7 124.4 180.8 1958 140.4 67 188.9 57.4 12.5 22.1 5.7 14.9 173.5 70.6 38 103.8 1959 185.4 58.3 55.5 20 62.1 58.6 57.1 4.9 120.8 43 101.8 93.7 1960 135.3 47.3 62.8 59.9 22.1 62.9 16.4 45.1 93.3 57.7 39 117.4 1961 106 86.9 54 29.2 70.2 55.2 0.3 1.9 399.4 138.2 53.2 144.7 1962 83.9 99.1 162.3 46.2 5.2 33.3 38.6 1.7 125.1 135.9 112.1 292.8 1963 182.7 137.9 120.4 38.3 12.7 7.3 16.4 0.3 62.6 108.5 34.5 284.1 1964 68.1 93.4 45.4 36.8 46.7 4 12.2 54.1 234.1 4.7 96.1 190.1 1965 50.8 196.4 81.4 161.3 26.9 3.2 46.6 10.2 62.6 83.7 214.8 164.1 1966 173.7 15.3 130.6 40.8 9.3 7.1 0.7 45.1 158.4 8.7 121.2 190.3 1967 154.5 63.9 67.4 50.1 32.7 24.6 3.9 3.2 50.3 63.7 60.5 120 1968 272.4 83.9 68.6 47.9 18.1 29.5 2 48.7 81 54.1 145.3 183.7 1969 206.2 89 66.7 102.4 16.2 53.6 25.7 0.9 47.7 30.8 50 175.1 1970 135.7 146.9 75 103.5 51.5 11.5 4.8 5.8 107.1 113.6 93.7 116.8 1971 90.6 93.3 169.2 18.6 24.2 35 1.9 12.4 62.03 171 99.8 133.7 1972 64.8 55.6 20.1 50.9 23.8 20.1 64.8 39.4 151.1 152.9 110.9 46.8 1973 69.5 88.2 62.8 57.4 27 33.1 13.1 22.4 51 177.3 88.4 71.1 1974 118.7 59.8 64.8 56.7 153.9 17.4 42.2 141.2 47.8 21.9 85.3 108.6 1975 131.3 80.3 90.4 31.5 58.7 45.8 12.4 106.9 33.5 93.9 74 111.2 1976 66.8 52.6 25.8 25.9 10.9 21.3 47.4 42.4 135.4 84.5 79.1 142.7 1977 61.6 17 75.3 64.5 9.4 35.3 99.1 4.2 62.6 44.9 83.5 178.9 1978 144.5 80.1 65.4 95.6 27 5.7 5.6 38.6 113.2 168.9 80.5 104.8 1979 147.7 62 14.1 68.8 9.4 13.7 86 111.3 41.7 100.1 116.2 128.6 1980 151.5 119.8 124.5 43.5 51.5 20.4 14.8 53.9 55.5 6.3 158.82 121 1981 217.5 138.9 66.3 25.1 75.3 34.6 57.9 61.6 168.3 51.1 165.6 227.2 1982 106.4 106.7 40.9 84.6 44.5 3.7 61.9 30.6 68 20.9 59.9 131.6 1983 131 93 14.7 34.9 23.9 66.1 25.4 11.9 110.6 88.4 99.4 39 1984 103.7 130.4 93 56 21.7 21.9 32.3 40.9 211.5 75.5 86 38.5 1985 200.6 83.9 38.7 25.8 5.9 16.4 47.4 2.4 14.7 296.1 177 75.4 (Continued )
Table A2. (Continued). January February March April May June July August September October November December 1986 172.3 119.9 22.5 38.1 0.1 71.4 2.9 0.1 27.7 130.2 48.4 112.3 1987 141.7 32.6 160.9 45.4 17.5 59.4 101.3 106.2 2.6 159.1 98.1 193.4 1988 25.2 47.7 52.3 60.4 27.2 67.4 32.6 1.1 25.3 100.6 222.7 183.8 1989 38.8 17.8 30.1 11.6 60.9 23.1 3.3 17.5 11.2 126.3 132.7 82.8 1990 39.7 56.6 9.9 43 67.4 69 5.1 80.5 98 81.4 145.2 173.5 1991 57.7 49.1 41.3 132.5 86.3 8.8 62.1 29.8 84.3 67.5 63.7 189.6 1992 21.4 77.3 129.6 55.2 35.7 61.3 67.7 0 12.2 85 108.3 101.4 1993 79 58 40.4 27 52.1 34.8 6.9 8.6 96.6 9.8 185.3 59.9 1994 70.5 50.4 29.9 31.9 42.7 90.5 28.8 24.2 1.3 126.1 111.9 148 1995 152 43.3 85.2 45 7.6 23.1 88.8 54.7 99.4 46.6 134.5 90.2 1996 88.6 129.2 104.7 72.3 37.6 13.8 0 18.1 104.4 76.6 42.8 186.6 1997 48.7 58.5 74.5 109.6 30.2 52.7 78.5 134.5 8.5 316 36.3 221.7 1998 54.7 65.6 145.1 40.4 103.1 9.1 37.4 0.1 48.3 124.9 94.4 154.7 1999 57.7 136.5 72 12.1 9.3 70.8 29.7 76.2 27.2 33 132.7 144.3 2000 139.1 93.7 86.3 78.4 43.8 26.6 7.5 45.8 56.6 99.2 45 87.7 2001 58.6 80.2 45.1 60.6 37.5 5.2 12.3 46.6 42.5 18.3 210.7 432.2 2002 90.3 44.8 69.7 45.6 19.1 26 20.8 164.7 117.2 59.4 99.7 88.7 2003 83 189.8 47.2 88 1.3 2 5 0 52.1 122.8 110.2 127.7 2004 195.5 73.3 71.4 22 45.6 22 25.8 96.4 12.1 218.7 110.7 56.5 2005 173.6 146.1 63.4 26.3 11.8 22.9 29.9 10.6 56.6 100 118.7 129.6 2006 143.4 147.9 104.6 18.7 9.8 54.6 1.4 9.5 118.4 128.3 74.3 29.3 2007 32.3 24.1 51.6 10.2 35.5 25.1 11.9 7.7 21.9 136.4 138.8 79.8 2008 51.2 80.6 82 19.1 14.7 6.7 61 32.3 107.2 225.4 100.4 118.6 2009 93.2 194.5 123.8 27 10.1 5.5 37.4 6.4 62.2 112.2 76 182.5 2010 185.1 105.4 69.5 34.3 25.3 179.5 85.7 6.3 59.5 301.1 9 131.5 2011 81.5 42.6 47.2 91.8 23.6 21.7 13.8 14 27.3 108 27.9 116 2012 110.4 107.9 52.3 112.9 55.3 20.1 1.2 45 13.8 52 82.6 156.7 2013 95.8 58.8 69.7 34.6 25.5 40.5 2.1 11.9 16 90.1 39.9 68.1 2014 28 46.4 95.1 46.5 55.9 106.7 80.2 57.3 125.9 90.5 88.4 146.9 2015 106.2 188.2 49.9 80.7 71.5 72.9 0 44 86.4 116.4 41.6 61.6 2016 153.6 103.22 91.2 19.9 42 37 11.6 42.7 30.3 37.7 153.6 189.2