Personality and Social Psychology Bulletin 39(12) 1656 –1667
© 2013 by the Society for Personality and Social Psychology, Inc Reprints and permissions: sagepub.com/journalsPermissions.nav DOI: 10.1177/0146167213500149 pspb.sagepub.com
Article
There can be no doubt that multicultural diversity has become an everyday reality for the citizens of many coun-tries. According to the United Nations (UN), more than 195 million people worldwide reside in a country other than that of their birth (UN, 2008). In the United Kingdom, the site of this research, some 7.9% of the population (or 4.6 million) now define themselves as belonging to an eth-nic minority group (Office for National Statistics, 2004). With such cultural plurality come many social challenges as the members of the different groups in society seek to find harmonious—or at least non-conflictual—mutual accommodations. Psychologically, the study of these mutual accommodations falls into the province of accul-turation research (Brown & Zagefka, 2011). Within this literature, a recurring issue has been to identify the social-psychological costs and benefits for individuals adopting different acculturation strategies. Here, we seek to make a further contribution to this literature by presenting some longitudinal data from a sample of young British South Asian children. As will become clear, such findings have the potential to address several important questions about the nature and consequences of acculturation attitudes in ethnic minority group children.
Berry’s Acculturation Framework
In acculturation research, an influential framework has been that of Berry and his associates (e.g., Berry, 1997). This framework conceptualizes acculturation in terms of two independent dimensions: the wish to preserve distinctive aspects of one’s cultural identity (desire for cultural mainte-nance [CM]) and the wish to have contact with the culture of another group (desire for intergroup contact [DC]). Berry argues that, depending on their positions on these dimen-sions, people can be classified as adopting one of four accul-turation strategies: integration (high on CM and DC), assimilation (low on CM, high on DC), separation (high on CM, low on DC), or marginalization (low on both). Berry
1Sussex University, Brighton, UK 2Kadir Has University, Istanbul, Turkey 3University of Kent, Canterbury, UK 4Canterbury Christ Church University, UK
5Rutgers, the State University of New Jersey, New Brunswick, USA
Corresponding Author:
Rupert Brown, School of Psychology, University of Sussex, Pevensey 1, Falmer, Brighton, BN1 9QH, UK.
Email: [email protected]
Acculturation Attitudes and Social
Adjustment in British South Asian
Children: A Longitudinal Study
Rupert Brown
1, Gülseli Baysu
2, Lindsey Cameron
3, Dennis
Nigbur
4, Adam Rutland
3, Charles Watters
5, Rosa Hossain
3,
Dominique LeTouze
1, and Anick Landau
1Abstract
A 1-year longitudinal study with three testing points was conducted with 215 British Asian children aged 5 to 11 years to test hypotheses from Berry’s acculturation framework. Using age-appropriate measures of acculturation attitudes and psychosocial outcomes, it was found that (a) children generally favored an “integrationist” attitude, and this was more pronounced among older (8-10 years) than in younger (5-7 years) children and (b) temporal changes in social self-esteem and peer acceptance were associated with different acculturation attitudes held initially, as shown by latent growth curve analyses. However, a supplementary time-lagged regression analysis revealed that children’s earlier “integrationist” attitudes may be associated with more emotional symptoms (based on teachers’ ratings) 6 months later. The implications of these different outcomes of children’s acculturation attitudes are discussed.
Keywords
Acculturation, development, intergroup relations, well-being Received July 19, 2012; revision accepted July 10, 2013
Brown et al. 1657 (1997) has hypothesized that an integrationist strategy will
generally result in the most favorable psychosocial outcomes and marginalization the least favorable.
A substantial body of research has now accumulated that has investigated the correlates of different acculturation strategies (Berry, 1997; Berry, Phinney, Sam, & Vedder, 2006; Rudmin, 2003). Much, but not all, of this research has supported Berry’s hypothesis: On a variety of well-being indicators—life satisfaction, self-esteem, social adjust-ment—people holding “integrationist” or bicultural attitudes often score higher than those who are oriented toward just one cultural group (Nguyen & Benet-Martinez, 2013). However, empirical consensus has been less than perfect (Brown & Zagefka, 2011). Rudmin (2003) points out that the correlations between different acculturation orientations and psychosocial outcomes reported in some studies did not always follow the predicted pattern. Indeed, in Berry et al.’s (2006) own cross-national study, while an “integration” ori-entation was positively related to adaptation, the amount of variance it explained (3%) was low, and certainly lower than that explained by perceived discrimination. Moreover, “sep-aration” was also positively associated with adaptation. In sum, an “integration” orientation may not always yield the best adaptation outcomes.
One reason for this equivocal pattern of effects could be that researchers may have underestimated the social chal-lenges posed by the adoption of an “integrationist” orienta-tion. People who hold this orientation have to deal with demands from their own heritage culture and the culture of the receiving society, and sometimes these may conflict. For instance, minority group people endorsing an “integration-ist” position may have to contend with “assimilation“integration-ist” expectations and values from the majority (Phinney, Horenczyk, Liebkind, & Vedder, 2001). This may be espe-cially true for children who have to adapt to their social world quickly as they navigate new environments at school. Even if the long-term consequences of “integration” are broadly positive, in the short term, “integrationist” individu-als may individu-also experience some negative outcomes.
The measuring instruments associated with Berry’s framework have also come under scrutiny. The main mea-sure of acculturation attitude has many double-barrelled items (e.g., “I feel that [ethnic group] should maintain their own cultural traditions and not adapt to those of [nationals];” Berry et al., 2006, p. 260). In psychometric terms, such double-barrelled items are usually to be avoided because the part with which a respondent is agreeing or disagreeing can-not be unambiguously determined (Ward & Rana-Deuba, 1999). Many investigators now use simpler items designed to tap the dimensions of CM and DC separately (Arends-Toth & van de Vijver, 2007; Ryder, Alden, & Paulhus, 2000). In this research, we follow this approach, using measures specially devised for use with younger participants.
Three other limitations of traditional acculturation research should be noted. The first has been a reliance on
adult and adolescent samples (e.g., Berry et al., 2006; Fuligni, Kiang, Witkow, & Baldelomar, 2008; Phinney, Cantu, & Kurtz, 1997). Thus, the generalizability of these findings to younger age groups remains an open question. Developmental research has shown that social categories (e.g., ethnicity, gender) are meaningful for young children (e.g., Levy & Killen, 2008) and the acquisition of a social identity is a pri-mary goal of social development, with children from a young age incorporating category memberships into their identities (Ruble et al., 2004). Therefore, it is likely that young chil-dren also must negotiate the twin challenges of whether (or not) to maintain their heritage culture and whether (or not) to seek contact with members of other groups. However, accul-turation research with young children is scarce (for excep-tions, see Nigbur et al., 2008; Rutland et al., 2012; van de Vijver, Helms-Lorenz, & Feltzer, 1999).
The limited number of studies that have considered the acculturation attitudes of children and adolescents suggest they favor an “integrationist” acculturation orientation. For example, van de Vijver and colleagues (1999) examined acculturation attitudes in a sample of 7- to 12-year-old Dutch immigrant children (mean age 10 years) and found that gration” was the preferred strategy. The adoption of an “inte-grationist” acculturation attitude, however, involves an attachment to more than one social group. Previous findings indicate that, before approximately 8 years of age, children are unlikely to incorporate multiple social category member-ships into their emerging self-concept (Ruble et al., 2004). From about 8 years, children begin to be exposed to a wider array of social groups (especially in school) and thus start to understand the complexity of group and intergroup dynamics (Killen & Rutland, 2011; Rutland, Killen, & Abrams, 2010). It is through these experiences and the development of this group understanding that children are likely to acquire mul-tiple social identities (e.g., Asian-British). There is also an important social-cognitive shift in children’s thinking from this age, with a transition from judgments-based primarily on only one characteristic (e.g., skin color) to ones formulated using several categories (e.g., nationality, school, classroom; Barenboim, 1981). Therefore, we expected our oldest age group (8-11 years) to show the strongest preference for an “integrationist” orientation.
A second limitation has been an overreliance on self-report data. Of course, to elicit children’s or adolescents’ acculturation orientations, the use of subjectively assessed attitudes is entirely appropriate. However, if the outcomes of acculturation (e.g., indicators of well-being) are also exclu-sively assessed in the same way, the possibility of a social desirability confound exists. It is conceivable that observed associations between acculturation attitudes and psychoso-cial outcomes may be partly attributable to the common vari-ance that they share with self-presentational motives (Rudmin & Ahmadzadeh, 2001). For instance, young chil-dren in Western countries (under study here) may well be inclined to report relatively high levels of self-esteem. And,
given a cultural emphasis on multiculturalism (as would be the case in the present context, the United Kingdom: accord-ing to the Queen’s University Multiculturalism Index [http:// www.queensu.ca/mcp/index.html], in 2010 the United Kingdom ranked 5th out of 21 Western nations in its policies in relation to immigrant minorities), they may also be dis-posed to favor relatively high levels of DC and CM, thus potentially introducing a “common variable” explanation for any observed associations between acculturation attitudes and well-being. It would seem prudent, therefore, to include at least some outcome variables that emanate from a differ-ent source than the responddiffer-ents themselves.
The third, and potentially most serious, limitation has been the almost exclusive use of cross-sectional designs in the acculturation literature. Despite Berry’s (2006) and Fuligni’s (2001) advocacy of longitudinal designs, they have not often been adopted by acculturation researchers. Where they have been used, such designs have typically been used to track how immigrants’ acculturation attitudes or accultur-ative outcomes change over time (e.g., Portes & Rumbaut, 2005; Zheng & Berry, 1991), which is obviously useful for documenting the temporal dynamics of acculturation. However, to test Berry’s central hypothesis, some form of longitudinal analysis is needed. Although such time-lagged effects are by no means proof of causality, they provide a little more support for causal inferences than can be obtained from purely cross-sectional designs (Bijleveld & van der Kamp, 1998). Such tests of Berry’s hypothesis are scarce.
Some longitudinal studies have examined the longitudinal effects of host language competence (a proxy for culture adoption) on psychosocial outcomes. Jasinskaja-Lahti (2008) found that, among Russian immigrants to Finland, Finnish language competence predicted psychological adaptation 8 years later, while controlling for initial adaptation. In con-trast, Beiser and Hou (2001), in their 10-year cohort study of Asian refugees in Canada, found no longitudinal relationship between initial English language competence and subse-quent depressive symptoms. CM was not measured in these studies, and so the longitudinal prognosis of an “integration” orientation cannot be established. With an older sample (mean age 13 years) of immigrants to Norway, Oppedal, Røysamb, and Sam (2004) found that host culture compe-tence (a proxy for DC) and ethnic culture compecompe-tence (a proxy for CM) were independently related to self-esteem over time. A test of the longitudinal correlates of “integra-tion” as a strategy was not made in this study. In the study reported here, we remedy this lacuna in the acculturation lit-erature with a three-wave panel design lasting 1 year.
The Present Study
We designed a longitudinal study of young ethnic minority children’s acculturation attitudes and adaptation outcomes. The acculturation measures were bidimensional and purpose-designed to be appropriate for the age groups under study
(5-11 years). The adaptation measures were a mixture of self-report measures of well-being (e.g., social competence and peer acceptance) and teacher ratings of emotional symptoms.
The research was conducted with a sample of children with a South Asian background who were attending primary schools in the South of England. Children in the United Kingdom with South Asian heritage are mostly at least
sec-ond generation immigrants.1 In the region where the study
was carried out, the South Asian community is the largest ethnic minority accounting for about 2.7% of the regional population (Large & Ghosh, 2006).
Our study addressed the following questions:
1. To what extent do older and younger British Asian children in this study favor “integrationist” accultura-tion attitudes?
2. How do these children’s adaptation outcomes change over the time course of the study (1 year)? Do chil-dren with different acculturation strategies have divergent or similar temporal trajectories of adaptation?
Method
Participants
Two-hundred and fifteen children (F = 110, M = 105) aged between 5 and 11 years (M = 95.8 months) with a South Asian background participated. Of these, the majority (172 or 80%) were second- or later-generation immigrants to Britain; a smaller number (43 or 20%) were first-generation immigrants (i.e., had been born outside the United Kingdom). Consistent with regional demographics, the majority of the children had an Indian background (79%), with the remain-der reporting Pakistani (7%), Bangladeshi (4%), Sri Lankan (4%), and other (6%) backgrounds. Children were recruited from 20 primary schools in southern England. The ethnic composition of these schools varied from 2% to 62% minor-ity pupils (median = 20%). With the cooperation of school authorities, children with a South Asian background were identified as potential participants. The parents or guardians of these children were then contacted with information about the study and with a request for consent for participation. Assent was also sought from each child.
Design
The study had a three-wave longitudinal design with 6-month intervals between data collections. In any longitudinal study, one requires time-lags that are sufficiently long to have a rea-sonable chance of detecting the change processes of interest. We judged that with this age group, developmental processes were likely to be sufficiently rapid to be sensitive to our cho-sen 6-monthly intervals (Ruble et al., 2004).
Brown et al. 1659
Procedure
Data were collected in structured individual interviews that lasted around 20 min and were introduced to the children as questions about what they thought about themselves and oth-ers. The order of presentation of measures was counterbal-anced. The questions, many of which contained pictorial scales, were visible to the children throughout and were read out by the interviewer to ensure comprehension. There were five interviewers (four female, one male), four White and one (female) with mixed Finnish-Bangladeshi background. Participants were assured of confidentiality and anonymity and were debriefed in a manner appropriate to their age and understanding. Teacher ratings of the children’s behavior were elicited separately. Teachers were unaware of the chil-dren’s responses when providing their ratings.
Measures
In view of the paucity of previous acculturation research with young children, several measures were developed spe-cifically for the study. Others were adaptations of existing measures.
Acculturation attitudes. Responses were recorded on 5-point scales (not at all, a little bit, in the middle, quite a bit, a lot) visualized as images of balloons of increasing size. To facilitate comprehension and involvement, children were shown colorful cartoon-style collages of brown-skinned and white-skinned children to represent their ingroup and outgroup, respectively. Following the lead provided by ear-lier researchers, we phrased the acculturation questions in
terms of what the children felt they should be doing2
(Arends-Toth & van de Vijver, 2003; Berry & Sabatier, 2010; Bourhis, Barrette, El-Geledi, & Schmidt, 2009; Zagefka & Brown, 2002). Information on the development of these measures, face validity, and reliability can be found in Nigbur et al. (2008).
CM. Five items asked the children whether people in their ingroup should learn the language of their heritage culture, wear culturally traditional clothing, eat culturally traditional foods, celebrate their own culture’s holidays, and listen to traditional music. This measure had adequate internal reli-ability at each of the three waves of data collection: Cron-bach’s alphas: (t1) = .76; (t2) = .71; (t3) = .78. Test–retest stabilities were as follows: t1 − t2 = .42, t2 − t3 = .41, t1 − t3 = .26, all p < .001.
DC. These items enquired whether people in their ingroup should be friends with White English people, eat lunch with White English children, and play together with White Eng-lish children. This measure also had adequate internal reli-ability: alphas (t1) = .74, (t2) = .76, (t3) = .83. Stabilities: t1 − t2 = .35, t2 − t3 = .52, t1 − t3 = .29, all p < .001.
Peer acceptance. An abbreviated version of Cassidy and Asher’s (1992) scale was used as a self-report measure of perceived peer acceptance in our study. Participants’ responses to 10 items—those with the highest item-total correlations in Cassidy and Asher (1992)—were recorded on similar balloon scales, except that there were four scale points: not at all, a little bit, quite, and very (1-4) (e.g., “Is it hard to get kids in school to like you?” and “Do you have lots of friends in school?” with half the items reverse-scaled). Reliabilities were adequate: (t1) = .77, (t2) = .82, (t3) = .85. Stabilities: t1 − t2 = .60, t2 − t3 = .64, t1 − t3 = .45, all p < .001.
Social competence. Social competence was assessed by the Social Competence subscale of Harter’s (1982) Perceived Competence scale (6 items). Items were presented as two opposing statements (e.g., “Some kids are always doing things with a lot of kids” but “Other kids usually do things by themselves”). Children were invited to choose which of these statements was true of themselves, and then indicate whether it was a little bit true (by ticking a small box next to the statement) or very true of them (by ticking a large box). Half of all items were reverse scaled (range = 1-4). Internal reliability of this scale was somewhat weaker than for the other measures: (t1) = .47, (t2) = .63, (t3) = .69. Stabilities: t1 − t2 = .31, t2 − t3 = .53, t1 − t3 = .35, all p <.001.
Teacher ratings of negative emotional symptoms. A subscale from Goodman’s (1999) Strengths and Difficulties Question-naire (SDQ) was used by teachers to assess the children’s emotional symptoms (5 items; e.g., “many fears, easily scared”). Alongside each symptom, there was a three-cate-gory response format: not at all true, somewhat true, and certainly true (range = 1-3). Reliabilities were adequate: (t1) = .78, (t2) = .81, (t3) = .70. Stabilities: t1 − t2 = .56 (p < .001), t2 − t3 = .25 (p < .05), t1 − t3 = .32 (p < .001).
Results
We present the results in three sections. In the first, we describe the children’s acculturation attitudes as a function of age and the time course of the study. This is the principal section where we report age effects because, in the analyses presented in the subsequent sections, age effects were mostly either nonsignificant or inconsistent. In the second section, we chart how the children’s adaptation outcomes change over time as a function of acculturation attitudes. In the third section, we investigate the longitudinal correla-tions between acculturation attitudes and on index of (mal) adaptation.
Preliminary analysis of school level intraclass correla-tions indicated no reliable school-level effects on any of our measures (all rs < .06), thus justifying the individual-level analyses adopted here.
Acculturation Attitudes
We first show how children’s acculturation attitudes varied as a function of age. For descriptive purposes and for ease of presentation only, the sample was split into two approxi-mately equal-sized age groups: younger (5-7 years old at Wave 1; n = 108, M =80.74 months, SD = 9.70) and older (8-11 years; n = 107, M =111.00, SD = 10.07). A mid-scale point split strategy was adopted on their acculturation scores to produce the four Berry strategies (e.g., for “integration,” CM and DC > 3; see Table 1). A chi-square test of indepen-dence revealed that age group and acculturation strategies
were significantly related, χ2(3) = 14.71, p = .002. As can be
seen, older children were more likely to endorse an “integra-tion” attitude than the younger children (86% vs. 68.5%), and the younger children were more in favor of “separation” than their older peers (18.5% vs. 2.8%). A multinomial logistic regression analysis with acculturation strategies as the depen-dent variable and age group as the independepen-dent variable con-firmed that the odds of older students’ adopting an integration strategy (vs. a separation strategy) were 8.3 times higher than that of younger students (B = 2.115, SE = .63, p = .001).
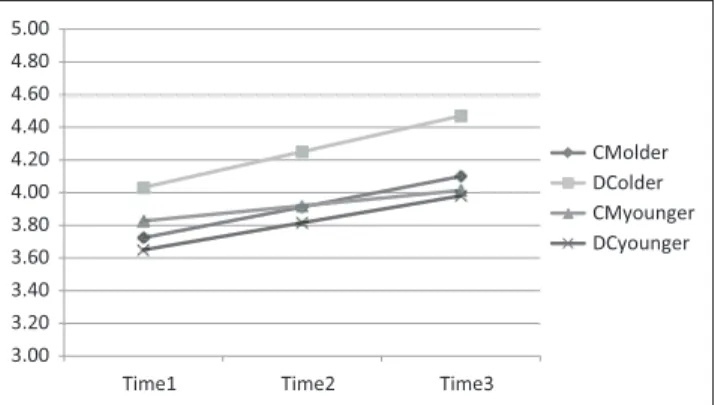
To examine the temporal changes in the children’s accul-turation attitudes without dichotomizing the sample by age, we conducted univariate growth curve analyses for CM and DC, using Mplus 5.21 (Muthén & Muthén, 2009). Such a technique allows one to analyze individual trajectories and related processes of change over time through a determina-tion of the average initial level of each construct (intercept) and average changes in each construct over time (slope). The models showed an acceptable level of fit (Table 3). The average initial CM was 3.78 and the mean change was an increase of 0.14 per wave, both significant. For DC, the ini-tial level was 3.84 and the mean change was an increase of 0.19 per wave, both significant. For CM and DC, the vari-ances of the intercepts were significant, revealing signifi-cant variability for the initial levels. The variance of the slope of DC was also significant suggesting variability in the change rate of DC.
We then examined the effects of age on the initial levels and slopes of CM and DC. This model showed an acceptable
level of fit, χ2(9) = 29.52, p = .002; comparative fit index
(CFI) = .91; root mean square error of approximation (RMSEA) = .09. Age only had an effect on the initial level of
DC (B = 0.13, SE = 0.05, p = .005, R2 =.07), suggesting that
older children had more desire for contact. To plot the tem-poral trajectories of CM and DC for children with different ages, slopes and intercepts were calculated at +1/−1 SD of age as a centered continuous variable (M = 7.5, SD = 1.5; see Figure 1). As can be seen, all children showed an increase along acculturation dimensions over the duration of the study, and the most noticeable age difference is on DC, as
just noted.3
Even though there was a relatively small number of first-generation children (n = 43), including first-generational status in the above analyses revealed no significant main or interac-tion effects due to it.
Temporal Changes in Adaptation
First, we established whether attrition could have materially affected the results. Complete data (i.e., from all three waves) were obtained from 184 children (14.42% attrition). The group with matched data at all three time points was com-pared with the group for which there were incomplete data at two or more time points. A one-way MANOVA was con-ducted on all six measures at Wave 1, comparing the full matched sample (n = 184), with the “attrition” sample, that is, those children who were not present at one or more time points (n = 31). Results revealed that there was no overall MANOVA effect, F(5, 180) = 0.85, ns, nor were any of the univariate effects significant (all Fs < 0.60, ns). We can con-clude that the matched sample was not affected by partici-pant attrition.
Table 2 presents the intercorrelations among the six mea-sures within and across time points. To investigate whether and how ethnic minority children’s adaptation outcomes changed over time on average, we again used latent growth curve modeling. Univariate growth curve analyses were specified for the three constructs: social competence, peer acceptance, and emotional symptoms. The latent growth model was tested by setting the factor loadings of the inter-cept to 1 and the factor loadings of the slope to 0, 1, and 2 across the three waves to reflect a linear change.
Table 1. Acculturation Attitudes as a Function of Age.
Younger
(5-7 years) (8-11 years)Older Overall
Marginalization 3 (2.8%) 3 (2.8%) 6 (2.8%) Assimilation 11 (10.2%) 9 (8.4%) 20 (9.3%) Separation 20 (18.5%) 3 (2.8%) 23 (10.7%) Integration 74 (68.5%) 92 (86.0%) 166 (77.2%) 3.00 3.20 3.40 3.60 3.80 4.00 4.20 4.40 4.60 4.80 5.00
Time1 Time2 Time3
CMolder DColder CMyounger DCyounger
Figure 1. Temporal trajectories of acculturation attitudes of
1661
Table 2.
Descriptive Statistics and Bivariate Correlations.
Time 1 (T1) Time 2 (T2) Time 3 (T3) 1 2 3 4 5 1 2 3 4 5 1 2 3 4 5 Age T1 culture maintenance 1.00 .200* .040 .041 −.014 .419** −.021 −.003 .114 .148 .258** .134 .08 .031 −.126 .046 T1 contact 1.00 .146* .021 .081 .073 .354** .056 .113 .087 .220** .294** .066 .063 −.065 −.106 T1 peer acceptance 1.00 .501* −.091 .114 .169* .595** .475** −.192* .090 .228** .447** .459** −.239** −.094 T1 social competence 1.00 −.144* −.025 .030 .413** .391** −.124 −.036 .034 .338** .347** −.198* −.008 T1 emotional symptoms 1.00 −.017 .002 −.097 −.058 .555** −.012 .179* −.149 −.100 .318** −.036 T2 culture maintenance 1.00 .065 .097 .033 −.031 .405** .239** .167* .117 −.026 .010 T2 contact 1.00 .101 .154* .094 .074 .523** .171* .267** −.157 −.265** T2 peer acceptance 1.00 .545** −.210* .022 .222** .636** .553** −.312** −.119 T2 social competence 1.00 −.012 .096 .235** .497** .531** −.172* −.164* T2 emotional symptoms 1.00 .037 .172 −.181 −.174 .254* −.047 T3 culture maintenance 1.00 .239** .150* .172* .072 .054 T3 contact 1.00 .209** .266** −.074 −.168* T3 peer acceptance 1.00 .687** −.159 −.137 T3 social competence 1.00 −.270** −.186** T3 emotional symptoms 1.00 .062
Age (younger vs. older)
1.00 M 3.717 3.860 3.222 2.830 1.282 3.998 4.000 3.335 2.912 1.257 3.995 4.218 3.339 2.887 1.256 0.502 SD 0.984 1.060 0.535 0.616 0.377 0.813 1.035 0.521 0.681 0.397 0.897 0.941 0.543 0.709 0.335 0.501 n 214 214 213 214 188 200 200 200 200 106 194 194 195 195 141 215 *p < .05. ** p < .01.
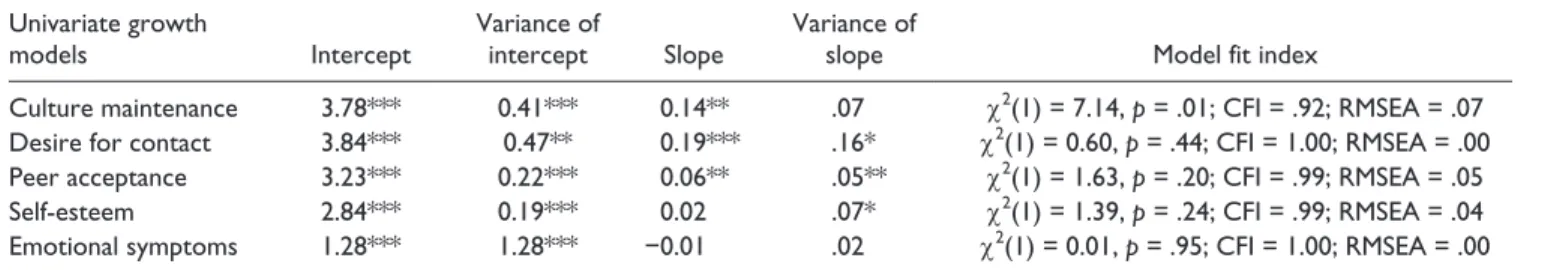
The models for all three constructs showed an acceptable level of fit (Table 3). The average initial peer acceptance was 3.23 and the mean change was an increase of 0.06 per wave, both significant. The variances of the intercept and the slope were also significant, revealing significant variability for the initial level and change rate of peer acceptance. In other words, children felt quite or very accepted by their peers ini-tially and their feelings of peer acceptance increased in a year. Yet, this change significantly varied for different children. For social competence, the initial level was 2.84. Although its slope was not significant, the variability of the change rate was significant, suggesting that for some children social com-petence might be increasing while for some others it might be decreasing, resulting in a nonsignificant average change rate. For emotional symptoms, only the intercept and its variance were significant, suggesting variability at the initial level of emotional problems children experienced, as reported by teachers at Wave 1. However, as neither change rate nor the variance of the change rate was significant, this construct was not suitable for growth analysis.
Do children with different acculturation strategies have divergent temporal trajectories of adaptation outcomes? To answer this question, we first investigated the main and interactive effects of CM and DC at Wave 1 on the intercepts and the slopes of two adaptation outcomes separately (peer
acceptance and social competence).4 CM and DC variables
were centered (M = 3.72 and M = 3.86, respectively) for ease of interpretation of the interaction effects. Different accul-turation strategies were then specified based on the signifi-cant interaction between CM and DC. Finally, we graphed the temporal trajectories of adaptation outcomes for children with different acculturation strategies.
The first model examined the extent to which main and interactive effects of CM and DC at Wave 1 were associated with the initial level of peer acceptance and its increase over
time. This model showed a good fit, χ2(4) = 5.94, p = .20;
CFI = .99; RMSEA = .05. While DC had a marginally sig-nificant positive effect on the initial level of peer acceptance (B = 0.07, SE = 0.03, p = .056), the expected interaction between CM and DC was significant on the slope (B = 0.04, SE = 0.02, p = .006), suggesting that those children with an “integration” strategy showed an increase of peer acceptance
over time. The predictors explained 3% of the variance in the intercept and 7% of the variance in the slope. To plot the temporal trajectories of peer acceptance for children with different acculturation strategies, slopes and intercepts were calculated at +1/−1 SD of both acculturation attitudes (Figure 2). While there was a significant increase in peer acceptance for children with an integration strategy (+1 SD on both acculturation attitudes) (B = 0.11, SE = 0.04, p = .003) and also for those with a “marginalization” strategy (B = 0.08, SE = 0.03, p < .011), slopes were not significant for
those with assimilation and separation strategies.5
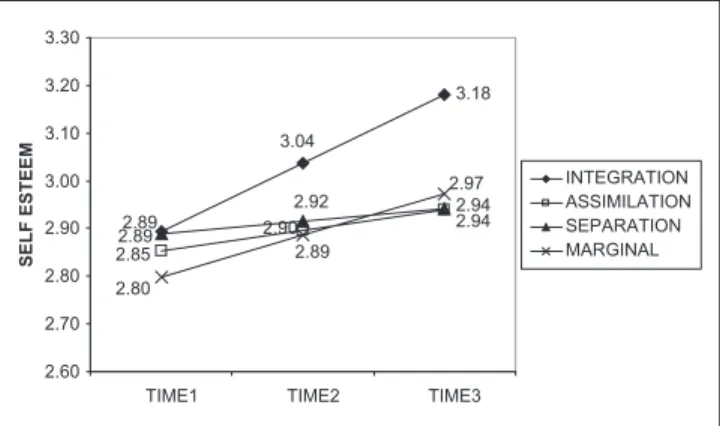
The second model similarly examined the main and inter-active effects of CM and DC at Wave 1, this time on the intercept and the slope of social competence. While the
model fit was adequate, χ2(5) = 4.97, p = .42; CFI = 1.00;
RMSEA = .00, the interaction of acculturation attitudes did not quite reach significance (B = 0.04, SE = 0.02, p = .075). However, further examination of the slopes for those with different acculturation strategies indicated that the slope for an integrationist strategy was significant. In other words, those with an “integration” strategy had significantly increas-ing competence over time (B = 0.15, SE = 0.06, p = .014; Figure 3). None of the other slopes was significant. As none of the predictors was significant on the intercept, they did not explain any variance of the intercept (1%). The predictors explained 10% of the variance in the slope factor.
3.26 3.37 3.47 3.35 3.31 3.27 3.19 3.24 3.29 3.15 3.23 3.31 2.90 3.00 3.10 3.20 3.30 3.40 3.50
TIME1 TIME2 TIME3
PEER ACCEPTANCE
INTEGRATION ASSIMILATION SEPARATION MARGINAL
Figure 2. Temporal trajectories of peer acceptance for children
with different acculturation strategies.
Table 3. Univariate Growth Curve Models.
Univariate growth
models Intercept Variance of intercept Slope Variance of slope Model fit index
Culture maintenance 3.78*** 0.41*** 0.14** .07 χ2(1) = 7.14, p = .01; CFI = .92; RMSEA = .07
Desire for contact 3.84*** 0.47** 0.19*** .16* χ2(1) = 0.60, p = .44; CFI = 1.00; RMSEA = .00
Peer acceptance 3.23*** 0.22*** 0.06** .05** χ2(1) = 1.63, p = .20; CFI = .99; RMSEA = .05
Self-esteem 2.84*** 0.19*** 0.02 .07* χ2(1) = 1.39, p = .24; CFI = .99; RMSEA = .04
Emotional symptoms 1.28*** 1.28*** −0.01 .02 χ2(1) = 0.01, p = .95; CFI = 1.00; RMSEA = .00
Note. CFI = comparative fit index; RMSEA = root mean square error of approximation.
Brown et al. 1663
In sum, ethnic minority children felt increasingly accepted by their peers over the study period. However, children with different acculturation strategies varied in the extent to which their feelings of peer acceptance and social competence changed throughout the year. In particular, children with an integration strategy had increasing peer acceptance and social competence.
Additional Analysis on Emotional Problems
Latent growth curve analysis showed that neither the slope of the emotional problems measure nor its variance was signifi-cant. That is, there was no gradual increase/decrease of emo-tional problems over time. Hence, we did not continue to test the interaction of CM and DC using growth curve analysis. However, it was still possible that the interaction of CM and DC at Time 1 might have a significant effect on emotional problems at Time 2 (controlling for emotional problems at Time 1) or that the interaction of CM and DC at Time 2 might have a significant effect on emotional problems at Time 3 (controlling for emotional problems at Time 2). To test these assumptions, we conducted two separate simple regression analyses.
First, the effects of CM and the interaction of CM and DC at Time 1 were significant on emotional problems at Time 2 (B = 0.13, SE = 0.04, p = .002; B = 0.06, SE = 0.03, p = .019, respectively) controlling for emotional problems at Time 1
(B = 0.63, SE = 0.09, p < .001), F(4, 93) = 14.23, p < .001, η2
= .39. For those high on DC, higher CM was associated with higher emotions problems at Time 2 (B = 0.19, SE = 0.05, p = .001). This suggests that those with an “integration” strat-egy at Time 1 had more emotional problems at Time 2. For those low on DC, simple slope was not significant, B = 0.06, SE = 0.05, p = .25. Second, neither the main effects nor the interaction effect of CM and DC at Time 2 were significant on emotional problems at Time 3, controlling for emotional problems at Time 2 (B = 0.32, SE = 0.13, p = .012), F(4, 66) =
2.27, p = .07, η2 = .13.
Discussion
In this article, we have documented the acculturation atti-tudes of a sample of young British Asian children and shown that these, like those of their older counterparts in Britain and elsewhere, are broadly “integrationist” in character. As expected, this preference for integration was slightly more pronounced in the older children (8-11 years) than in the younger children (5-7 years). Moreover, different accultura-tion attitudes are associated with different patterns of change in psychosocial outcomes over the course of a year. Those holding “integrationist” attitudes showed the steepest (and significant) temporal increases in social competence and peer acceptance, while those holding other attitudes changed much less (and not significantly). Finally, we have provided preliminary evidence that those holding “integrationist” atti-tudes had increasing emotional problems at a later time point, controlling for prior individual differences in emotional problems.
In discussing these findings, one main issue worthy of consideration concerns the reliable longitudinal associations we observed between an “integrationist” attitude and our three psychosocial outcomes, social competence, peer acceptance, and negative emotional symptoms. In two cases (social competence and peer acceptance), the findings pro-vide support for Berry’s (1997) prediction that an accultura-tion attitude that combines CM and DC will have the most favorable prognosis for well-being. This support is all the more convincing for having been obtained from a longitudi-nal design. The paucity of longitudilongitudi-nal research in the accul-turation literature generally, and the even greater scarcity of longitudinal research with young children, lend these find-ings particular significance.
However, one finding from the third measure, negative emotional symptoms, strikes a note of caution against too readily reaching the conclusion that “integrationist” attitudes will always have benign outcomes. Here we found that an “integrationist” outlook at one time point was correlated with a greater number of emotional symptoms (“clingy,” “easily scared”) as recorded by the children’s teachers 6 months later. In other words, endorsing “integration” was found by the children in our study to be something of a two-edged sword: It was associated with enhanced social compe-tence and acceptance by their peers while it also was related to more negative emotional symptoms. We believe that these apparently contradictory findings can be understood by reflecting on the social challenges confronting children who are seeking to “integrate” (in the Berry sense). As they are scoring relatively highly on both acculturation dimensions, they are presumably actively engaged in seeking out interac-tion opportunities with majority children while simultane-ously retaining aspects of their own group’s cultural heritage, perhaps in their clothing or dietary preferences. The fact that they may be taking the lead in initiating intergroup exchanges may ironically also expose them to more instances of name 3.18 3.04 2.89 2.94 2.90 2.85 2.94 2.89 2.92 2.80 2.89 2.97 2.60 2.70 2.80 2.90 3.00 3.10 3.20 3.30
TIME1 TIME2 TIME3
SELF ESTEEM
INTEGRATION ASSIMILATION SEPARATION MARGINAL
Figure 3. Temporal trajectories of social competence for
calling or social rejection, particularly if their culturally pre-scribed appearance or behavior is likely to give rise to com-ment from other children. In other words, the same orientation that enhances children’s feelings of competence and accep-tance also has the potential to generate negative outcomes.
A further possible explanation of that apparently anoma-lous finding could be a lack of social support (either from teachers, adults or schools generally). Children with an “integration” acculturation orientation may feel they lack social support for their preferred strategy within their school environment, and this might mediate the relationship between integration and emotional symptoms (i.e., social anxiety). It is well established in the acculturation and clinical develop-mental literature that a lack of social support is related to higher social anxiety (e.g., Atzaba-Poria & Pike, 2005). This possible mediation effect does not discount the findings that an “integration” orientation was related to higher perceived social self-esteem (competence) among peers and peer acceptance. “Integration” could still be related to more per-ceived acceptance in the peer group over time, even though children adopting this orientation may perceive less social support for their approach from adults. This lack of social support among integration children may be the key driver behind why for this group we find more social anxiety (as reported by teachers). These children’s anxiety as reported by teachers may reflect their desire to obtain social approval for their “integration” approach. This is a possibility that future studies should look into.
To these speculations, we would add the following remarks. First, our findings were obtained with relatively young children for whom the challenges in adopting an “integrationist” outlook may be particularly keenly felt because of the many cognitive and social adaptation experi-ences they are undergoing. It will be an interesting empirical question to discover whether similar ambivalent outcomes of “integration” can be observed with adolescents and adults also (for converging evidence, see Baysu, Phalet, & Brown, 2011).
Second, it is strength and a limitation that the “contrary” finding was observed on the more “objective” measure derived from the teachers’ ratings of the children. The main advantage of this measure is that, unlike the others, it was not self-reported by the children. Hence, it would have been less susceptible to any contamination by social desirability and other sources of common method variance, always a potential problem in studies relying wholly on subjective measures, as the teachers were unaware of the children’s responses in the interviews. However, at the same time, we recognize that it is not a purely objective measure. There is a possibility, though we believe a faint one, that the teach-ers’ ratings of the children may have been influenced by their own preconceptions about various acculturation strate-gies. If teachers were able to discern the children’s accul-turation attitudes from observing them in the class-room or playground, it is conceivable that their ratings may reflect
their expectations about the likely consequences of such attitudes rather than the children’s actual behavioral symp-toms. We simply have no way of knowing how far this was the case. But the facts that the children’s attitudes were elic-ited privately on our novel and purpose-designed measures, and that the teachers were “blind” as to their scores on those, gives us some confidence that the influence of teachers’ ste-reotypic expectancies on their SDQ ratings was likely to have been small.
Third, we acknowledge that the measure of peer accep-tance, adapted from Cassidy and Asher (1992), is ambiguous as to which peers are perceived as being accepting (or not). It does not specify the ethnicity of those peers, in other words. In an acculturation context, that ambiguity is unfortunate because it might be that the minority group children in our sample were referring only to own (or other) group peers. Clearly, the implications of each of those referents are differ-ent: one implies an own group orientation; the other implies some success in intergroup contact. However, reassuringly, in some related work, we have found that results for the peer acceptance measure were very similar to those for a measure of cross-ethnic friendships (Rutland et al., 2012). Nevertheless, future research with this measure will want to specify who the peers are more clearly.
There is also a possibility that the children’s own self-reports may reflect some kind of dissonance reducing bias. That is, those children who made an effort to integrate may also have convinced themselves that their peers accept them
and that they are therefore high in social competence.6
Ultimately, however, it has to be acknowledged that because the divergent results were obtained from different sources and with different kinds of measures, it is not possible to be definitive about the true source of the disparate findings. With hindsight, it would have been sensible to obtain teach-ers’ ratings also of their perceptions of the children’s accul-turation attitudes and adaptation outcomes, despite the practical challenges of doing so. In that way, at least some of the method confounds might have been untangled. Future research should undoubtedly bear this consideration in mind.
With regard to future research, we can see some promising extensions of the line of work that we have opened up here. The first immediate priority should be to extend the time period of future longitudinal studies of acculturation so we can ascertain how long the ambivalent effects of “integration” last. Our hunch is that any negative consequences are likely to be relatively short-lived. If our speculation is correct about the likely origins of the emotional symptoms displayed by the “integrationist” children, then we suspect that the benefits of “integration”—enhanced social competence, greater social acceptance—will eventually outweigh the costs. It will also be important to instigate further longitudinal research into the effects of acculturation attitudes. As we noted earlier, there is a surprising paucity of longitudinal tests of Berry’s frame-work. Interesting future directions for that longitudinal work would be to investigate possible generational differences in
Brown et al. 1665 acculturation processes in children. Unfortunately, we were
able to obtain only a relatively small sample of first-genera-tion immigrants, but it is possible that they respond differ-ently to the acculturation challenges of the school environment than their second- (and later-) generation peers. Third, future studies might also include assessments of parents in addition to those of teachers as parents may be especially relevant for younger children’s acculturation strategies and adaptation outcomes. Finally, it is worth noting that children’s accultura-tion attitudes at these ages seem to be quite labile. The auto-correlations of CM and DC ranged from .26 to .52 (Table 2), and were, unsurprisingly, lowest over the longest 12-month time gap. This suggests that there will be some important future work to understand the factors that influence them, par-ticularly in a more “integrationist” direction. One promising possibility is educational interventions. Turner and Brown (2008) report a small-scale evaluation of majority children’s acculturation attitudes (toward refugees) after a curriculum innovation designed to promote a more multicultural outlook. Despite the brevity of the intervention (4 weeks), those in the “Experimental” group showed positive change in their “inte-grationist” attitudes compared with those in the “Control” group.
In conclusion, the majority of the ethnic minority children in our study favored an “integrationist” orientation, suggest-ing that they felt comfortable engagsuggest-ing with the majority cul-ture while simultaneously maintaining their own cultural heritage. The psychosocial effects of doing so, as we have seen, are favorable and unfavorable. Thus, the challenge for parents, teachers, and community leaders alike will be to find ways of promoting the former outcomes and overcoming the latter. Quite how that can be achieved is beyond the scope of this article but, at the very least, such measures will have to proceed by recognizing its main conclusion: that integration offers challenges as well as advantages for young ethnic minority children.
Acknowledgments
We gratefully acknowledge the assistance of the several schools and the many children who agreed to take part in the study.
Authors’ Note
Charles Watters is now at Sussex University, Brighton, UK.
Declaration of Conflicting Interests
The author(s) declared no potential conflicts of interest with respect to the research, authorship, and/or publication of this article.
Funding
The author(s) disclosed receipt of the following financial support for the research, authorship, and/or publication of this article: This research was funded by a grant awarded to the first, fifth, and sixth authors by the Economic and Social Research Council, UK (RES-148-25-0007).
Notes
1. A note on terminology: In Europe it is not uncommon to refer to people with an immigrant background, even those of 2nd or later generation, as “immigrants.” However, to avoid confu-sion, we have generally referred to the participants in our study as ethnic minority children. Nevertheless, it is still appropriate to study such groups within the framework of acculturation theory, especially given the latter’s origin in the classic defini-tion by Redfield, Linton, and Herskovitz (1936, p. 149), from which most contemporary acculturation perspectives stem (Brown & Zagefka, 2011): “Acculturation comprehends those phenomena which result when groups of individuals having different cultures come into continuous first-hand contact, with subsequent changes in the original cultural patterns of either or both groups.”
2. In fact, a wide variety of phrasings have traditionally been used to measure acculturation attitudes. In addition to, “Do you think [ingroup members] should . . . ” (used here and else-where), researchers have also used, “It is important that . . . ” (Berry & Sabatier, 2010; Ward & Kus, 2012), “I prefer to . . . ” (Berry, Phinney, Sam, & Vedder, 2006), “I believe in . . . ” or “I am interested in . . . ” (Ryder, Alden, & Paulhus, 2000), and often more than one variant in the same study. Given the young age of our participants, we felt it important to main-tain a consistent usage throughout. Of course, whether they actually follow these attitudinal inclinations in their behavior is another question altogether. But acculturation research has predominantly focused on the people’s attitudes or preferences rather than their practices. Besides, we believe these attitudi-nal measures are particularly relevant for the age groups under study whose actual practices might be constrained by parents. 3. For readers unfamiliar with this form of statistical analysis, it
is worth noting that a 2 × (3 × 2) mixed analysis of variance (ANOVA): Age (Older vs. Younger) × [Time (t1 vs. t2 vs. t3) × Attitude (CM vs. DC)], with repeated measures on the last two factors, yielded two significant main effects and an interac-tion, corresponding to the results described here and shown in Figure 1. There were main effects for Time, F(2, 364) = 16.19,
p < .001, η2 = .082; Attitude, F(1, 182) = 4.16, p < .05, η2 =
.022; and an Age × Attitude interaction, F(1, 182) = 11.93, p <
.001, η2 = .062.
4. One could wonder whether the individual differences in change in the acculturation strategies (technically, slopes of CM and DC) are associated with individual differences in change in the adaptation outcomes (slopes of peer acceptance and self-esteem). We tested this alternative assumption for both adapta-tion outcomes. It is worth noting that such a model requires a specification of the interaction of two latent variables, and hence it might have convergence problems and it has no fit index like chi-square or RMSEA (Muthén & Muthén, 1998-2007). The results supported the simpler approach we adopted here so that the interaction of the intercepts of CM and DC (the initial levels at Time 1) was significant, while the slopes of CM and DC were not significant on the slopes of peer accep-tance and self-esteem.
5. It is worth noting that in this approach, CM (M = 3.72, SD = 0.98) and DC (M = 3.86, SD = 1.06) were centered around their means and the temporal trajectories were then calculated at −1SD/+1SD. This would be the same as testing the slopes
at 4.7 for the higher end and 2.7 for the lower end. As a result, those who were in the “Marginalization” group actually scored around the midpoint on CM and DC, suggesting that they were not really “marginalized,” in the Berry sense of the term. 6. We are grateful to a reviewer for alerting us to this possibility.
References
Arends-Toth, J., & van de Vijver, F. J. R. (2003). Multiculturalism and acculturation: Views of Dutch and Turkish-Dutch.
European Journal of Social Psychology, 33, 249-266.
Arends-Toth, J., & van de Vijver, F. J. R. (2007). Acculturation attitudes: A comparison of measurement methods. Journal of
Applied Social Psychology, 37, 1462-1488.
Atzaba-Poria, N., & Pike, A. (2005). Why do ethnic minority (Indian) children living in Britain display more internalizing problems than their English peers? The role of social sup-port and parental style as mediators. International Journal of
Behavioral Development, 29, 532-540.
Barenboim, C. (1981). The development of person perception in childhood adolescence: From behavioural comparisons to psychological constructs to psychological comparisons. Child
Development, 52, 129-144.
Baysu, G., Phalet, K., & Brown, R. (2011). Dual identity as a two edged sword: Identity threat and minority school performance.
Social Psychology Quarterly, 74, 121-143.
Beiser, M., & Hou, F. (2001). Language acquisition, unemploy-ment and depressive disorder among Southeast Asian refugees: A 10-year study. Social Science & Medicine, 53, 1321-1334. Berry, J. W. (1997). Immigration, acculturation, and adaptation.
Applied Psychology: An International Review, 46, 5-68.
Berry, J. W. (2006). Design of acculturation studies. In D. L. Sam & J. W. Berry (Eds.), The Cambridge handbook of acculturation
psychology (pp. 129-141). Cambridge, UK: CUP.
Berry, J. W., Phinney, J. S., Sam, D. L., & Vedder, P. (2006).
Immigrant youth in cultural transition: Acculturation, iden-tity and adaptation across national contexts. Mahwah, NJ:
Lawrence Erlbaum.
Berry, J. W., & Sabatier, C. (2010). Acculturation, discrimination, and adaptation among second generation immigrant youth in Montreal and Paris. International Journal of Intercultural
Relations, 34, 191-207.
Bijleveld, C. J. H., & van der Kamp, L. J. T. (1998). Longitudinal data
analysis: Designs, models and methods. London, England: SAGE.
Bourhis, R. Y., Barrette, G., El-Geledi, S., & Schmidt, R., Sr. (2009). Acculturation orientations and social relations between immigrant and host community members in California. Journal
of Cross-Cultural Psychology, 40, 443-467.
Brown, R., & Zagefka, H. (2011). The dynamics of acculturation: An intergroup perspective. Advances in Experimental Social
Psychology, 44, 129-184.
Cassidy, J., & Asher, S. R. (1992). Loneliness and peer relations in young children. Child Development, 63, 350-365.
Fuligni, A. J. (2001). A comparative longitudinal approach to accul-turation among children from immigrant families. Harvard
Educational Review, 71, 566-578.
Fuligni, A. J., Kiang, L., Witkow, M. R., & Baldelomar, O. (2008). Stability and change in Ethnic labeling among adolescents from Asian and Latin American families. Child Development,
79, 944-956.
Goodman, R. (1999). The extended version of the strengths and difficulties questionnaire as a guide to child psychiatric case-ness and consequent burden. Journal of Child Psychology and
Psychiatry, 40, 791-799.
Harter, S. (1982). The perceived competence scale for children.
Child Development, 53, 87-97.
Jasinskaja-Lahti, I. (2008). Long-term immigrant adaptation: Eight year follow-up study among immigrants from Russia and Estonia living in Finland. International Journal of Psychology,
43, 6-18.
Killen, M., & Rutland, A. (2011). Children and social exclusion:
Morality, prejudice and group identity. Oxford, UK: Blackwell.
Large, P., & Ghosh, K. (2006). Estimates of the population by eth-nic group for areas within England. Population Trends, 124, 8-17.
Levy, S., & Killen, M. (Eds.). (2008). Intergroup attitudes and
relations in childhood through adulthood. Oxford, UK: Oxford
University Press.
Muthén, B., & Muthén, L. (2009). Mplus (Software). Los Angeles, CA: Author.
Nguyen, A.-M. T. D., & Benet-Martinez, V. (2013). Biculturalism and adjustment: A meta-analysis. Journal of Cross-Cultural
Psychology, 44, 122-159.
Nigbur, D., Brown, R., Cameron, L., Hossain, R., Landau, A., LeTouze, D., & Watters, C. (2008). Acculturation, well-being and classroom behaviour among white British and British Asian primary-school children in the south-east of England: Validating a child-friendly measure of accul-turation attitudes. International Journal of Intercultural
Relations, 32, 493-504.
Office for National Statistics. (2004). Focus on ethnicity and
iden-tity. London, England: HMSO.
Oppedal, B., Røysamb, E., & Sam, D. L. (2004). The effect of acculturation and social support on change in mental health among young immigrants. International Journal of Behavioral
Development, 28, 481-494.
Phinney, J. S., Cantu, C., & Kurtz, D. (1997). Ethnic and American identity as predictors of self-esteem among African American, Latino, and White adolescents. Journal of Youth and
Adolescence, 26, 165-185.
Phinney, J. S., Horenczyk, G., Liebkind, K., & Vedder, P. (2001). Ethinc identity, immigration, and well-being: An interactional perspective. Journal of Social Issues, 57, 493-510.
Portes, A., & Rumbaut, R. G. (2005). Introduction: The second generation and the children of immigrants longitudinal study.
Ethnic and Racial Studies, 28, 983-999.
Redfield, R., Linton, R., & Herskovits, M. (1936). Memorandum on the study of acculturation. American Anthropologist, 38, 149-152.
Ruble, D. N., Alvarez, J., Bachman, M., Cameron, J., Fuligni, A., & Coll, C. G. (2004). The development of a sense of “we”: The emergence and implications of children’s collective identity. In M. Bennett & F. Sani (Eds.), The development of the social self (pp. 29-76). East Sussex, UK: Psychology Press.
Rudmin, F. R. (2003). Critical history of the acculturation psychol-ogy of assimilation, separation, intergration, and marginaliza-tion. Review of General Psychology, 7, 3-37.
Rudmin, F. R., & Ahmadzadeh, V. (2001). Psychometric critique of acculturation psychology: The case of Iranian migrants in Norway. Scandanavian Journal of Psychology, 42, 41-56.
Brown et al. 1667
Rutland, A., Cameron, L., Jugert, P., Nigbur, D., Brown, R., Watters, C., & Touze, D. (2012). Group identity and peer rela-tions: A longitudinal study of group identity, perceived peer acceptance and friendships amongst ethnic minority English children. British Journal of Developmental Psychology, 30, 283-302.
Rutland, A., Killen, M., & Abrams, D. (2010). A new social-cognitive developmental perspective on prejudice: The inter-play between morality and group identity. Perspectives on
Psychological Science, 5, 279-291.
Ryder, A. G., Alden, L. E., & Paulhus, D. L. (2000). Is accul-turation unidimensional or bidimensional? A head-to-head comparison in the prediction of personality, self-identity, and adjustment. Journal of Personality and Social Psychology,
79, 49-65.
Turner, R., & Brown, R. (2008). Improving children’s attitudes towards refugees: An evaluation of a school-based multicul-tural curricula and anti-racist intervention. Journal of Applied
Social Psychology, 38, 1295-1328.
United Nations. (2008). Trends in international migrant stock: The
2008 revision. New York, NY: United Nations Department of
Economic and Social Affairs.
van de Vijver, F. J. R., Helms-Lorenz, M., & Feltzer, M. J. A. (1999). Acculturation and cognitive performance of migrant children in the Netherlands. International Journal of Psychology, 34, 149-162. Ward, C., & Kus, L. (2012). Back to and beyond Berry’s basics:
The conceptualization, operationalization and classification of acculturation. International Journal of Intercultural Relations,
36, 472-485.
Ward, C., & Rana-Deuba, A. (1999). Acculturation and adaptation revisited. Journal of Cross-Cultural Psychology, 30, 422-442. Zagefka, H., & Brown, R. (2002). The relationship between
acculturation strategies, relative fit and intergroup relations: Immigrant-majority relations in Germany. European Journal
of Social Psychology, 32, 171-188.
Zheng, X., & Berry, J. W. (1991). Psychological adaptation of Chinese sojourners in Canada. International Journal of