LYOTROPIC LIQUID CRYSTALLINE MESOPHASES
FROM ACID-SALT-SURFACTANT SYSTEMS:
SYNTHESIS AND CHARACTERIZATION OF
MESOPOROUS LiMPO4 (M=Mn(II),Fe(II),Co(II) AND
Ni(II))
A THESIS SUBMITTED TO
THE GRADUATE SCHOOL OF ENGINEERING AND SCIENCE OF BILKENT UNIVERSITY
IN PARTIAL FULFILLMENT OF THE REQUIREMENTS FOR THE DEGREE OF MASTER OF SCIENCE IN CHEMISTRY
By
Işıl Uzunok
September 2019
ii
LYOTROPIC LIQUID CRYSTALLINE MESOPHASES FROM
ACID-SALT-SURFACTANT
SYSTEMS:
SYNTHESIS
AND
CHARACTERIZATION
OF
MESOPOROUS
LiMPO
4(M=Mn(II),Fe(II),Co(II) AND Ni(II))
By Işıl Uzunok September 2019
We certify that we have read this thesis and that in our opinion it is fully adequate, in scope and in quality, as a thesis for the degree of Master of Science.
_________________________________ Ömer Dağ (Advisor) _________________________________ Ceyhan Kayran İşçi _________________________________ Ayşen Yılmaz _________________________________ Ferdi Karadaş _________________________________ Burak Ülgüt Approved for the Graduate School of Engineering and Science:
________________________________________ Ezhan Karaşan
iii
ABSTRACT
LYOTROPIC LIQUID CRYSTALLINE MESOPHASES
FROM ACID-SALT-SURFACTANT SYSTEMS:
SYNTHESIS AND CHARACTERIZATION OF
MESOPOROUS LiMPO
4(M=Mn(II),Fe(II),Co(II) AND
Ni(II))
Işıl Uzunok M. S. in Chemistry Advisor: Ömer Dağ September 2019This study presents the synthesis and characterization of mesoporous lithium metal phosphates (LMPs) of Mn(II), Fe(II), Co(II), and Ni(II). The LMPs were synthesized using a modified molten salt self-assembly (MASA) method. Clear and homogeneous solutions of lithium nitrate (LiNO3), transition metal nitrate
([M(H2O)6](NO3)2, phosphoric acid (H3PO4, PA), and surfactant (pluronic P123,
EO20PO70EO20, where EO is ethylene oxide and PO is propylene oxide) in water
were spread on a microscope slide by drop-cast coating method to from a lyotropic liquid crystalline (LLC) mesophase. The mesophases were characterized using polarized optic microscope (POM) and x-ray diffractrometer (XRD) techniques. In the mesophase, the mole ratio of the inorganic components was kept constant (1:1:1, Li(I):M(II):PA) but the inorganic ingredient (lithium salt, transition metal salt, and PA) to surfactant mole ratios were varied from 10 to 90. The mesophases are ordered and diffract at small angles in all compositions. However, the mesophases slowly undergo transformation from LLC mesophase to semisolid mesostructured particles by the hydrolysis of PA and LMP formation over time.
The drop-cast coated samples were calcined to produce mesoporous LMPs. The samples were characterized using N2 adsorption-desorption, XRD, scanning electron
iv
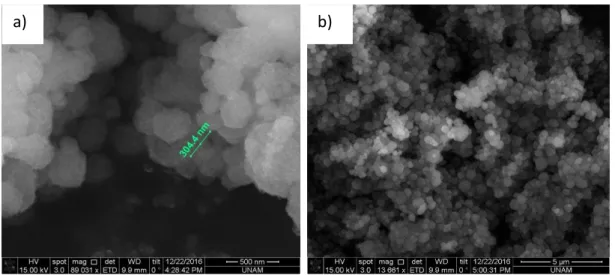
reflectance - fourier-transform infrared spectroscopy (ATR-FTIR) techniques. The LMPs are amorphous up to 400 oC but become crystalline above this temperature. The amorphous mesoporous LMPs have large Brunauer, Emmett and Teller (BET) surface area, around 30-100 m2/g but drops down to a few m2/g upon annealing at 500 oC. The SEM images show that the particle morphology depends on the
inorganic/surfactant ratio in the initial mesophase.
Both Mn(II) and Co(II) produce the olivine phase of LiMnPO4 (LMnP) and LiCoPO4
(LCoP), respectively, under our reaction conditions. However, Ni(II) samples need either excess lithium source or adjustment of pH of the clear solutions to form olivine phase of LiNiPO4 (LNiP). This adjustment can be done by using LiH2PO4 as
the Li(I) and phosphate source in place of LiNO3 and PA. Unlike iron compound, the
olivine phases of LMPs of Mn(II), Co(II) and Ni(II) were successfully obtained. In the iron case, it is difficult to keep iron in 2+ oxidation state under our reaction conditions. It undergoes an oxidation to form Fe3+ species. Therefore, mesoporous FePO4 and Li3Fe2(PO4)3 materials were synthesized, where the iron has 3+ oxidation
state.
Most synthesis has been carried out over glass slides that simply contain 16% of sodium. We found that our samples undergo Na+ ion-exchange reaction with the glass substrates above 300 oC. Therefore, the samples were first calcined at 300 oC over glass substrates and further annealed at higher temperatures in alumina sample holder to produce mesoporous forms. However, if the annealing step is carried over the glass slides, sodium metal phosphates (NaMPs) form in maricite phase. These samples were also characterized by XRD, SEM, TEM, and ATR-FTIR techniques. To eliminate the ion-exchange reactions, other substrates like quartz, pyrex or fluorine doped tin oxide (FTO) were used. However, notice that ion-exchange can also be performed to synthesize mesoporous maricite NaMPs as another synthesis method.
Keywords: Mesoporous Materials, Lyotropic Liquid Crystals, Lithium Metal Phosphate, Molten-Salt-Assisted Self-Assembly.
v
ÖZET
ASİT-TUZ-YÜZEY AKTİF MADDE KARIŞIMLARINDAN
ELDE EDİLEN LİYOTROPİK SIVI KRİSTAL
ARAFAZLAR: MEZOGÖZENEKLİ LiMPO
4’ LERİN
(M=Mn(II),Fe(II),Co(II) VE Ni(II)) SENTEZİ VE
KARAKTERİZASYONU
Işıl Uzunok Kimya, Yüksek Lisans Tez Danışmanı: Ömer Dağ
Eylül, 2019
Bu tez çalışması, Mn(II), Fe(II) Co(II) ve Ni(II) mezogözenekli lityum metal fosfatlarının (LMPs) sentez ve karakterizasyonu üzerine bir çalışmadır. LMPs eriyik tuz yardımlı kendiliğinden oluşma yöntemi (MASA) modifiye edilerek sentezlenmiştir. Liyotropik sıvı kristal (LSK) arafazları, lityum nitrat (LiNO3), geçiş
metal nitrat ([M(H2O)6](NO3)2) tuzları, fosforik asit (H3PO4, PA) ve yüzey aktif
madde (pluronik P123, EO etilen oksit ve PO propilen oksit, EO20PO70EO20)
maddelerinin suda hazırlanmış saydam ve homojen çözeltilerinin mikroskop camı üzerine damlatma ve yayma metodu ile hazırlanmış; POM ve XRD teknikleri kullanılarak karakterize edilmişlerdir. Arafazda, anorganic bileşenlerin mol oranı sabit tutulurken (1:1:1, Li(I):M(II):PA), anorganik bileşenlerin (lityum tuz, geçiş metali tuzu ve PA) yüzey aktif maddeye oranı 10’dan 90’a değiştilmiştir. Arafazlar düzenli ve bütün oranlarda x-ışınlarının küçük açılarda kırar. Fakat bu arafazlar zamanla PA hidrolizi ve LMP’lerin oluşumu ile yavaşça LSK arafazdan yarıkatı haldeki arayapılı taneciklere dönüşür.
Mezogözenekli LMP’leri üretmek için, damlatma yöntemiyle hazırlanmış örnekler, kalsine edilmiştir. Bu örnekler N2 adsorpsiyon-desorpsiyon yöntemi, XRD, SEM,
TEM ve ATR-FTIR teknikleri kullanılarak karakterize edilmiştir. LMP’ler 400 oC’ye
vi
dönüşürler. Amorf mezogözenekli LMP’ler, 30-100 m2/g civarında yüksek BET
(Brunauer, Emmett and Teller) yüzey alanına sahiptirler; fakat bu yüzey alanı, sıcaklık 500 oC civarına getirildiğinde daha küçüktür. SEM görüntüleri gösteriyor ki,
tanecik morfolojisi başlangıç arafazındaki anorganik/yüzey aktif madde oranına bağlıdır.
Mn(II) ve Co(II) maddeleri sırasıyla LiMnPO4 (LMnP) ve LiCoPO4 (LCoP)
maddelerinin olivin fazları bizim sağladığımız tepkime koşullarında oluşturulmuştur. Fakat LiNiPO4 (LNiP) maddesinin olivin fazını oluşturmak için, Ni(II) örnekleri, ya
fazladan lityum kaynağı kullanımına ya da saydam çözeltilerin pH ayarlanmasına ihtiyaç duyar. Bu pH ayarlaması, LiNO3 ve PA yerine, Li(I) ve fosfat kaynağı olarak
LiH2PO4 kullanılarak yapılabilir. Demir örnekleri dışında, Mn(II), Co(II) ve
Ni(II)’lerin LMP’lerinin olivin fazları elde edilmiştir. Demirli örneklerde, oluşturduğumuz tepkime koşullarında demiri 2+ yükseltgenme basamağında korumak zor olduğundan, demir oksidasyona uğrayarak Fe3+ türlerini oluşturur. Bu sebeple, mezogözenekli, demirin 3+ yükseltgenme basamağında olduğu FePO4 ve
Li3Fe2(PO4)3 materyalleri sentezlenmiştir.
Çoğu sentez, %16’sını sodyumun oluşturduğu mikroskop cam üzerinde gerçekleştirilmiştir. 300 oC üzerindeki sıcaklıklarda, mikroskop camı üzerinde
hazırlanan örnekler ile cam arasında Na+ iyon-değişim tepkimelerinin meydana
geldiği belirlenmiştir. Bu sebeple, ilk olarak örnekler yine mikroskop camları üzerinde 300 oC sıcaklıkta kalsine edildi ve daha sonra alumina kap içinde, mezogözenekli formlarını oluşturmak için daha yüksek sıcaklığa çıkarıldı. Fakat sıcaklık artırma adımı alumina kap yerine mikroskop camı üzerinde yapılırsa, marisit faz halindeki sodyum metal fosfatlar (NaMPs) oluşmaktadır. Bu örnekler, XRD, SEM, TEM ve ATR-FTIR teknikleri kullanılarak karakterize edilmiştir. İyon-değişim tepkimelerini engellemek için kaplanan yüzey olarak quartz, pyrex ya da FTO kullanıldı. Fakat iyon-değişim tepkimesi mezogözenekli marisit NaMPs maddesini sentezlemek için başka bir sentez metodu olarak kullanılabileceği de not edilmelidir.
Anahtar kelimeler: Mezogözenekli malzemeler, Liyotropik Sıvı Kristaller, Lityum Metal Fosfat, Eriyik Tuz Yardımlı Kendiliğinden Oluşma.
vii
Acknowledgement
I, firstly, would like to thank to my supervisor Ömer Dağ for all of his support and guidance. Since the beginning from my third year of bachelor, he taught me all academic way of thinking. When I needed help throughout my senior and master studies, he was always there to solve my problems and guide me through.
I thank TÜBİTAK for financial support during my master education under the project number 215Z193.
I also thank to my all group members, who are Ezgi Yılmaz Topuzlu, Nesibe Akmanşen, Işık Tunçay, Mete Turgut and Guvanch Gurbandurdyyev for their collaborations and supports in any time. I am appreciated for friendship of my another group member, Assel Amirzhanova as we had time to have fun together in lab and also out of lab. In addition to my current group members, I would like to thank to my old group members; especially Gülbahar Saat to teach me all things about lab operations and my senior studies, Tuluhan Olcayto Çolak, Muammer Yusuf Yaman, and Nüveyre Canbolat. I cannot ignore supports of my classmates who are Merve Yence and Selin Ezgi Dönmez. I also want to thank Kerem Emre Ercan for helping us in Jordan throughout our data measurement and analysis.
I cannot thank Irmak Karakaya enough for her unbelievable support. She is not just my lab mate, but also she is my old roommate, current home mate, in short she was my everything during all of my Bilkent years. I could not be that successful if she were not my friend.
I am sincerely grateful that I have a perfect family, my mom İkbal Uzunok, my dad Rafet Uzunok and my brother Rıfatcan Uzunok for always being with me throughout all my academic life. I cannot payback their sacrifices for me in all my hard times. Also, I want to thank to my sister from another mother, Ayşe Sezgin, to share experiences from her own thesis and she leaded me to win the poster presentation award.
I have special thanks to my dear love, Burak Ulu, for all his patience and hardworking with me during bachelor and master years. He was always there whenever I needed.
viii
Table of Contents
Chapter 1 ... 1
1. Introduction ... 1
1.1. Transition Metal Phosphates ... 1
1.2. Mesoporous Materials... 4
1.3. Molten Salt Assisted Self Assembly (MASA) Method ... 9
1.4. Lyotropic Liquid Crystalline Mesophases ... 10
1.5. The LLC Mesophase and Mesoporous LiMPO4 (M=Co(II), Mn(II), Fe(II), Ni(II)) ... 13
1.6. Lithium to Sodium Exchange ... 14
Chapter 2 ... 16
2. Experimental Section ... 16 2.1. Materials ... 16 2.2. Synthesis of materials ... 18 2.3. Instrumentation ... 21Chapter 3 ... 24
3. Results and Discussions ... 24
3.1. Mesophases of Acid-Surfactant System ... 24
3.2. Mesophases of Lithium Salt-Transition Metal Salt-P123... 33
3.3. Synthesis of Mesoporous Lithium Manganese Phosphate ... 37
3.4. Synthesis of Mesoporous Lithium Cobalt Phosphate ... 50
3.5. Synthesis of Mesoporous Lithium Nickel Phosphate ... 57
3.6. Synthesis of Mesoporous Lithium Iron Phosphate ... 76
3.7. Comparison of Lithium Transition Metal Phosphates, LMPs ... 89
ix
Chapter 4 ... 105
4. Conclusion ... 105
Chapter 5 ... 108
5. Future Work ... 108
5.1. Synthesis of Characterization of Mesoporous NaCoPO4 using Sodium Precursor ... 108
5.2. Synthesis and Characterization of Mesoporous M2P2O7 (M=Mn, Co, Ni) 111
Bibliography ... 116
x
List of Figures
Figure 1.1. Schematic representation of hard-templating method. ... 6 Figure 1.2. Schematic representation of soft-templating method. ... 7 Figure 1.3. Schematic representation of solid, liquid crystal, and liquid phases. ... 11 Figure 1.4. Schematic representation of surfactant and a cross-section of a micelle
structure in water. ... 12
Figure 2.1. Schematic representation of solution preparation ... 19 Figure 2.2. Schematic representation of preparation of mesophases and mesopores.
... 20
Figure 3.1. Photos of the homogeneous gels of PA-P123 in vials (from left to right,
the PA/P123 mole ratio is changing from 10 to 90 by 10 increments). ... 25
Figure 3.2. Photos the same vials, upside down, of previous figure. ... 25 Figure 3.3. Small angle XRD patterns of the PA-P123 LLC phase with different
PA/P123 mole ratios of a) 10, 20, and 30, b) 40, 50, and 60, and c) 70, 80, and 90. 26
Figure 3.4. Schematic representation of the hexagonal to cubic transformation. (C =
core, PPO units, and S = shell, PEO units) ... 27
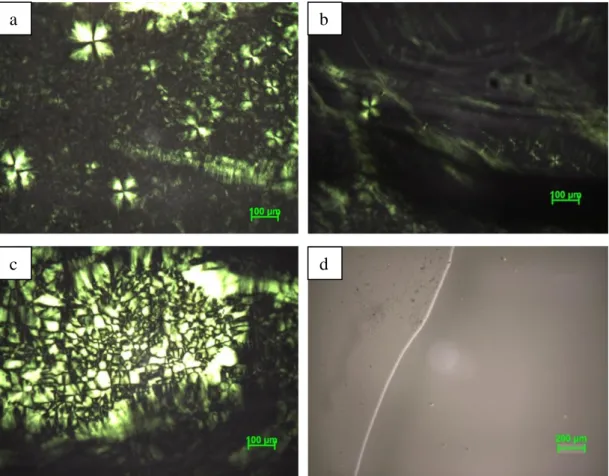
Figure 3.5. The POM images of PA-P123 systems with a PA/P123 mole ratio of a)
10, b) and c) 20, and d) 30. ... 29
Figure 3.6. ATR-FTIR spectra of PA-P123 systems (from bottom to top, increasing
PA/P123 mole ratio, from 10 to 90). ... 30
Figure 3.7. Time dependent small angle XRD patterns of the solutions of PA-P123
for all mole ratios. ... 31
Figure 3.8. The POM images of a) PA-P123-20 and b) PA-P123-40. ... 32 Figure 3.9. ATR-FTIR spectra of the solutions of PA-P123 systems. ... 33 Figure 3.10. Small angle XRD patterns of a) LMnP, b) LCoP, and c) LNiP with
different mole ratios. ... 35
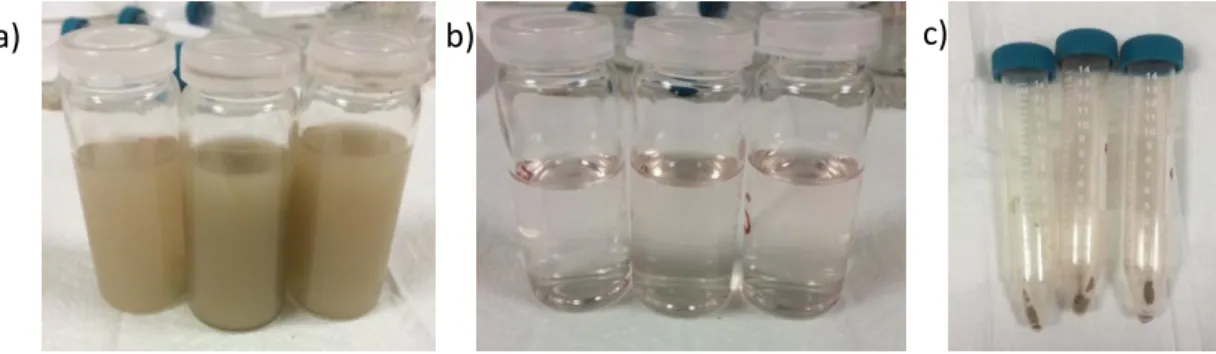
Figure 3.11. Solution forms of LMnP: a) before centrifugation, b) after
centrifugation, and c) precipitates of LMnP solutions. ... 37
Figure 3.12. High angle XRD pattern of the precipitate from the initial LMnP
solution. ... 38
xi
Figure 3.14. FTIR spectra of mesophases of LMnP-XX (XX values are given in the
spectra) at room temperature. ... 39
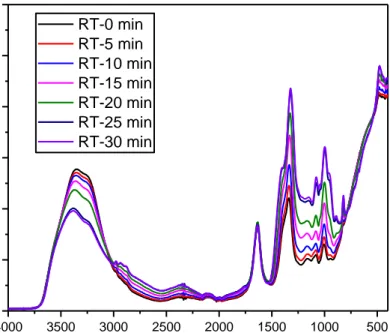
Figure 3.15. Time dependent ATR-FTIR spectra of LMnP-90 at room temperature.
... 40
Figure 3.16. SEM images of LMnP-90 at room temperature... 41 Figure 3.17. High angle XRD patterns of LMnP for different mole ratios at 300 oC for 1 hour. ... 41
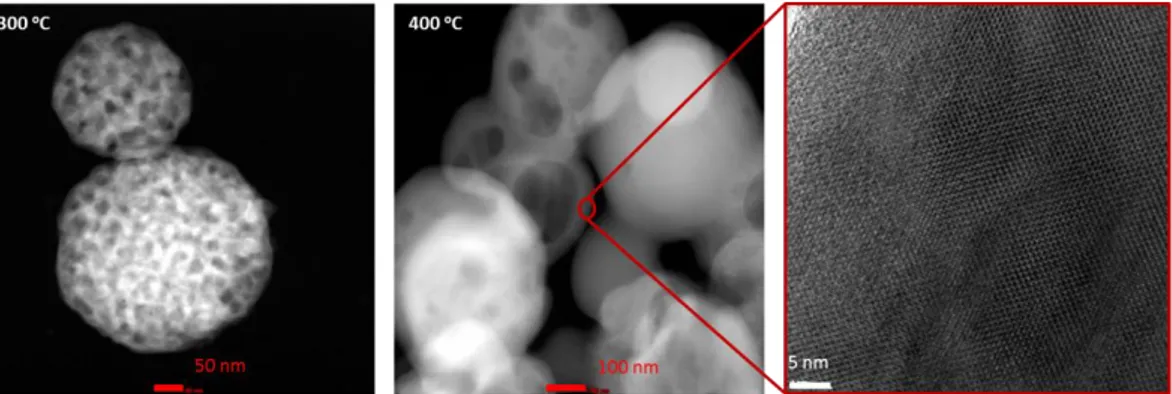
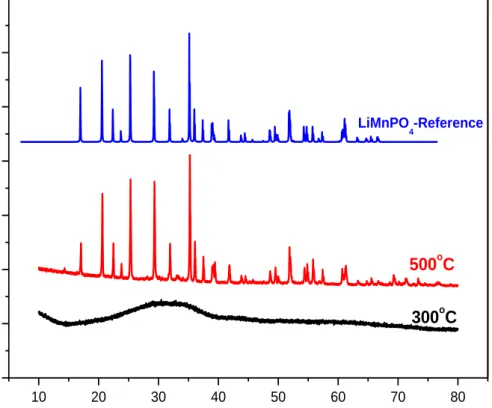
Figure 3.18. FTIR Spectra of the LMnPs with different mole ratios at 300oC. ... 42 Figure 3.19. High angle XRD patterns of LMnP-90 a) at 300, 350, and 400 oC and b) at 400 oC and LiMnPO4 reference PDF-card no 00-033-0804. ... 43 Figure 3.20. TEM images of LMnP-90 at 300oC (left), 400oC (middle) and zoomed 400oC (right). ... 43
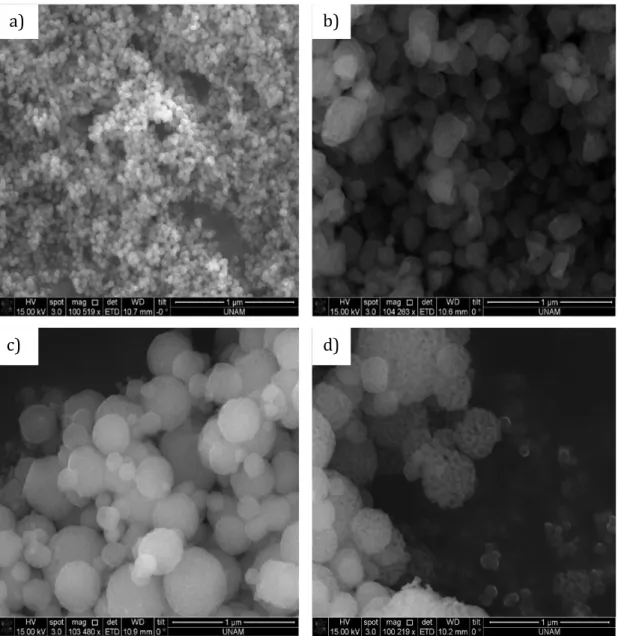
Figure 3.21. FTIR spectra of LMnP-90 at various temperatures. ... 45 Figure 3.22. SEM images of a) 10, b) 40, c) 70, and d)
LMnP-90 at 300 oC. ... 46
Figure 3.23. High angle XRD patterns of LMnP-60 at 300 and 500 oC with the reference data (PDF-card no 00-033-0804). ... 47
Figure 3.24. SEM images of the LMnP-60 sample calcined at 300 and 500 oC (scale bars are 2 µm). ... 48
Figure 3.25. TEM images of the LMnP-60 at 300 oC at different magnifications. .. 49
Figure 3.26. a) Linear isotherm plot and b) BJH pore size distribution plots of
LMnP-60, calcined at 300 and 500 oC. ... 50
Figure 3.27. ATR-FTIR spectra of aging of the S-LCoP at room temperature. ... 51 Figure 3.28. SEM images of LCoP-90 at room temperature. ... 52
Figure 3.29. High angle XRD patterns of LCoP-60 and reference data of LiCoPO4,
the PDF-card no 00-032-0552. ... 53
Figure 3.30. SEM images of LCoP- a) 10, b) 20, c) 30, d) 40, e) 50, f) 60, g) 70, h)
80, and i) 90 mole ratios at 300 oC. ... 54 Figure 3.31. TEM images of LCoP- a) 10, b) 40, c) 60 and d) 90 mole ratios at 300 oC. ... 55 Figure 3.32. a) Linear isotherm plot and b) BJH pore size distribution of LCoP-60
xii
Figure 3.33. FTIR spectra of LCoP-60 at 300 and 500 oC ... 57
Figure 3.34. Photos of calcined LNiP-90 samples at different temperatures. ... 58 Figure 3.35. Small angle XRD pattern of LNiP-90 mole ratio at different
temperatures. ... 59
Figure 3.36. FTIR spectra of LNiP-90 at different temperatures. ... 60 Figure 3.37. SEM images of LNiP-90 at a) and b) RT, c) and d) 50 oC, e) 100 oC, and f) 150 oC. ... 61 Figure 3.38. SEM images of LNiP-90 at g) and h) 200 oC, i) and j) 250 oC, and k)
and l) 300 oC. ... 62
Figure 3.39. High angle XRD patterns of LNiP-90 a) at 400, 450, and 500 oC and b) 500 oC and LiNiPO4 reference with PDF-card no 00-032-0578. ... 63 Figure 3.40. High angle XRD patterns of LNiP-90 a) with 10% and b) with 20%
excess lithium at 500 oC and LiNiPO4 reference with PDF-card no 00-032-0578. ... 64
Figure 3.41. High angle XRD patterns of LNiP-90, exLi%10, exLi%20 and LiNiPO4
reference with PDF-card no 00-032-0578 a) at direct 500 oC and b) at annealed 500
oC. ... 64 Figure 3.42. ATR-FTIR spectra of LNiP-90 with a) 10% excess lithium and b) 20%
excess lithium for both annealed and direct calcination at 500 oC. ... 65
Figure 3.43. High angle XRD patterns of LNiP-90-x:y samples at annealed 500 oC. ... 67
Figure 3.44. FTIR-ATR spectra of LNiP-90-x:y samples at annealed 500 oC . ... 68
Figure 3.45. SEM images of a) 0:100, b) 25:75, and c)
LNiP-90-50:50 at 300 oC (all right one zoomed of the left images). ... 69
Figure 3.46. SEM images of d) LNiP-90-75:25 and e) LNiP-90-100:0 at 300 oC (all right one zoomed of the left images)... 70
Figure 3.47. ATR-FTIR spectra of LNiP-90 at RT both washed and unwashed
forms. ... 71
Figure 3.48. SEM images of LNiP-90 at RT before (left) and after washing (right).
... 72
Figure 3.49. High angle XRD patterns of LNiP-60 at 300, 500 oC and olivine LiNiPO4 reference, PDF-card no 00-032-0578. ... 72 Figure 3.50. ATR-FTIR spectra of LNiP-60 at 300 and 500 oC. ... 73
xiii
Figure 3.51. SEM images of LNiP-60 at 300 oC at different magnifications ... 74
Figure 3.52. SEM images of LNiP-60 at 500 oC at different magnifications ... 74
Figure 3.53. TEM images of LNiP-60 at 300 oC at different magnifications. ... 75
Figure 3.54. a) Linear isotherm plot and b) BJH pore size distribution of LNiP-60 for 300 and 500 oC. ... 76
Figure 3.55. XRD patterns of LFeP-90 with NO3- salts (left) at different temperature, (right) at 500 oC and LiFePO 4 reference with PDF-card no 00-040-1499, and Fe2O3 reference with PDF-card no 00-033-0664. ... 77
Figure 3.56. Schematic representation of solution preparation of LFeP with chloride salts. ... 78
Figure 3.57. (Left) Picture of LFeP-60 solution with precipitates, (Right) high angle XRD patterns of precipitate and FePO4.2H2O reference with PDF-card no 01-070-9911. ... 78
Figure 3.58. High angle XRD patterns of LFeP-60 synthesized by chloride salts and Li2Fe3(PO4)3 reference with PDF-card no 04-016-1665, Fe2O3 with PDF-card no 00-033-0664, Na3Fe2(PO4)3 with PDF-card no 00-045-0319 ... 79
Figure 3.59. SEM images of LFeP-60 a) and b) at 300 oC and c) at 500 oC. ... 81
Figure 3.60. a) Linear isotherm plot and b) BJH pore size distribution of LFeP-60 for 300 and 500 oC. ... 82
Figure 3.61. High angle XRD patterns of LFeP-60:40:60 sample at 300 and 500 oC and Na3Fe2(PO4)3 with PDF-card no 00-045-0319. ... 84
Figure 3.62. High angle XRD patterns of FeP-60 at 300 and 500 oC, and FePO4 reference, PDF-card no 00-029-0715. ... 85
Figure 3.63. ATR-FTIR spectra of LNiP-60 at 300 and 500 oC. ... 86
Figure 3.64. SEM images of FeP-60 at 300 oC with different magnifications. ... 87
Figure 3.65. SEM images of FeP-60 at 500 oC with different magnifications. ... 88
Figure 3.66. Photos of a) solutions, and b) powders of LFeP, LMnP, LCoP, and LNiP from left to right respectively. ... 89
Figure 3.67. High angle XRD patterns of LMPs at (left) 300 oC, and (right) 500 oC. ... 90
xiv
Figure 3.69. TEM images of LMP at 300 oC with scale bar 0.1 µm and 50 nm respectively. ... 91
Figure 3.70. SEM images of LMP at 500 oC with scale bar 2 µm ... 91
Figure 3.71. a) Linear isotherm plot and b) BJH pore size distribution of LMP for
300 oC. ... 92 Figure 3.72. K-edge XANES spectra of LMPs: a) 300 and 500 oC of LCoP and Co3O4, b) LNiP and NiO, and c)300 and 500 oC LFeP and FePO4. ... 94 Figure 3.73. Schematic representation of new methodology for calcination steps. .. 95 Figure 3.74. (Left) Schematic representation of Li+-Na+ exchange, (Right up) the table of sodium percentages in substrates, and (Right down) schematic representation of the FTO. ... 96
Figure 3.75. Photos of the samples calcined at 300 oC on glass, at 500 oC on glass and at 500 oC on Pyrex respectively. ... 97
Figure 3.76. a) Photos of LCoP powders prepared at 300, 400, and 500 oC on glass, b) High angle XRD patterns of LCoP calcined at 300, 400, and 500 oC on glass. .... 98
Figure 3.77. High angle XRD patterns of LCoP calcined on glass at 400 oC, LiCoPO4 reference with PDF card no 00-032-0552, NaCoPO4 reference with PDF
card no 00-052-0335 for Cmca structure and NaCoPO4 reference with PDF card no
04-009-6022 for Pnma structure. ... 99
Figure 3.78. High angle XRD patterns of the LCoP calcined at 500 oC on glass and on Pyrex and LiCoPO4 reference with PDF card no 00-032-0552 and NaCoPO4
reference with PDF card no 04-009-6022. ... 99
Figure 3.79. SEM images of the LCoP samples, calcined on glass at a) 300 oC, b) 500 oC, and c) on Pyrex at 500 oC; d), e) and f) EDAX data of samples in panels a), b), and c), respectively. ... 100
Figure 3.80. ATR-FTIR spectra of LCoP calcined on glass and Pyrex at 300 and 500 oC. ... 101 Figure 3.81. The graph of mole ratios of Li and Na versus temperature. ... 103
Figure 5.1. High angle XRD pattern of NCoP-60 at 300 and 500 oC and NaCoPO
4
reference with PDF card no 00-052-0335 for hexagonal structure and 04-009-6022 for orthorhombic structure. ... 109
xv
Figure 5.2. High angle XRD pattern of NCoP-60 with and without ion exchange
synthesis and NaCoPO4 reference with PDF card no 00-052-0335 for hexagonal
structure and 04-009-6022 for orthorhombic structure. ... 109
Figure 5.3. SEM images of LCoP-60 (left column) and NCoP-60 (right column) at
300 oC. ... 110 Figure 5.4. High angle XRD pattern of CoPP-60 at 300 and 700 oC and Co2P2O7
reference with PDF card no 00-049-1091. ... 112
Figure 5.5. High angle XRD pattern of MnP-60 at 300 and 700 oC and Mn 2P2O7
reference with PDF card no 00-029-0891. ... 112
Figure 5.6. High angle XRD pattern of NiPP-60 at 300 and 700 oC and Ni2P2O7
reference with PDF card no 00-049-1082. ... 113
Figure 5.7. SEM images of NiPP-60 sample calcined at 300 oC. ... 114
Figure 5.8. SEM images of CoPP-60 sample calcined at 300 oC. ... 114
Figure 5.9. ATR-FTIR spectra of MPP-60 samples at 300 and 700 oC of (a) Co, (b) Mn and (c) Ni. ... 115
xvi
List of Tables
Table 2.1. Amounts of ingredients used for the solutions of given molar ratios for
LiCoPO4, LiMnPO4 and LiNiPO4. ... 17 Table 2.2. Amounts of ingredients used for the solutions of given molar ratios for
LiFePO4 ... 18 Table 3.1. The BET surface areas of LMnP-90 at different temperatures. ... 44 Table 3.2. The BET surface areas, BJH pore sizes, and pore volumes of LMnP-60 at
300 and 500 oC. ... 50
Table 3.3. The BET surface areas, the BJH pore sizes and pore volumes of LCoP-60
at 300 and 500 oC. ... 56
Table 3.4. Amounts of ingredients used in the solutions of LNiP-90 using LiH2PO4.
... 66
Table 3.5. The BET surface areas, the BJH pore sizes and pore volumes of LNiP-60
at 300 and 500 oC. ... 76
Table 3.6. The BET surface area, the BJH pore size, and pore volume of LFeP-60 at
300 and 500 oC. ... 82
Table 3.7. The amounts of ingredients for the LFeP-60:40:60. ... 83 Table 3.8. The BET surface area and the BJH pore size of LMP-60 at 300 and 500 oC. ... 92 Table 3.9. ICP-MS results of LCoP on different substrates that are normalized to
PO4 amount. ... 102 Table 3.10. ICP-MS results of LCoP on glass at different temperatures that are
normalized to P amount. ... 102
Table 3.11. ICP-MS results for LMnP, LNiP and LFeP samples on both glass and
Pyrex substrate at 300 and 500 oC... 104
Table 5.1. The BET surface areas, BJH pore sizes, and pore volumes of LMnP-60 at
300 and 500 oC. ... 111
xvii
List of Abbreviations
LC : Liquid Crystal
LLC : Lyotropic Liquid Crystal LMP : Lithium Metal Phosphate PA : Phosphoric Acid
EISA : Evaporation Induced Self Assembly MASA : Molten salt Assisted Self Assembly XRD : X-Ray Diffraction
POM : Polarized Optical Microscopy SEM : Scanning Electron Microscopy TEM : Transmission Electron Microscopy EDX : Energy Dispersive X-Ray Analysis
ATR-FTIR : Attenuated Total Reflection Fourier-Transform Infrared BET : Brunauer, Emmett and Teller
ICP-MS : Inductively Coupled Plasma Mass Spectrometry XANES : X-Ray Absorption near Edge Structure
EXAFS : Extended X-Ray Absorption Fine Structure
IUPAC : International Union of Pure and Applied Chemistry SC : Supercapacitor
MPP : Metal Pyrophosphates FTO : Fluorine Doped Tin Oxide
1
Chapter 1
1. Introduction
1.1. Transition Metal Phosphates
High performance batteries are needed for the usage of electronic devices in daily life and for the hybrid technology of automobile industry. To meet the battery requirements, transition metal oxides such as LiCoO2, LiMn2O4 have been
investigated for over a century [1], [2].
This thesis focuses on the synthesis of transition metal phosphates that are also widely employed as cathode materials for the lithium-ion batteries. The reason of choosing these materials for the applications is due to their low cost and having thermodynamic and kinetic stability [1], [3]. Beginning with the studies of Padhi and his coworkers, metal phosphates and lithium metal phosphates have gained significant importance in the field of battery applications. The phosphate based electrode materials, particularly the olivine phase of LiFePO4, LiMnPO4, and mixed
LiMPO4 (M is Fe and Mn) can be cycled reversibly between LiMPO4 and MPO4 at
3.4-4.0 V voltage range [4]. Whittingham et al. showed that of Fe1.33PO4OH has a
very high lithium intercalation capacity even though it is lithium free. They also synthesized vanadium phosphates (H2VOPO4) with extra two protons that can be
replaced with lithium ions [5].
In addition to LiFePO4, the olivine phase of LiCoPO4 is also considered to be a good
candidate for lithium ion batteries [6]. Amine et al. demonstrated that the extraction and insertion of lithium ion to these materials occur at 4.8 V and measured the charge/discharge capacities [6]. Okada et al. have also studied the charge capacities
2
of LiCoPO4 [7] and found out that LiCoPO4 displays a high discharge plateau (at 4.8
V), reaching a maximum charge capacity of 100 mAh/g after initial 5.1 V charging. LiMnPO4 has also drawn attention due to its good capacity for the energy
application. The olivine phase of LiMnPO4 has been used for charging-discharging
experiments in the range of 4.1-4.8 V with an overall reversible capacity of 140 mAh/g [8]. The LiNiPO4 materials have also been investigated by many groups.
Deniard et al. have worked on high potential (3-4.8 V) electrochemical cycling of LiMPO4 (where M is Fe, Mn, Co, and Ni). Due to lack of stable electrolytes at such
high potentials and need for high voltage charging/discharging of LiNiPO4 most of
these materials have been investigated by the DFT calculations [9].
Almost in all studies, olivine phases of the metal phosphates have been the target in the synthesis and applications [10]. In addition to the olivine phase, there is a maricite phase of sodium metal phosphates, which have also been utilized in the energy applications as a cathode material. The difference between olivine and maricite structures is that the olivine phase has higher interest as a cathode material for lithium and sodium ion batteries, whereas the maricite phase is thermodynamically more stable phase of the same compositions [11]. The maricite phase has also been preferred due to its low cost and environmental concerns,[12] like the olivine phase [13].
The maricite phase of metal phosphates is generally used for sodium ion batteries as a positive-electrode material [14], [15]. Actually, the maricite has been discovered from a natural mineral [16]. The maricite phases of NaMPO4s have also been
prepared for the hybrid capacitors by solution combustion method [17].
There are many differences between the olivine and maricite structures even though their space groups are same; Pnma orthorhombic. The differences are mostly based on their potential range, phase stability and diffusion barriers. The voltages calculated for Na+ ion batteries are in the range of 0.18-0.57 V which is lower than
the voltages calculated for Li+ ion batteries. This lower voltage is originated from the
3
on these features, the maricite structure is used for Na+ ion batteries, whereas the olivine structure is preferred for the Li+ ion batteries [18].
Moreover, there are also differences in structures of olivine and maricite phases based on the locations of the atoms. The maricite structure consists of an alkali metal (generally sodium ion) and a transition metal surrounded by oxygen atoms giving it tetrahedral coordination [16]. Half of the oxygen atoms in the unit cell are bonded to two alkali metals, two transition metal and one phosphorus atom whereas the other half are bonded to three alkali metals, one transition metal and one phosphorus atom [19]. Between the two phases, the position of alkali metal and the position of the transition metal in the olivine phase are reversed in the maricite structure; which makes their structures quite different [20].
The other crucial part is the synthesis methods of lithium transition metal phosphates. There are many different methods to obtain better conductive LMPs in the literature. The earliest and easiest method was performed by Delacourt et al. who tried to synthesize LiMnPO4 powders by one step low temperature route [21]. In that
method, they obtained pure and well-crystalline olivine LiMnPO4 powders by simply
precipitation from an aqueous media of all ingredients in an arranged pH range. Another group had tried to synthesize olivine phase of LiMPO4 by non-aqueous
sol-gel route [22]. In this method, they mixed all chemicals in an organic solvent at room temperature in different mole ratios. The obtained homogenous gels were aged over various time and then heated at higher temperatures to obtain the desired crystals. There is also another general technique for the synthesis of cathode materials, called hydrothermal synthesis [23]. This synthesis method has many steps and uses autoclaves to obtain the crystals of these materials. Polyol method is usually employed to synthesize fine particles of LiMnPO4 [24]. In the polyol method, the
metal acetate salt is mixed in a polyol medium that produces quite small crystals. The majority of the synthesis methods produces the bulk materials [25], [26] with a very low surface area; the surface in these non-conductive cathode materials is important for a good conductivity. Therefore, researchers have tried to synthesize porous materials. For this purpose, they generally used a sol-gel method by using acetate or citrate salts of metal ingredients [27]. The obtained xerogel from the sol-gel method
4
is calcined in an inert atmosphere at 700 oC. The prepared samples are mixed with carbon and some other active materials to test their activity towards a counter electrode. Carbon containing or coated samples of LMPs, especially LiFePO4, have
been analyzed by many groups [28], [29].
1.2. Mesoporous Materials
Porous materials have 3 main classifications based on their pore size; i) microporous materials that have pores smaller than 2 nm, ii) mesoporous materials that have pores in 2-50 nm range, and iii) macroporous materials having pore size higher than 50 nm [30].
Mesoporous materials have high surface area and pore volume, which may provide special conditions and high reactivity in a confined space, such as high interfacial surface, size selectivity for molecules, better ionic and electronic conductivity etc. [31]. These features could be useful for many applications in different fields (such as energy generation, storage and conversion, catalysis, drug delivery, adsorption, and photonics) compared to their bulk materials [32]–[35]. Definition of bulk depends on the type of material and also on the property under question. For instance, electronically, it is the size of an electron-hole pair, exciton Bohr radius. Below this size the electronic property scales with the size of the particle. Therefore, bulk is defined as a size of a material that displays no size-effect on a specific property. Mesoporous materials have pore-wall size usually smaller than Bohr radius of electron-hole pair and display properties depending on the wall-thickness. Therefore, they are important in many applications that the size dependent property may bring new properties and enhanced functions.
First examples of mesoporous materials have been introduced almost 30 years ago on silicates [36]. The discovery of a hexagonally ordered mesoporous silicate began with studies of M41S materials [37], [38] and FSM-16 materials [39], [40]. Later, formation mechanism for silicate rod assembly was proposed using TEM images. [41], [42]. Moreover, effect of different anions to porosity, morphologies, thermal stability, and structures of mesoporous silicates were examined. It has been
5
established that the Hofmeister series of anions are responsible for the hydrolysis rates of silica species and formation of micelle structures of the surfactants that are used in the assembly process [43], [44]. In addition, rather than direct interactions between surfactants and inorganic species, the surface interactions between silicates and water adsorbed on the surfaces of micelle structures were discussed to elucidate the structure formation in the mesoporous silicates.
The mesoporous silicates have also been investigated by Dag et al. to control the morphology and stability, and also to determine the role of the charged (cethyltrimethylammonium bromide, CTAB) in a non-ionic surfactant (pluronic P123) assembly of mesoporous thin films [45]. These materials have been investigated over several decades to overcome some of their disadvantages due to low thermal stabilities and low chemical reactivity of the mesoporous silicates with amorphous walls [46].
In addition to silica based mesoporous materials that have been studied for a long time by using different silica sources and various types of surfactants, many new methods have also been developed for the synthesis of non-siliceous mesoporous materials [47]. Among the non-siliceous materials, the mesoporous metal oxides have drawn interest due to their useful applications; confinement effect in their nanospace, active surfaces, and well-ordered pore network that make these materials special [48].
There are many examples of mesoporous metal oxides[49] synthesized by soft[50] and hard[51] templating methods in the literature. Also, in our group, some mesoporous metal oxides have been studied for sometimes. Mesoporous transition metal titanates and lithium titanates have been synthesized as thin films by using molten salt assisted self-assembly (MASA) method. The method uses two surfactants, such as CTAB and 10-lauryl ether (C12EO10) [52]. First examples of
mesoporous LiCoO2 and LiMn2O4 thin films have also been demonstrated by Dag et
al. by using two surfactants systems (10-lauryl ether and CTAB or CTAN, cethyltrimethylammonium nitrate). The salts and surfactants form lyotropic liquid crystalline mesophases (LLCM), in which the salt species are in their molten phase.
6
The LLCMs have been used to synthesize those materials that have been already employed as electrodes for the electrocatalytic oxidation of water [53].
1.2.1. Hard Templating Methods
In order to synthesize some of the mesoporous materials, hard templating method has been developed as a powerful process for the synthesis of metal oxides. Hard templating process have 3 steps: in the first step, a mesoporous silicate or carbon is synthesized by soft templating method, followed by a calcination to evocate the pores, in the second step, the target precursors are filled into the mesopores of the mesoporous silica or carbon and then heat treated to obtain metal oxide coated silica or carbon and finally in the third step, the first template (silica or carbon) is removed via washing in a highly basic or HF solutions to obtain the mesoporous metal oxides [50]. The process is schematically shown in Figure 1.1.
Choose of template is very crucial in this method. The template must have ordered mesopores and should be easily removed by washing with an appropriate solution in the last step of the method. For this purpose, generally mesoporous carbon is preferred to produce porous metal oxides by controlling the size and compositions [51].
Besides mesoporous metal oxides, it is also possible to synthesize nanostructured materials with hard-templating method by using siliceous mesoporous templates [54]. Even though, hard-templating is a very powerful method to synthesize mesoporous materials, it is hard to employ for the synthesis of thin films or monoliths. Note that many applications may require thin films or monoliths.
7
Moreover, the stability of the metal precursors in the pores is also crucial for the synthesis. There should not be any side reactions, such as reaction between the precursors and hard template [48]. Therefore, the hard templating may not be useful for many materials, new soft templating method are needed for the synthesis of those mesoporous materials, such as metal oxides, metal chalcogenites, and metal phosphates.
1.2.2. Soft Templating Methods
Soft-templating method is widely utilized for the synthesis of many mesoporous materials using lyotropic liquid crystalline phase made by surfactants. The hydrophobic and hydrophilic interactions among the surfactant molecules enforces these molecules to aggregate into micelle structure (aggregates of certain number of surfactant molecules forming structure with a shell (hydrophilic) and a core (hydrophobic)). Then the micelles assemble into lyotropic liquid crystalline (LLC) phases. The LLC phase can be used as a media and architecture for the precursors that transform into a mesostructured solid, keeping the meso-order in the product by thermal treatments. In this assembly process, firstly, a clear solution of inorganic ingredients (this could be a silica, titania, or salts precursors) and surfactant is prepared; with the evaporation of the volatile components of the solution a gelation process takes place to obtain the mesophase and finally the mesophase is heated to remove surfactant from the structure by calcination [52] or solvent extraction [55] methods, leaving the mesoporous material behind [50]. Figure 1.2 shows a schematic representation of the soft-templating method.
8
Even though, it seems like it is easy to produce mesoporous materials by soft-templating methods, controlling morphology of a desired material is harder than the hard templating method due to condensation or crystallization of the inorganic ingredients during the gelation process and complicated interaction between surfactants and inorganic precursors. This is why most investigation has been devoted to hard-templating method for the synthesis of mesoporous metal oxide materials. The control of morphology is easier in the hard templating method[55]. There are two major processes under the topic of soft-templating method, specifically on the LLC templating approach. First one is evaporation induced self-assembly (EISA) method, discovered by Brinker et al. in 1999 [56]. The EISA is a new method to produce both siliceous and non-siliceous mesoporous metal oxides with an easier and faster way than the hard-templating method. Briker et al. showed that the solution consisting of all the ingredients should not be very concentrated, not to exceed the critical micelle concentration [57]. With the help of low concentration of surfactants and other species, solidified network of mesophase can form easily with the evaporation of the volatile solvent. Solidification process occurs due to the interaction between the surfactant domains and inorganic species. Generally, dip coating method is preferred to obtain solidified phase from the EISA method. The EISA method is easy to apply but unfortunately limited to those materials that their precursors undergo hydrolysis and condensation reaction in the solution and in the mesophase to form a mesostructured solid prior to heat treatment and/or calcination at high temperatures. This method offers to synthesize highly mesoporous ultrathin films of metal oxide [58], such as SiO2, TiO2, ZrO2, etc.. Note that all these materials
have their alkoxide precursors (M(OR)4) that are suitable for room temperature
hydrolysis and condensation reactions. Moreover, it is also possible to produce mesoporous materials of alumina, titania, and mixed metal oxides (SrTiO3,
MgTa2O6, CoxTi1−xO2−x) via EISA method [59], [60].
Even though there are many advantages of the EISA method due to the usage of low cost and non-toxic species and easy control based on size and morphology of the desired material, there are some disadvantages to take into account. The problems generally originate in the hydrolysis and condensation process of the inorganic
9
precursors. This also limits the method because many inorganic species do not undergo hydrolysis and condensation reactions under the conditions of the EISA process. Moreover, the system is very sensitive to the humidity of the environment, which affects the assembly and stability of the mesostructure [48], [61], [62]. Therefore, new methods are needed for more challenging precursors, such as some metal oxides, metal sulfides, and metal phosphates, etc.
1.3. Molten Salt Assisted Self Assembly (MASA) Method
A new method for the synthesis of mesoporous materials had been developed by using transition metal nitrates and C12EO10 (10-laurly ether) by Dag et al. in 2011.
They have used [Zn(H2O)6](NO3)2 and [Cd(H2O)4](NO3)2 salts as inorganic species
and C12EO10 (non-ionic) and CTAB (ionic) as surfactants and showed that the metal
nitrates form a mesostructure by assembling both ionic and non-ionic surfactants. Moreover, they have focused on the metal salts as a secondary solvent in the molten phase, since the mixture of salts and surfactants form LLC phases [63]. As a proof of concept, mesoporous silica metal oxides (such as CdO-SiO2 and ZnO-SiO2) have
been synthesized and converted into mesoporous metal sulfide (CdS and ZnS) and selenide (CdSe and ZnSe) thin films by H2S or H2Se reaction and dilute HF
treatments [64].
These studies are the first examples of synthesizing mesoporous materials by MASA (Molten Salt Assisted Self Assembly) method in which two surfactants and two solvents have been utilized. This method has also been used for the synthesis of mesoporous metal titanates (such as Li4Ti5O12, MnTiO3, CoTiO3, Zn2TiO4, CdTiO3)
that they could be converted into metal sulfide-titania thin films and monoliths [52], [65].
The most important advantage of the MASA method is keeping the salts in the molten phase as a secondary solvent. The first solvent could be water or ethanol (or a mixture of water and ethanol); the new method offers versatility to produce different mesoporous materials and also processing ability. It helps to control the thickness of coatings of the gel phase over a substrate. For instance, diluter solutions can be used
10
to make thinner films and more concentrated ones for thicker films. The MASA differs from the EISA method, in which the mesophase is formed by coating of ingredient (metal precursors and surfactant) solution that converts to a solidified mesostructure by polymerization of the inorganic precursor(s) during aging process. However, in most cases in the MASA, aging of the gels produce only stable LLC phases. Further heating may be necessary to produce mesostructured solid in the MASA process. It is more correct to say that the MASA process is applicable for those metal precursors that cannot be hydrolyzed and polymerized at room temperature. Note also that many transition metal oxides precursors are stable salts at room temperature and therefore, they are not good precursors for EISA process. The secondary solvent, salts or acids or salt and acid altogether, organizes the surfactant species in an LLC mesophase. The ionic surfactant in the mesophase stabilizes the mesophases by charge balancing the molten salt-surfactant interface in the LLC phase and also enhances the molten salt up take of the mesophase[63]. To prevent the condensation reactions, in some circumstances nitric acid can be added to the media to protonate the M-OH species in the medium to slow the hydrolysis and condensation process. Uncontrolled condensation reactions most of the time produce bulk or large nanoparticles that may not be organized into mesostructures by surfactant assembly.
1.4. Lyotropic Liquid Crystalline Mesophases
In the previous sections of the introduction, the term lyotropic liquid crystals have been mentioned in almost every stage of the synthesis of mesoporous materials. It will be useful to describe what liquid crystals is and its one common type the lyotropic one to make, what has been achieved in this thesis is, easy to understand. We have learned from the primary and high schools that there are three states of matter under normal conditions: solid, liquid, and gas. Unfortunately, this is not correct. There is also a fourth phase of matter, called liquid crystalline (LC) phase. The LC phase is a phase having both characteristics of solid and liquid; it has some degree of order like in solid and it has fluidity like liquid. For sure, the order is less than a solid, but more than a liquid. Therefore, the LC phase is also called as
11
mesophase [66]. The word meso is a Greek word for in between. The mesophase is the phase between liquid and solid (describes liquid crystals) and mesoporous materials are porous materials between microporous and macroporous materials. The term is used together with phase or pores between well know two phases and pores, respectively, to describe some of the new materials.
Liquid crystalline phase was first discovered accidentally by Friedrich Reinitzer in 1888, while studying the natural organic compounds based on their melting behaviors [67]. He observed that there is a fuzzy temperature region between the solid and liquid phases of these compounds. These compounds have different melting and freezing points. The different types of LC phases have already been characterized based on their ordered structures.
The LC phases have been divided into two subgroups: i) thermotropic and ii) lyotropic liquid crystals. Thermotropic liquid crystalline phase is observed by heat treatments of certain type of molecular compounds. Those compounds become liquid crystalline in a temperature range and generally form as isotropic LCs [68]. However, the lyotropic liquid crystalline (LLC) mesophases are formed by 2 or more species, one is usually a surfactant and the other is a solvent and also sensitive to temperature. In this thesis, only the LLC phases have been investigated and used, therefore the details of this phase (constructed by micelle building blocks) and the term micellization (important to understand this phase) will be described in detail.
12
Micelle is a structure formed by amphiphilic molecules called surfactants with the help of solubility difference between the hydrophilic and hydrophobic domains of the surfactant in a solvent. Surfactants are amphiphiles that contains both polar (can be neutral or charged) and a nonpolar block. For instance, CTAB is a charged surfactant and P123 is a tri-block copolymer with ethylene oxide polar (two ends) and non-polar propylene oxide (middle) blocks. In a non-polar solvent like water, the hydrophilic domains of the surfactant (polar head) interact with the water, whereas the hydrophobic domains (non-polar tail) accommodate on the center of a structure, called micelle.
Having optimum surfactant/solvent ratio is called critical micelle concentration (CMC) to obtain assembled micelle structure of surfactants. Further increasing the amount of surfactant in the solution enforces micelles to pack into an LLC mesophase and depending on the amount of surfactant in the mesophase, lamellar, hexagonal, or cubic mesophases form [69].
The LLC mesophases have been used as a template for the synthesis of mesoporous materials. The first example was demonstrated by Kresge et al. in 1992 [38]. Beck et al. used this method to prepare, characterize and show the mechanisms of the silicate/aluminosilicate mesoporous molecular species in 1995 [37]. Attard et al. also firstly synthesized oriented monolithic mesoporous silica by using the liquid crystalline mesophase [70]. Dag et al. reported that self-assemblies between
non-Figure 1.4. Schematic representation of surfactant and a cross-section of a micelle structure
13
ionic surfactant (10- lauryl ether) and transition metal salts of Co(II), Ni(II), Zn(II), and Cd(II) by showing the LC features at different mole ratios [71]. The LLC have been studied to understand what happens to salts and nonionic surfactant in the mesophase by diffraction, microscopy, and spectroscopy techniques [72]. Our group also worked on the effects of anions to the LLC phase, prepared by surfactant-metal salts. Moreover, they have studied not only the small surfactants but also larger surfactants, like pluronics [73]–[75].
Ionic surfactants have also an important role in the synthesis of mesoporous materials by LLC phases. The ionic surfactants in the liquid crystalline phases provide the charge balance and also increase the amount of salt in the media and stabilize the mesophase. CTAB can be given as an example for the ionic surfactant. By using two surfactants and LLC phase for the synthesis mesoporous materials, Dag et al. introduced the molten salt-assisted self-assembly (MASA) method to the literature by adding salts into the two surfactant LLC phase as mentioned before [63]. Here, the salts are used as a secondary solvent providing a control of the structure of LLC.
1.5. The LLC Mesophase and Mesoporous LiMPO4 (M=Co(II), Mn(II), Fe(II),
Ni(II))
In this thesis, a modified MASA method is utilized by changing the charge surfactant, CTAB with phosphoric acid (H3PO4) to obtain a stabile LLC mesophase
through the H-bonding between acid and surfactant. The purpose of forming stabile LLC phase is to obtain mesoporous LiMPO4, as mentioned that these materials are
very important for the lithium ion batteries.
In the literature, there are many examples of usage of LLC phases for the synthesis of various materials and lots of methods to produce LMP for the energy applications, but there is no successful example for the synthesis of mesoporous LMPs yet. Here, the aim of this thesis is to combine all these concepts to synthesize mesoporous LMPs by using the LLC mesophase as a template.
14
1.6. Lithium to Sodium Exchange
In this thesis, there is also one more term, ion-exchange, needs to be addressed to fully understand what is happening during synthesis of LMPs. We observed an ion-exchange process that occurs between the glass substrate that was used as flat platform for the synthesis and our synthesis products, LMPs. Most glasses, including microscope slide contains sodium ion in their structure and provide strength to glass. In order to understand the term ‘ion-exchange’ deeply, the examples of cation exchanges can be examined. Cation exchange has been investigated to obtain new materials by using other materials via exchanging one cation with another one or more [76]. Usually, ion-exchange is carried in solid-solution type media, like zeolite modification by changing framework cations with another cation in the solution phase and ion exchange resins used for water cleaning etc. However, here the ion exchange occurs between two solids. In the chemical transformations, solid-solid reactions take place. Therefore, the reactions are mostly very slow due to the diffusion rates of the ions in the solid phase; it generally requires high temperatures or pressure [77]. This exchange can occur for both bulk and nanocrytalline materials. The exchange in the nanocrytalline structure has been found to be much faster and much controllable based on size, shape, and compositions of the material[78]. Son et al. reported that cation exchange between Ag+ and Cd2+ ions to obtain nanocrystals of Ag2Se from CdSe nanoparticles in a methanolic solution of AgNO3 to
preserve/transfer the size uniformity and morphology of CdSe into Ag2Se. Cation
exchange is also used for optimizing the CO2 adsorption properties of metal organic
frameworks (MOFs). An et al. demonstrated that the exchange of tetramethylammonium, tetraethylammonium, or tetrabutylammonium cations via post-synthetic cation exchange in MOF to modify the pore dimensions [79].
There are limited examples about the cation exchange of Na+ and Li+ ions in solid
phases. Garfinkel et al. reported that the diffusion profile of the Na+ and Li+ in Li2O‐
Al2O3‐SiO2 glass. They analyzed the stress data of the glasses by heating and
collecting to obtain diffusion coefficient of these two ions [80]. Similar experiments were done by another group based on the inter diffusion of hydrogen atom and alkali
15
ions in glass substrates. In an acidic solution, Na+ ion, in the glass, and hydronium ion in water undergoes ion-exchange to produce H+ ions in the glass [81].
Ion exchange of Na+ with Li+ was also performed in soda-lime glass by using molten salts of Li+ ion at high temperature (higher than 500 oC). They aimed that exchange of Na+ ion in a soda-lime glass with a smaller ion like Li+ to have strengthened glass since the diffusion of Li+ is easy and Li-rich glasses are much stronger. Moreover,
they studied the effect of some anions to the ion exchange of Na+ to Li+ [82].
The ion exchange of Li+ with Na+ in our samples is quite different from those
studies. We prepared mesophases of lithium metal phosphates over glass substrates. During calcination or annealing steps, lithium in our samples undergoes exchanged with sodium ion in the glass at higher temperatures.
16
Chapter 2
2. Experimental Section
2.1. Materials
All materials were supplied from Sigma-Aldrich and used without purification.
Phosphoric acid (85-88% w/w, Sigma-Aldrich) was used as a phosphate precursor and also to stabilize the mesophase. Manganese(II) nitrate tetrahydrate ([Mn(H2O)4](NO3)2 97%, Sigma-Aldrich), iron(II) chloride tetrahydrate
([Fe(H2O)4]Cl2 99%, Sigma-Aldrich), iron(III) nitrate nonahydrate
([Fe(H2O)6](NO3)2.3H2O 99%, Sigma-Aldrich), cobalt(II) nitrate hexahydrate
([Co(H2O)6](NO3)2 98%, Sigma-Aldrich), nickel(II) nitrate hexahydrate
([Ni(H2O)6](NO3)2 99.9%, Sigma-Aldrich) were used as metal sources and LiNO3,
LiCl, and LiH2PO4 (both >99%, Sigma-Aldrich) were used as lithium source and
phosphate source. As a surfactant, PEG-PPG-PEG, Pluronic® P-123 (Poly(ethylene glycol)-block-poly(propylene glycol)-block-poly(ethylene glycol), (Mw~5800g/mol) 99.9% Sigma-Aldrich) was used without further treatment.
17
All ratios for all LiMPO4 amounts are shown below:
For LiCoPO4;
Mole ratio/ingredients P123 H3PO4 LiNO3 [Co(H2O)6](NO3)2
1:10 1 g 0.200 g 0.119 g 0.506 g 1:20 1 g 0.400 g 0.239 g 1.012 g 1:30 1 g 0.600 g 0.359 g 1.518 g 1:40 1 g 0.800 g 0.479 g 2.025 g 1:50 1 g 1.002 g 0.599 g 2.531 g 1:60 1 g 1.201 g 0.719 g 3.037 g 1:70 1 g 1.402 g 0.839 g 3.543 g 1:80 1 g 1.604 g 0.959 g 4.049 g 1:90 1 g 1.804 g 1.079 g 4.555 g For LiMnPO4;
Mole ratio/ingredients P123 H3PO4 LiNO3 [Mn(H2O)4](NO3)2
1:10 1 g 0.200 g 0.119 g 0.437 g 1:20 1 g 0.400 g 0.239 g 0.873 g 1:30 1 g 0.600 g 0.359g 1.309 g 1:40 1 g 0.800 g 0.479 g 1.746 g 1:50 1 g 1.002 g 0.599 g 2.182 g 1:60 1 g 1.201 g 0.719 g 2.619 g 1:70 1 g 1.402 g 0.839 g 3.055 g 1:80 1 g 1.604 g 0.959 g 3.492 g 1:90 1 g 1.804 g 1.079 g 3.929 g For LiNiPO4;
Mole ratio/ingredients P123 H3PO4 LiNO3 [Ni(H2O)6](NO3)2
1:30 1 g 0.600 g 0.359 g 1.517 g
1:60 1 g 1.201 g 0.719 g 3.034 g
1:90 1 g 1.804 g 1.079 g 4.552 g
Table 2.1. Amounts of ingredients used for the solutions of given molar ratios for LiCoPO4,
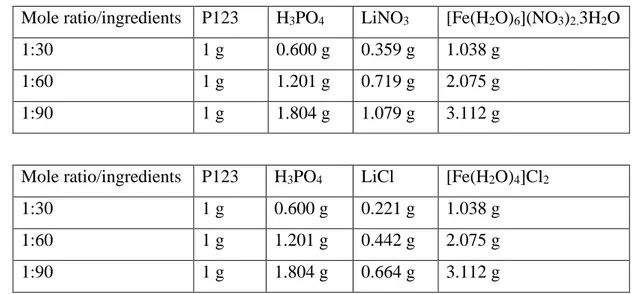
18 For LiFePO4;
Mole ratio/ingredients P123 H3PO4 LiNO3 [Fe(H2O)6](NO3)2.3H2O
1:30 1 g 0.600 g 0.359 g 1.038 g
1:60 1 g 1.201 g 0.719 g 2.075 g
1:90 1 g 1.804 g 1.079 g 3.112 g
Mole ratio/ingredients P123 H3PO4 LiCl [Fe(H2O)4]Cl2
1:30 1 g 0.600 g 0.221 g 1.038 g
1:60 1 g 1.201 g 0.442 g 2.075 g
1:90 1 g 1.804 g 0.664 g 3.112 g
Table 2.2. Amounts of ingredients used for the solutions of given molar ratios for
LiFePO4
2.2.Synthesis of materials 2.2.1. Solution Preparation
Thesolutions were prepared according to mole of acid/P123 in 10 g of water in 20 ml vials. The amounts of salts (LiNO3, LiCl and M(NO3)2 (M=Mn(II), Fe(II), Co(II),
and Ni(II))) were kept the same as the acid amount. In order to minimize the high concentrated acid effect, for each solution two vials were used. First vial was used to dissolve the salts and half of the required surfactant (0.5 g) in 5 ml of water (solution A), whereas the second vial was used to dissolve the acid and the other half of the surfactant in 5 ml water (solution B). To prepare solution A, first the required amount of salt was dissolved in 5 ml water (takes around 2-3 minutes) and then 0.5 g melted surfactant (at around 80 oC) was added and stirred for a night to obtain a homogenous solution. In the second vial, firstly 5 ml water was put and then required amount of acid was added, finally the other portion of the melted surfactant was added and stirred again for one night until solution B became homogenous. These two separate solutions were stirred for about 1 day to dissolve the surfactant completely. These two solutions were mixed after 1 day and stirred for another 1 day until the mixture was a clear and homogeneous solution. If there was any
19
precipitation in the solutions, they were centrifuged and the precipitate was taken before doing any characterization (it was happening for Mn case, explained in the chapter 3).
2.2.2. Preparation of Mesophases and Mesoporous Materials
The following general procedure was employed for all metal systems to prepare gel-like mesophases and mesoporous LMPs.
After obtaining homogeneous solutions, they were spin coated (typically at 1500 rpm for 10 sec) or drop-cast coated on the microscope or quartz slides, FTO or petri dishes by spreading a few drops of the solution for further analysis. Spin coated glass slides can be used for calcination process or characterization directly without waiting some time to get rid of the excess water whereas the drop-cast coating samples need further process to evaporate the excess solvent in the samples on the glass substrate. After dropping few droplets from the solution to the glass substrate, excess solution was poured back to the own vial and the gel like thin solution was spread over the
Salts Surfactant Water Mix Acid Surfactant Water
Ni(II) – Co(II) – Mn(II) – Fe(II)
20
glass to fully cover the glass substrate. Then, it was aged for some time (around 1-2 min) in a vertical position to the bench on a paper towel to obtain homogeneous thick films. These gel-like films were characterized using various techniques (such as ATR-FTIR, XRD, and POM).
The films, drop-cast coated or spin coated, were calcined at different temperatures (mostly 300oC- 500oC) in preheated ovens for 1 hour. The calcined samples were scraped from the glass substrate and used for the characterization using XRD, ATR-FTIR, SEM, TEM, XANES, N2 adsorption-desorption, and ICP-MS techniques.
Calcination
21
2.3.Instrumentation 2.3.1. X-Ray Diffraction
Small angle (1-5o) XRD patterns were recorded by a Rigaku Minifle diffractometer equipped with a CuKα (λ=1.5405 Å) x-rays source, operating at 30 kV/15 mA and a
Scintillator NaI (T1) detector with a Be window for the gels on the glass microscope slides. Diffraction measurements were carried by directly inserting the microscope slides into sample holder position. For the wide angle (10-80o) XRD patterns, Pananalytical Multipurpose x-ray diffractrometer, equipped with a CuKα (λ = 1.5405
Å) x-rays source operating at 45 kV/40 mA was used to record the XRD patterns of the powder samples, collected from any glass substrate after calcination. Samples were packed uniformly on a silicon wafer.
2.3.2. Attenuated Total Reflection Fourier-Transform Infrared (ATR-FTIR) Spectroscopy
The ATR-FTIR spectra were recorded using a Bruker Alpha Platinum ATR-FTIR spectrometer with a Digi Tect TM DLATGS detector with a resolution of 4 cm-1 and 64 scans in 400-4000 cm-1 range. The spectra were measured by putting a few drops of solution for the gel phase or a powder sample on the diamond ATR crystal from calcined samples.
2.3.3. Fourier-Transform Infrared (FTIR) Spectroscopy
A Bruker Tensor 27 model FTIR spectrometer with a Digi Tect TM DLATGS detector with a resolution of 4 cm-1 and 64 scans in 400-4000 cm-1 range was used for recording the FTIR spectra. The powder samples were pressed by mixing with 0.190 g KBr and around 0.01 g of our sample into pallet.
2.3.4. Scanning Electron Microscope (SEM)
The SEM images were recorded using a FEI Quanta 200 FEG at an operating voltage of 15 kV under a high vacuum (about 10-6 Torr). The samples were scraped from the glass substrate and put on a carbon tape which attached to the aluminum stub. Furthermore, EDAX data of the samples were collected using the same samples using same microscope.
2.3.5. Transmittance Electron Microscope (TEM)
For the transmittance electron microscope (TEM) images, a FEI Technai G2 F30 was used at an operating voltage of 200kV. For TEM imaging, spin coated and calcined
22
samples were mostly used. The samples were scraped and grinded well in a mortar using 5 ml of absolute ethanol and dispersed using a sonicator for 30 min. A few drops of the dispersed solution was put on a TEM grid (holey carbon film on 200 mesh cupper grid) and heated under powerful light for drying.
2.3.6. N2-Adsorption-Desorption Measurements
The N2 adsorption-desorption (77.4 K) measurements were carried using
Micrometerics Tristar 3000 automated gas adsorption analyzer in a relative pressure range, P/P0 from 0.01 to 0.99 over 5 min intervals. The powder samples collected by
strapping from the glass substrate were placed to tube sample holders and dehydrated under vacuum until it reaches to 35-40 mTorr for 2 hrs at 200 oC before the N2
adsorption-desorption measurement. Before the measurements, the sample tubes were also cleaned by washing (with aqua-regia, water, and then ethanol, separately) and evacuated using a vacuum pump so that the weight of the sample was accurately determined. The tubes with dehydrated samples were placed to the instrument with an isothermal jacket to keep the temperature stable inside since the measurement was carried at liquid nitrogen temperature.
2.3.7. ICP-MS (Inductively Coupled Plasma-Mass Spectrometry) Measurements
Concentration determination was done by suing an Agilent 7700x ICP-MS (Agilent Technologies Inc., Tokyo, Japan), equipped with an octopole reaction system and a helium collision cell for spectral interference removal. MicroMist glass concentric nebulizer, quartz Scott-type spray chambers (both from Agilent Technologies, Inc.) and Ni sampler/skimmer cones were operated for the operation of ICP-MS. For the short term stability 1 μg/L tuning solution was used to perform daily instrumental optimization. External calibration solutions were prepared by using Agilent ICP-MS Multi-element calibration standard-2A (Li, Na, Mn, Ni, Fe, Co) and 4 (P). To plot the calibration curves, fourteen points of standard solutions of which the concentrations varies between 10 and 0.78125 ppm were recorded. As a preparation of measured solutions, firstly, 7 mg of powder samples were dissolved in concentrated nitric acid (10 ml) and diluted it to 100 ml with deionized water to optimize the concentration in the range of calibration curves.
23
2.3.8. Polarized Optic Microscope (POM)
POM images were collected using a ZEISS Axio Scope A1 polarizing optic microscope with different optic lenses (5X, 10X, 20X and 50X) between crossed polarizers to see the mesophases of gels on the microscope slides, prepared by drop-cast coating or spin coating.
2.3.9. X-Ray Absorption Spectroscopy
The XANES and EXAFS measurement were done at the XAFS/XRF beamline of SESAME (Synchrotron-Light for Experimental Science and Applications in the Middle East, Allan, Jordan). The monochromator was set to each element (Ni, Fe, and Co K-edge) for the corresponding samples and the XANES and EXAFS regions were collected with 0.5 eV and 1 eV resolutions, respectively. For the calibration, Ni, Fe and Co metallic foils were used in transmission mode. Each spectrum was repeated 3 times to amplify the signal to noise ratio.
The further analysis (merging, normalization, etc.) of the collected XANES and EXAFS data was carried by using Athena software.