IDENTIFICATION AND CHARACTERIZATION OF EXONIC
VARIANTS RELATED WITH FAMILIAL ESSENTIAL TREMOR
A THESIS SUBMITTED TO
THE GRADUATE SCHOOL OF ENGINEERING AND SCIENCE OF BILKENT UNIVERSITY
IN PARTIAL FULFILLMENT OF THE REQUIREMENTS FOR THE DEGREE OF
MASTER OF SCIENCE IN
NEUROSCIENCE
By
İSLAM OĞUZ TUNCAY
ii
IDENTIFICATION AND CHARACTERIZATION OF EXONIC VARIANTS RELATED WITH FAMILIAL ESSENTIAL TREMOR
By İslam Oğuz Tuncay, July, 2017
We certify that we have read this thesis and that in our opinion it is fully adequate, in scope and in quality, as a thesis for the degree of Master of Science.
Ayşe Begüm Tekinay (Advisor)
Michelle Marie Adams
Fatma Nazlı Durmaz Çelik
Approved for the Graduate School of Engineering and Science:
Ezhan Karaşan
iii
ABSTRACT
IDENTIFICATION AND CHARACTERIZATION OF EXONIC VARIANTS RELATED WITH FAMILIAL ESSENTIAL TREMOR
İslam Oğuz Tuncay M.Sc. in Neuroscience Advisor: Ayşe Begüm Tekinay
July, 2017
Essential tremor (ET) is the most common movement disorder in humans. Despite its high heritability and frequency, the genetic basis and pathophysiology of ET is not well understood. In this study, whole exome sequencing and pedigree analyses were performed in unrelated ET families from Anatolia. Whole exome sequencing analysis of family members resulted in the identification of MMP19 p.R456Q in families ET-5 and ET-49. Expression analysis in mice showed a possible developmental pattern for expression of MMP-19 as well as a tissue-specific expression pattern showing high levels of expression in the brain for this gene. Two other families, ET-17 and ET-19 were also analyzed; however the results were not able to identify variant cosegregating with ET in these families. Identification of the new genes related with ET will provide invaluable insights into the underlying mechanism of thıs most
common movement disorder and will potentially open new avenues for its treatment.
Keywords: Essential tremor, human genetics, whole exome sequencing, movement
iv
ÖZET
AİLESEL ESANSİYEL TREMOR İLE İLİŞKİLİ EKZONİK VARYANTLARIN BELİRLENMESİ VE KARAKTERİZASYONU
İslam Oğuz Tuncay Nörobilim Yüksek Lisans Tez Danışmanı: Ayşe Begüm Tekinay
Temmuz, 2017
Esansiyel tremor (ET), insanlardaki en yaygın hareket bozukluğudur. Kalıtsallığı ve frekansı oldukça yüksek olmasına rağmen, ET'nin genetik temeli ve patofizyolojisi tam olarak anlaşılamamıştır. Bu çalışmada, Anadolu dört ila beş kuşak boyunca otozomal dominant kalıtım modeline uygun düzende ET vakaları gözlenen Anadolu
kökenli ailelerde tüm ekzom dizileme ve soyağacı analizi gerçekleştirilmiştir. Yapılan analizler sonucu, hastalıkla birlikte nesilde nesle aktarılan, protein seviyesinde zarar verici bir mutasyon belirlendi: ET-5 ve ET-49 ailelerinde MMP19 p.R456Q. Farelerde yapılan ifade analizleri, beyinde yüksek seviyede ekspresyon gösteren dokuya özgü bir ifade şablonunun yanı sıra, MMP19 ifadesi için olası bir gelişimsel düzen gösterdi. İki ayrı aile, ET-17 ve ET-19 da aynı analiz yöntemlerinden geçirildi, ancak bu ailelerde ET ile birlikte aktarılan bir mutasyon belirlenemedi. ET ile ilgili yeni genlerin tanımlanması, en yaygın hareket bozukluğunun altında yatan mekanizma hakkında paha biçilemez bilgiler sağlayacak ve potansiyel olarak tedavisi için yeni yollar açacaktır.
v
Anahtar sözcükler: Esansiyel tremor, insan genetiği, tüm ekzom dizilemesi, hareket
vi
ACKNOWLEDGEMENTS
I would like to start by thanking my advisor Asst. Prof. Dr. Ayşe B. Tekinay for her guidance, motivation and support. I feel lucky to have been able to work with her for the last two years. I would like to thank Prof. Dr. Tayfun Özçelik for his continuous support, his uncanny ability to teach a valuable lesson in every interaction, and sharing his immense knowledge of genetics.
I want to thank Prof. Dr. Cenk Akbostancı and Prof. Dr. Haluk Topaloğlu for the identification and recruitment of patients. I would like to thank Dr. Emre Onat for his help in my experiments and data analysis. I would like to thank Asst. Prof. Dr. Nazlı Durmaz Çelik, Dr. Çağrı Ulukan, Dr. Eda Aslanbaba and Dr. Adem Demir for their help with the clinical assessment of patients. I’d like to thank Dr. Peren Karagin for all her help. I am thankful to all essential tremor patients, relatives and other participants for their cooperation in this study.
I would like to thank Dr. Seher Yaylacı and Merve Şen for their help, support and collaboration that went way beyond a work friendship. I have learned so much from them, and I will forever cherish the memories of us running to meetings and carrying way too many files. I would also like to thank the youngest member of our team, little miss Neva Yaylacı for simply being adorable. I would like to thank Nuray Gündüz for being by my side and helping (and sharing my frustrations) with in situ hybridization for the last couple months. I also would like to thank Melike Sever for her help with the qRT-PCR experiments and her friendship. I would also like to thank our intern Umut Taşdelen for his help with PCR and 3D modelling.
I would like to thank Özge Uysal for being by my side, literally since my first class in college. I would not be able to get through last six years without her friendship and her notes – which were always a joy to read thanks to her impeccable handwriting. I would also like to thank Göksemin Şengül, for her erratic yet strangely calming presence. Both Göksemin and Özge gave me a push whenever I needed one, and I appreciate them greatly. I would like to thank Zeynep Orhan for teaching me how to use bacteria, the finicky little creatures that brought me to the brink of insanity. I would like to thank Fatih Yergöz for giving me competition for how chill one can be. I would like to thank Nurcan Haştar for accompanying me whenever I wanted to sing
vii
a random Turkish pop song, and I would like to thank İdil Uyan for showing me how it actually should be sung. I would like to thank Mustafa Beter for being an amazing desk mate and showing how to discuss passionately. I would like to Canelif Yılmaz for humbling me about my baking skills. I want to thank Çağla Eren for her infectious laughter and joy. I’d like to thank the immunology duo, Şehmus and Burak for their friendship. I want to thank NBT-BML lab members Asst. Prof. Mustafa Özgür Güler, Gökhan Günay, Begüm Dikeçoğlu, Dr. Gülistan Tansık, İbrahim Çelik, Elif Arslan, Dr. Berna Şentürk, Ahmet Emin Topal, Alper Devrim Özkan and Dr. Gözde Uzunallı for all their help, and for creating such a warm working environment.
I have to thank my dearest friend, Salih Aksoy, for putting up with me for 10 years, and always being there for me. I truly don’t know what I would do without him. I’d like to thank Murat Demirbüken for all the late night trips to get waffles. I’d like to thank Muammer Yaman for being the loveliest roommate one could have. I’d like to thank Ömer Fatih Konar for watching movies and laughing with me, even though we both knew we should’ve been studying instead, and being the younger brother I never had. I want to thank Enes Aybar for teaching me basics of American football.
I’d like to thank Alper Duranel for all the buckets of KFC we shared while watching sit-coms, and for being okay with me liking chocolate ice cream over vanilla. I’d like to thank my text-chain friends Ali Fuat Geyik, Buğrahan Şahin, Fatih Yiğit, Mustafa Yılmaz, Muhammed Tanır and Sefa Aydemir for enduring all the memes I have shared. I would also like to thank two of my oldest friends, Göktuğ Kalender and Abdullah Topçuoğlu for always being supportive of me and always being just a phone call away.
I’d like to thank my London trip crew; Dr. Tuğrul Nalbantoğlu for all his insults that are too funny to get mad at, Aykut Argun for all the late night walks in Bilkent, Alper İnecik for letting me watch Modern Family from his cellphone which was definitely too small for the job, and Yasin Kaya for his surprising ability to hit a volleyball with the back of his hand, and our hosts Burak Şimşek, Cihad Öge and Yasin Kadıoğlu for taking Turkish hospitality to a whole new level. What happened in London may stay in London, but our friendship is forever.
viii
I’d like to thank Dr. Bilal Uyar for our shared car rides, along with his support and guidance. I would like to thank my young friends who inspired me not just be a better scientist but a better person as well; Kemal, Emin, Furkan, Alperen, Elif, Selim, Sümeyye, Şevval, Tolga, Alp Eren, Bedriye, Buğra Han and Sinem.
Last but not the least, I want to thank my family; my late father Eyyup, my amazing mom Nesrin for being the strongest person I know, my aunt Ayşe who is like a second mom to me, my older sister Neslihan for always encouraging me to reach for the stars, my younger sister Nurnihan for giving me the idea to pursue a carrier in genetics, and my nephews İhsan, Furkan and Tahir and my niece Zeynep for being the joy of my life. My family always supported me, loved me, and believed in me, and I’m thankful for everything they have done for me.
Thank you,
ix
CONTENTS
Abbreviations ... xiv CHAPTER 1 ... 1 Introduction ... 1 1.1 Essential Tremor ... 11.1.1 Clinical Features and Pathophysiology ... 1
1.1.2 Etiology and Diagnostics ... 2
1.1.3 Genetics of Essential Tremor ... 4
1.2 Identification of Disease-Related Genes ... 7
1.2.1 Linkage and Association Studies ... 7
1.2.2 Sequencing-Based Methods ... 8
CHAPTER 2 ... 11
Material and Methods ... 11
2.1 Subjects ... 11
2.2 Whole Exome Sequencing ... 12
2.3 Bioinformatics ... 12
2.3.1 Initial Analysis of WES Output ... 12
2.3.2 Filtration, Prioritization and Segregation ... 13
2.4 Analysis of Protein Expression and Function ... 14
2.4.1 Quantitative Real Time - PCR ... 14
2.4.2 In situ Hybridization ... 14
x
CHAPTER 3 ... 16
Results and Discussion ... 16
3.1 Variant Search in Family ET-17 ... 16
3.1.1 Clinical Features of ET-17 ... 16
3.1.2 Whole Exome Sequencing... 19
3.1.3 Identification of Candidate Variants ... 23
3.2 Variant Search in Family ET-19 ... 32
3.2.1 Clinical Features of ET-19 ... 32
3.2.2 Whole Exome Sequencing ... 35
3.2.3 Identification of Candidate Variants ... 41
3.3 MMP19 p.R456Q as the Putative Disease Causing Variant in ET-5 and ET-49 ………...47
3.3.1 Identification of MMP19 p.R456Q as the Putative Disease Causing Variant in ET-5 and ET-49 ... 47
3.3.2 Expression Analysis ... 52
CHAPTER 4 ... 55
Conclusion and Future Perspectives ... 55
BIBLIOGRAPHY ... 59
xi
LIST OF FIGURES
Figure 1 Pedigree of ET-17.………....17
Figure 2 Archimedes spiral drawing test results for members of family ET-17…….18
Figure 3 Protein damage prediction for ET-17 variants (1)…………..…….……….21
Figure 4 Protein damage prediction for ET-17 variants (2)…………...…….………22
Figure 5 Pipeline for filtration and prioritization of variants………..24
Figure 6 Pedigree of family ET-17 with genotypes at TLL2 p.T495M………...29
Figure 7 Pedigree of family ET-17 with genotypes at SNCAIP p.R853H…………..30
Figure 8 Pedigree of family ET-17 with genotypes at SRFBP1 p.L31F……….31
Figure 9 Pedigree of ET-19.………33
Figure 10 Archimedes spiral drawing test results for members of family ET-19…...34 Figure 11 DNA density evaluations for ET-19 WES samples………36 Figure 12 Protein damage prediction for ET-19 variants (1)………..39 Figure 13 Protein damage prediction for ET-19 variants (2)………..40 Figure 14 Pedigree of family ET-19 with genotypes at ARHGEF4 p.Gly67Trp (left)
and EPHA8 p.Arg879Gln (right).………44
Figure 15 Pedigree of family ET-19 with genotypes at TMEM230 p.Arg171Cys (left)
xii
Figure 16 Pedigrees of families ET-19 (left) and ET-108 (right) with genotypes at
TCP10L2 p.Arg320*………...…….46
Figure 17 Pedigrees of families ET-5 and ET-49 segregating essential tremor, with genotypes at MMP19 p.R456Q………48
Figure 18 Summary of the alterations in the MMP-19 protein...49
Figure 19 Model 3D protein structure of MMP-19 protein………...……..51
Figure 20 Expression pattern of MMP19………53
xiii
LIST OF TABLES
Table 1 Types of tremor………..…..3
Table 2 Prioritization criteria for protein damage prediction databases………..25
Table 3 List of prioritized variants that were homozygous for the proband of family
ET-17………27
Table 4 List of prioritized variants that were heterozygous for the proband of family
ET-17.………..……….28
Table 5 Purity and concentration measurements for ET-19 DNA samples………….36 Table 6 Statistics of whole exome sequencing results for ET-19 samples…………..37 Table 7 List of prioritized variants that were homozygous for the proband of family
ET-19.………...42
Table 8 List of prioritized variants that were heterozygous for the proband of family ET-19………43
xiv
Abbreviations
BWA Burrows-Wheeler Aligner
ESP Exome Sequencing Project
ET Essential Tremor
ExAC Exome Aggregation Consortium
GERP Genomic Evolutionary Rate Profiling
GWAS Genome-Wide Association Study
HTRA2 High Temperature Requirement protein A2
ISH In Situ Hybridization
MAF Minor Allele Frequency
MMP19 Matrix Metallopeptidase 19
NGS Next Generation Sequencing
PD Parkinson's Disease
RT-PCR Real Time Polymerase Chain Reaction
SAMtools Sequence Alignment/Map Tools
SNP Single Nucleotide Polymorphism
VCF Variant Call File
1
CHAPTER 1
Introduction
1.1 Essential Tremor
1.1.1 Clinical Features and Pathophysiology
Essential Tremor (ET [OMIM 190300]) is a chronic, progressive neurological disease, and with a prevalence of 0.9% in general population it is often regarded as the most common adult movement disorder1. Different tremors are seen as a symptom in a number of neurological and motor conditions (Table 1). ET’s characteristic motor symptom is a 4-12 Hz kinetic tremor of hands and arms observed when performing voluntary movements2. ET patients may develop additional motor symptoms, such as resting tremor, the spreading of tremor to legs, neck, voice and other organs3,4, as well
as a number of non-motor symptoms including mild cognitive deficits, psychiatric impairments (e.g. anxiety, depression), partial loss of hearing and sleeping problems5,6,7. Most prominent problem caused by ET is the result of its effect on the upper limbs, which a staggering 95% of the affected individuals suffer. This effect causes hardship while performing day-to day actions such as holding a pen, drinking, or eating,3,4,8.
Although it is a very common disease, there is no consensus about the pathophysiology of ET, or its classification as a functional or a neurodegenerative disease9. Cerebellar involvement, including dendrite swellings and Purkinje cell heterotopias, has been reported in several clinical, physiological and neuroimaging studies10,11. In addition to pathophysiology, ET shows heterogeneity in terms of its etiology12, age of onset13, clinical features14 and pharmacological response
2
phenotype15,16, supporting the idea that ET might not be a single disease, rather a family of diseases sharing a key feature, kinetic tremor of arms17.
1.1.2 Etiology and Diagnostics
Etiologically, ET can be divided into three subsections. Patients with age of onset above 65 years of age are considered as senile ET. In sporadic ET, patients are defined as fulfilling the consensus criteria when under 65 years old with no family history of the disease. If the patient has another family member diagnosed with non-senile ET, they are categorized under hereditary ET18.
Frequency of ET can increase up to 6.3% and 21.7% among individuals aged ≥60-65 and ≥90, respectively19. ET patients with family history of the disease is in the
30-70% range according to population studies, and twin studies estimates the heritability of ET to be between 45% and 90%20,21. Environmental factors that have been associated with sporadic ET cases include higher blood levels of β-carboline alkaloids
and lead22–24.
Diagnosis of ET is solely dependent on clinical assessment and patient’s medical
history. Subjectivity of this methodology is the main reason why incorrect diagnosis is abnormally common, estimated between 30 to 50%, and a consensus criteria has therefore determined by the Movement Disorder Society (MDS)18.
3 Table 1 Types of tremor.
4
1.1.3 Genetics of Essential Tremor
Despite the prevalence of the disease and evident contribution of hereditary factors, genetic studies on ET are limited. Three genome-wide linkage studies, all performed on either Northern American or Icelandic populations, have been published to date. Genome-wide scan of 75 ET patients from 16 Icelandic families resulted in the identification of first ET locus, ETM1 [OMIM 190300] (then called FET1, for
Familial Essential Tremor locus 1). Combined logarithm of odds (LOD) score for the
proposed model of dominant inheritance was 3.71; however no single family score was above the significance threshold for a monogenic disorder marker to be mapped, as single-family LOD scores were all calculated to be ≤1.2925. Located on 2p22-p25,
the ETM2 [OMIM 602134] locus was identified in a Czech-American family. LOD score was calculated to be 5.92 for the autosomal dominant model of inheritance26. The third genome-wide linkage study for ET was performed on a much larger cohort compared to the previous two, recruiting 325 affected individuals from 7 different families, all from North America. The locus revealed was located on 6p23, and was named ETM3 [OMIM 611456]27. A consistent problem for all three loci is the lack of reproducibility, as various linkage and association studies on different cohorts have failed to show a significant relation between these loci and ET28–34.
Potential disease-causing variants within ETM loci have been the subject of several studies. A study on 30 families of French descent resulted in the identification of
DRD3 p.Ser9Gly variant, located in ETM1, present in 23 of the said families. Studies
on Italian and Asian families, however, didn’t support these findings as results
showed no significant association of the Ser9Gly variant with ET35,36. HS1-BP3 828C→G variant was identified by a systematic screening of an established minimal
5
results27,39. 15 genes have been sequenced and analyzed by Shatunov et al. to find a pathologic variant within ETM3, but none was found27.
Genome-wide association studies resulted in the identification of two genes in relation to ET. LINGO1 was identified as a risk factor on a cohort of American and European families. Identified cosegregating variants of LINGO1 are intronic, but suggested to be potentially disruptive in conjunction with environmental factors40–42. In another study recruiting a European cohort SLC1A2 was identified as a risk factor, but the variants were deemed non-causative by a meta-analysis study43,44.
For the last couple of years, a growing number of studies utilized whole exome sequencing to identify novel variants related to ET. A 2012 study was the first of this trend, identifying FUS/TLS (fused in sarcoma/translated in liposarcoma) c.868C>T nonsense mutation cosegregating with ET in a large French-Canadian kindred45.
Following up, ET cohort screenings revealed M329I and R377W missense variants, further supporting the case for FUS as a ET-related gene46,47. In 2014, our group has identified HTRA2 p.G399S missense mutation in a six-generation consanguineous Turkish kindred cosegregating with both ET and PD48. The genetic correlation between ET and PD was further supported by a 2015 report by Rajput et al which showed that DNAJC13 c.2564A>G, a variant previously identified in PD patients, was present in 2 affected individuals from a 571-patient ET cohort49. Again in 2015, two novel missense variants of TENM4 were identified to be cosegregating with ET in a Spanish family50. In another study featuring a Spanish family, Nav1.4 p.Gly1537Ser located on SCN4A gene was found to be cosegregating with ET. A possible relation between ET and epilepsy was suggested as the mutation affects the ion selectivity of Nav1.4, which is a voltage-gated sodium channel51. Liu et al reported five novel missense variants of four different genes five families with early onset ET; NOS3
6
p.Gly16Ser and p.Pro55Leu, KCNS2 p.Asp379Glu, HAPLN4 p.Gly350Arg and
USP46 p.Ala133Val52. Latest report by Leng et al identifies SCN11A p.Arg225Cys
as a putative genetic contributor toearly-onset familial episodic pain and adult onset hereditary ET in a four-generation Chinese family53.
7
1.2 Identification of Disease-Related Genes
1.2.1 Linkage and Association Studies
Although their popularity has declined especially in the last decade due to the rise of next generation sequencing, mapping-based methods have been –and still are – useful tools for the identification of disease-related genes.
Karyotyping have been useful in identifying several developmental syndromes54, but since chromosomal abnormalities are often de novo cases, this method is not particularly useful in identifying genetic factors behind inherited traits. Morgan’s studies on fruit flies showed the role of linkage in the inheritance of Mendelian traits55. Traits that map closely will be less likely to be subject to recombination, and therefore usually cosegregate within families, therefore recombination studies can be utilized to link traits with encoding genes56. Logarithm of odds (LOD) score is used for the statistical verification of the association between traits and genes57. When it
comes to polygenic traits, however, linkage studies are inefficient58.
Genome wide association studies (GWAS) examine the nonrandom association of common SNPs and disease phenotypes at the population level. Based on the common disease-common variant hypothesis, GWAS studies assume diseases with a high prevalence will be associated with genetic factors that also have a high prevalence59. The International HapMap project was crucial for the development of GWAS, since the genotype data from various populations helped identify variation across genome and determine correlations between common variant, so that phenotype studies in different populations have the proper strategy and don’t result in the collection of
8
Sequencing data for the common SNPs is used to determine linkage disequilibrium (LD), which identifies a lack of random disassociation, similar to chromosomal linkage. Linkage disequilibrium of SNPs can help identify genetic factors related to certain traits via either direct or indirect association. In direct association, the SNP that shows high LD is associated with said trait. In indirect association, the SNP that shows high LD is not the influential SNP, but it is a common SNP that is linked to the influential SNP61. For genotyping, GWAS studies utilize chip-based microarray
technologies, mainly including Illumina (San Diego, CA) or Affymetrix (Santa Clara, CA) products62. The idea GWAS adapted into family studies in the shape of homozygosity mapping, where the common SNP arrays of affected and unaffected family members are used to identify homozygous regions inherited within a family63. Main shortcoming of GWAS is that it’s unsuitable for studying rare conditions, as it is based on utilizing common variants64.
1.2.2 Sequencing-Based Methods
1.2.2.1 Early Methods and Development of Next Generation Sequencing
First method for DNA sequencing was based on chain termination with dideoxy nucleotides. Described by Sanger et al. in 1977, this approach would be the basis for the later developed Sanger sequencing, using fluorescence detection for automated DNA sequence analysis65–67. A major caveat of this method is that it is a relatively slow method if you want to sequence massive sequences such as the human genome, as it can’t sequences longer than ~1000 base pairs.
During the beginning phase of Human Genome Project (HGP), the lack of a high-throughput sequencing method was the biggest obstacle, and the development of shotgun sequencing 1997 was what resolved this problem68. With a
divide-and-9
conquer approach, shotgun sequencing involved creating short fragments of DNA using enzymatic or mechanic methods. These fragments are then cloned into vectors and sequenced individually. The overlapping sequences between fragments are used for the alignment and assembly of the complete sequence69. This parallel sequencing approach would later be the basis of next-generation sequencing (NGS).
NGS uses the same divide-and-conquer approach, but instead of using vectors, fragmented DNA bits are ligated to pre-designated adapters70. This method also has
its caveats, primarily in terms of data management and analysis. Each NGS reaction results in sequence data about millions of short fragments that only partially overlap, therefore developing computational methods that can effectively and accurately create the complete sequence is needed71.
1.2.2.2 Whole Exome Sequencing
The human genome is a massive sequence, containing nearly 3 billion bases. The protein-coding portion of the genome, known as the exome, takes up roughly 1% of the genome. Assuming most of the functional information that we can get from a genomic sequence is within the exome, at least in terms of the proportion of information with respect to the length of the sequence, whole exome sequencing (WES) offers a rapid and cost-effective approach for medical genetics purposes. It also lowers the burden on data analysis as the outcome is smaller amount of sequenced fragments that involve fewer repeats72,73. In WES, similar traditional NGS methods, the DNA samples are broken down to fragments ligated to adapters, but the adapters that are used in this method are specifically designed probes that hybridize only with exonic fragments, thus “capturing” the exome. Then the probes are either bound to magnetic beads and amplified through PCR for enrichment before high-throughput sequencing (solution-based WES) or bound to a high-density microarray
10
and sequenced without the need for enrichment (array-based WES) 74,75. Starting in 2009, familial studies for a wide variety of conditions utilizing WES have been published.
WES approach have proved particularly useful for the identification of novel variants linked with rare conditions76. Variant databases made available via broad-scope exome studies like 1000 Genomes Project, Greater Middle East Variome Project (GME) and National Heart, Lung, and Blood Institute (NHLBI) Exome Sequencing Project (ESP) are used for the exclusion of common variants. Possible functional effects of the variants can be predicted using in silico tools such as SIFT, PolyPhen, CADD and PROVEAN77–80. Main shortcoming of WES is the loss of information
either caused by specific enrichment which eliminates non-exonic sequences that might have important roles in terms of protein expression such as microRNAs, promoters, or the inefficiency of enrichment that may result in the inability of capturing some parts of the exome81.
11
CHAPTER 2
Material and Methods
2.1 Subjects
The study was approved by the institutional ethical review boards for studies with human subjects at Bilkent, Hacettepe and Ankara Universities. All participants signed an informed consent form in concordance with the guidelines of Turkish Ministry of Health. Proband of ET-5 was first evaluated at Hacettepe University Medical School, while other members of the family were followed at Hacettepe University Medical School and Ankara University Medical School. Probands of ET-17, ET-19 and ET-49 were first evaluated at Ankara University Medical School, and the other members of these families were followed at Hacettepe University Medical School and Ankara University Medical School. Assessment of essential tremor is done according to Washington Heights-Inwood Genetic Study of Essential Tremor (WHIGET)82 and Consensus Statement of the Movement Disorder Society on Tremor (MDS)18.
Helsinki Declaration was regarded during all examinations83. Severity of resting and postural tremors for each participant was graded at a scale of 0 to +3: 0 meaning no visible tremor, +1 low amplitude tremor, +2 moderate amplitude tremor and +3 high amplitude tremor. For the evaluation of kinetic tremor, participants were asked to perform four distinct tasks: drawing spirals, pouring water, finger-to-nose movement, and drinking water. Severity of tremor was assessed during each task, again in a scale of 0 to +3. Bradykinesia, muscular rigidity and postural instability assessments were also done according to UK Parkinson Disease Society Brain Bank84, in effort to distinguish between pure ET cases and ET cases with Parkinsonism.
12
2.2 Whole Exome Sequencing
Two affected individuals (II-1 and IV-3) and one control (III-2) from ET-5, four affected individuals (III-2, IV-2, IV-4, V-2 and V-3) and one control (IV-1) from family ET-49, two affected family members (II-4 and IV-3) and one control (IV-1) from ET-19, and three affected individuals (IV-9, V-1 and V-5) from ET-17 were selected for whole exome sequencing. Following kits were used according to manufacturer’s instructions: Nucleospin Blood Kit (Macherey-Nagel), Illumina
TruSeq DNA Sample Prep Kit (Illumina, Inc., San Diego, CA, USA), SeqCap EZ Exome Capture Kit (Roche), QIAquick PCR Purification Kit (Qiagen), for the isolation of DNA from blood, library construction, exome capture and exome cleaning, respectively. ABI system KAPA Illumina Library Quantification Kit was used with RT-PCR to determine the quality and the concentration of the exomes. Illumina HiSeq2500 was used for the sequencing of the libraries, and Illumina Real Time Analysis Software (Illumina, Inc., San Diego, CA, USA) for determining the quality of the sequences.
2.3 Bioinformatics
2.3.1 Initial Analysis of WES Output
Sequence data were first converted to .bcl files, and then using Illumina CASAVA software (Illumina, Inc., San Diego, CA, USA) to FASTQ files. Fragments were aligned to the reference genome (UCSC hg19) using Burrows-Wheeler Aligner (BWA, v0.6.1-r104)85. Sequence Alignment/Map Tools (SAMtools) software package86 was used to remove PCR duplicates. BEDtools87 was used to get sequence depths for exonic regions. Genome Analysis Tool Kit (GATK; v3.0–0-g6bad1c6)88
13
SnpEff (4.2, 2015-12-05)89 and ANNOVAR (2016Feb01)90 were used for the annotation of variants annotated based on position and function.
2.3.2 Filtration, Prioritization and Segregation
First round of filtration was according to the impact annotation, as determined by SnpEff. Variants that were considered as having low impact, including synonymous, start-retained and stop-retained mutations, were excluded as they are not protein-altering. Variants that were considered as having high or moderate impact were further examined. The moderate-impact group included inframe indels, splice region variants and missense variants while the high-impact group included frameshift, splice donor/acceptor and stop gain/loss variants.
To create a shortlist of potentially ET-linked variants for each family, an initial round of filtering was done based on three main criteria: first, the variant would have to be on a protein-coding region; second, the minor allele frequency for the allele recorded in ExAC (Exome Aggregation Consortium), the 1000 Genomes Project (1000genomes.org), the National Heart, Lung, and Blood Institute (NHLBI) Exome Sequencing Project, and our in-house database would have to be below 0.02%; and third, the out of the individuals that went through WES, the variant should be carried by all of the affected.
We used the genotyping data of the ET cohort to exclude variants. We excluded variants that were in homozygous or compound heterozygous form in any of the control samples. Variants were defined and prioritized as potentially damaging if caused a nonsense mutation, or a missense mutation that was predicted to be damaging by at least two in silico prediction tools. Score cut-offs for the prediction tools were ≤2.5 for PROVEAN, ≤0.05 for SIFT, ≥0.453 for Polyphen2 HDIV, ≥0.447
14
for Polyphen2 HVAR, MutationTaster prediction of A (disease causing automatic), D (disease causing), and P (possibly disease causing), >1.94 for MutationAssessor, ≥10 for CADD and ≥3 for GERP 77–80,91–94.
Cosegregation of the variants with ET within the families ET-5, -31 and -49 was performed using the primers listed on Table A1. Primer3Plus95 was used to design the primers. Chromas Lite (Technelysium Pty Ltd) and FinchTV was used for the analysis of sequencing data.
2.4 Analysis of Protein Expression and Function
2.4.1 Quantitative Real Time - PCR
All experimental procedures involving animals were approved by the Animal Ethics Committee of Bilkent University (Protocol # 2013/25). RNA was isolated from C57BL/6 mouse tissues using TRIzol (Invitrogen) according to the manufacturer’s
instructions. Yield and purity of extracted RNA were assessed by Nanodrop 2000 (Thermo Scientific). cDNA synthesis from RNA and qRT-PCR were performed using SuperScript III Platinum SYBR Green One-Step qRT-PCR Kit according to the manufacturer’s instructions. Reaction conditions were briefly as follows: 55 °C for 5
min, 95 °C for 5 min, 40 cycles of 95 °C for 15 s, 58 °C for 30 s, and 40 °C for 1 min, followed by a melting curve analysis to confirm product specificity. For analysis of the expression data, primary gene expression data was normalized by the expression level of GAPDH. A comparative Ct method (Pfaffl Method) was used to analyze the results.
2.4.2 In situ Hybridization
The expression pattern of Mmp19 gene in the mouse brain was analyzed with in situ hybridization as described previously96. All experimental procedures involving
15
animals were approved by the Animal Ethics Committee of Bilkent University (Protocol # 2013/25). Mmp19 gene PCR product was prepared with Q5® High-Fidelity DNA Polymerase from C57BL/6 mouse genomic DNA. PCR products were run in low melting agarose gel and purified with PureLink® Quick Gel Extraction Kit according to the manufacturer’s instructions. The purified PCR products were cloned into zero blunt pCR4-TOPO vectors (Invitrogen) and selected colonies were sequenced. The riboprobes were synthesized by using Digoxigenin (Dig)-labeled NTPs (Roche) with RNA transcription kit (NEB). P7 and adult mouse brains were obtained from C57BL/6 mice, which were housed in a 12-h dark, 12-h light cycle, and fed ad libitum. Adult brain sections were prepared as described97. Twenty-micrometer sagittal sections were taken with a cryostat (Leica). Sections were incubated at 60 °C overnight in hybridization buffer containing 50% formamide, 5X SSC, 5X Denhardt’s
reagent, 50 mg/mL heparin, 500 mg/mL herring sperm DNA, and 250 mg/mL yeast tRNA. Hybridized sections were washed for 90 min with 50% formamide and 2X SSC at 60 °C. Probes were detected with anti-Dig Fab fragments conjugated to alkaline phosphatase and NBT/BCIP substrate mixture96.
2.4.3 Conservation Analysis and 3D Modelling
Sequences for conservation analysis were obtained from NCBI HomoloGene database. Clustal Omega98 was used for the alignment of obtained sequences. Predicted 3D structure models of the proteins were obtained from Swiss Model, Raptor X or Phyre2. Swiss-PdbViewer (DeepView, v4.1) was used for manipulation and analysis of the 3D models99–102.
16
CHAPTER 3
Results and Discussion
3.1 Variant Search in Family ET-17
3.1.1 Clinical Features of ET-17
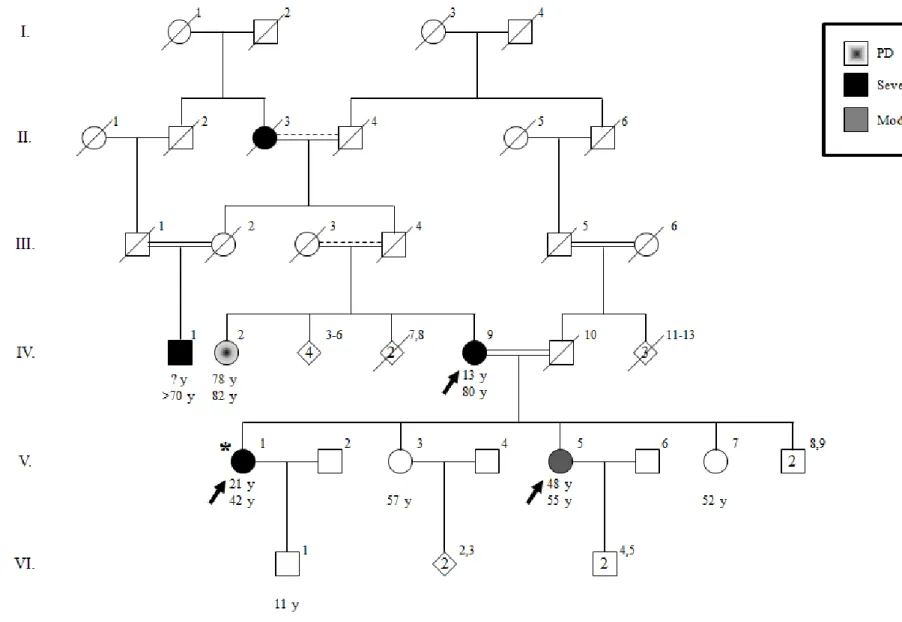
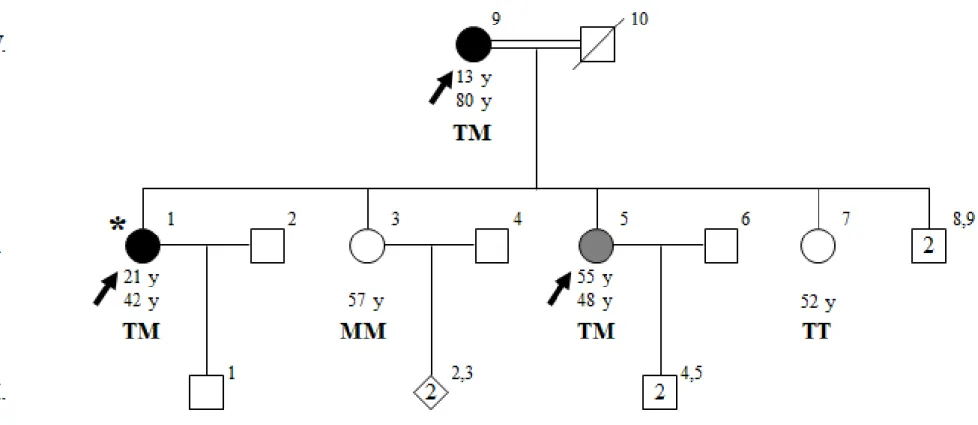
The clinical diagnosis of ET was made initially in the proband (V-1) of a six-generation consanguineous family, ET-17. ET-17 is of Turkish origin and ET is observed multiple generations. 9 individuals from this family were clinically assessed based on criteria of both consensus statement of MDS18 and WHIGET82, and 3 individuals were diagnosed with ET (Figure 1). Archimedes spiral drawing tests are shown in figure 2.
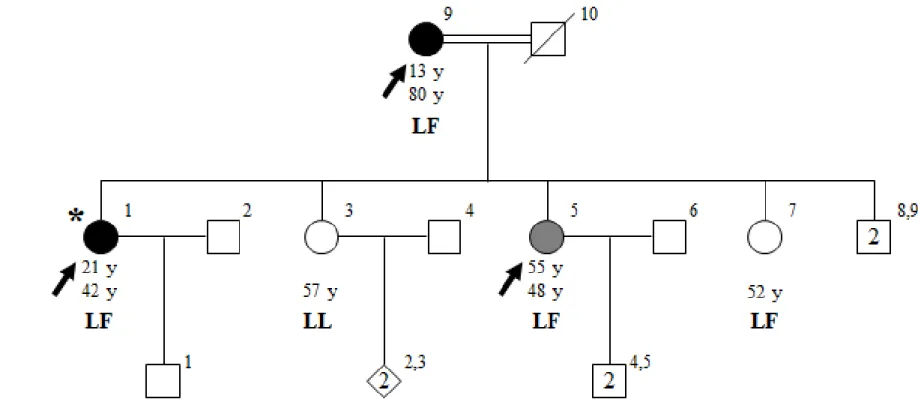
Family ET-17 is from Mardin, located in southeastern Anatolia. Proband of family ET-17 (V-1) was 42 at the time of diagnosis, and her parents declared she has shown symptoms since the age of 21. Detailed clinical assessment of IV-3 showed resting tremor with mild amplitude on both hands, as well as severe kinetic tremor on both hands and moderate action tremor on her neck. She also had mild bradykinesia on her left hand and mild rigidity on her right hand. Other affected individuals were her mother, IV-9 (13, 80) and her sister, V-5 (48, 55), having severe and moderate kinetic tremors, respectively. One of the maternal aunt of the proband, IV-2, is diagnosed with Parkinson’s disease.
17
Figure 1 Pedigree of ET-17. Age at onset of tremor for affected individuals and current ages are indicated in this order under the
18 Figure 2 Archimedes spiral drawing test results for members of family ET-17.
19
3.1.2 Whole Exome Sequencing
Affected family members IV-9, V-1 and V-5 were selected for WES from ET-17. NanoDropTM ND-1000 Spectrophotometer (NanoDrop Technologies, Inc, DE, USA) was used for the purity and concentration measurements. Possible degradation of DNA samples was also checked by running them on agarose gel.
Using Burrows-Wheeler Aligner, WES reads were mapped to the reference genome, UCSC hg19. SAMtools were used to remove duplicate reads. Exonic coverage was calculated with BEDtools.
SnpEff was used for the position and impact annotation of variants, using reference genome UCSC hg19. For the functional annotation, impact of each variant were categorized under either “high”, “moderate”, “modifier” and “low” by SnpEff. Low
impact variants and modifier variants were filtered, leaving high impact variants which includes frameshift variants, splice acceptor/donor variants and stop loss variants, and moderate impact variants which includes inframe indels, missense variants and splice region variants.
SnpEff annotation and subsequent filtering was followed with annotation by ANNOVAR software package. Three types of annotations done by ANNOVAR are (1) gene-based, (2) region-based and (3) filter-based annotation. Gene-based and region-based annotations identify the genes and chromosomal regions which the variants are located on, respectively. Filter-based annotation uses a series of databases to call information about the variant in terms population frequency, dbSNP ID, protein damage prediction and evolutionary conservation. Population frequency data was obtained from Genome Aggregation Database (gnomAD), Exome Aggregation Consortium (ExAC), Exome Sequencing Project (ESP), Kaviar (~Known VARiants)
20
Genomic Variant Database (Kaviar), Greater Middle East Variome Project (GME), Complete Genomics (CG) and 1000 Genomes Project (1000G) databases. Evolutionary conservation scores were obtained from GERP++, phastCons, PhyloP and SiPhy databases.
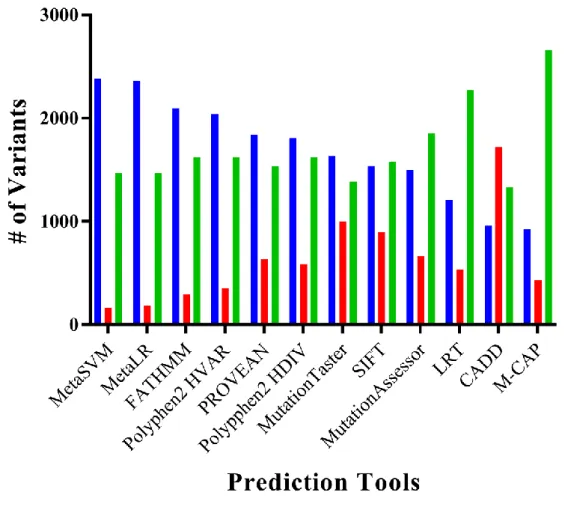
Protein damage prediction data was obtained from SIFT, PolyPhen HDIV, PolyPhen HVAR, MutationAssessor, M-CAP, MutationTaster, LRT, PROVEAN, FATHMM, MetaSVM, MetaLR and CADD databases. MetaSVM showed the highest percentage of predicted benign mutations with 59.36%, while M-CAP showed the lowest value of 23.01%. For the predicted damaging mutations, highest percentage was 42.93%, predicted by CADD, and the lowest was MetaSVM’s 4.09% (Figure 3). 45.5% of the
mutations were predicted to be benign by all 12 databases, while 41.9% were predicted to be damaging by more than 2 databases and 15.5% were predicted to be damaging by at least half of the databases (Figure 4).
21
Figure 3 Protein damage prediction for ET-17 variants (1). This plot shows the number of variants each tool predicted to be benign,
22
Figure 4 Protein damage prediction for ET-17 variants (2). This plot shows how many of the variants were predicted to be damaging or
23
3.1.3 Identification of Candidate Variants
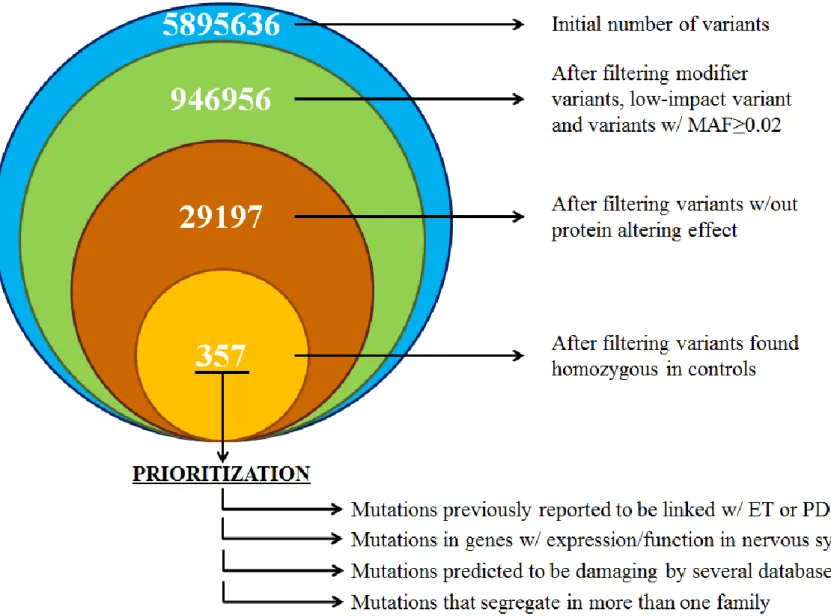
After the annotation process, filtration and prioritization of the variants were implemented in order to get a list of candidate variants for the subsequent segregation analysis (Figure 5).
Total variants count for all the members of ET-17 whose DNA went through WES was 5,895,636. First step of filtration was excluding variants annotated as modifier variants or low-impact variants by SnpEff, which decreased the variant count 1,011,279, almost one-sixth of the starting count. This was followed by the exclusion of variants that were present in the ExAC_ALL cohort with minor allele frequency (MAF) above 0.02. Remaining 946,856 variants filtered according to protein altering affect. In this step, variants that weren’t predicted to be damaging by at least two in
silico tools were excluded, which cut down the number of variants to 29,197. Final
step of filtration was the exclusion variants that were found to be in a homozygous state in control samples, leaving 357 variants (Figure 5).
24
25
For prioritization, several factors were taken into account. Variants effecting sequences that are not protein-coding, such as retained introns, pseudogenes and lincRNA genes, were deprioritized. We also excluded variants using cohort data, eliminating ones that were homozygous in over 20 samples in ExAC cohort and over 10 samples in our 190-sample in-house database. Variants that had MAF≥0.02 in 1000G, ESP, gnomAD, GME, Kaviar or CG datasets were also excluded.
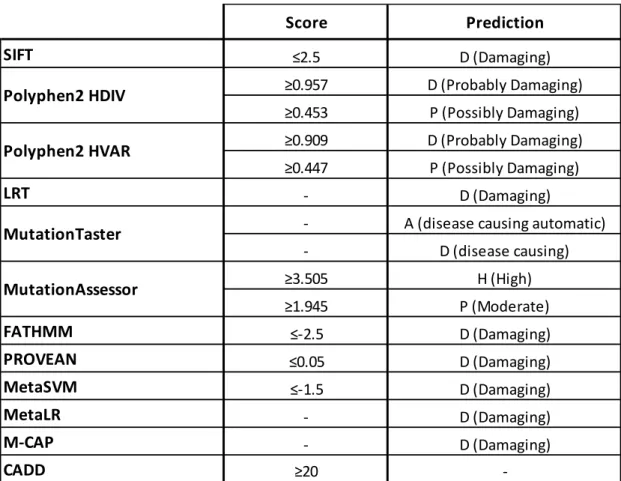
For the protein damage prediction data, a cut-off value was set for each dataset and variants that scored above the cut-off value in more than one databases were prioritized. Variants scoring below the cut-off on all databases were excluded. Cut-off values (or damage predictions) for each dataset are listed in Table 2.
Table 2 Prioritization criteria for protein damage prediction databases.
Score Prediction SIFT ≤2.5 D (Damaging) ≥0.957 D (Probably Damaging) ≥0.453 P (Possibly Damaging) ≥0.909 D (Probably Damaging) ≥0.447 P (Possibly Damaging) LRT - D (Damaging)
- A (disease causing automatic)
- D (disease causing) ≥3.505 H (High) ≥1.945 P (Moderate) FATHMM ≤-2.5 D (Damaging) PROVEAN ≤0.05 D (Damaging) MetaSVM ≤-1.5 D (Damaging) MetaLR - D (Damaging) M-CAP - D (Damaging) CADD ≥20 -MutationTaster Polyphen2 HVAR Polyphen2 HDIV MutationAssessor
26
After all the prioritization steps were completed, we examined the list of variants to find ones that may fit an inheritance model within each family. Variants that were homozygous or compound heterozygous in control samples were excluded, and variants that were shared by all affected individuals in the family were selected. To search for a variant that is possibly inherited in a recessive manner, we listed variants that were homozygous in probands. Tables 3 and 4 summarize the data about said variants.
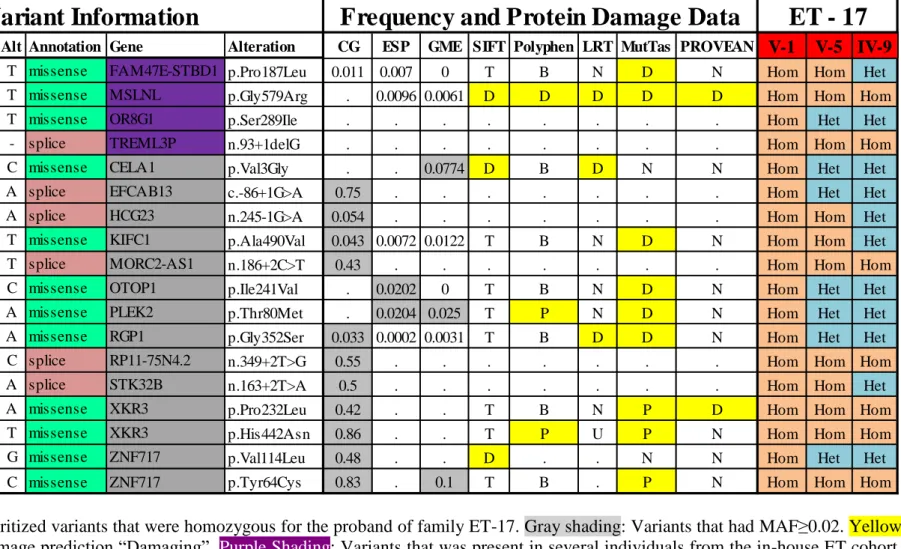
Out of the 21 prioritized variants that were homozygous for the proband, 17 were eliminated as they had MAF≥0.02 in different population frequency databases. The 4
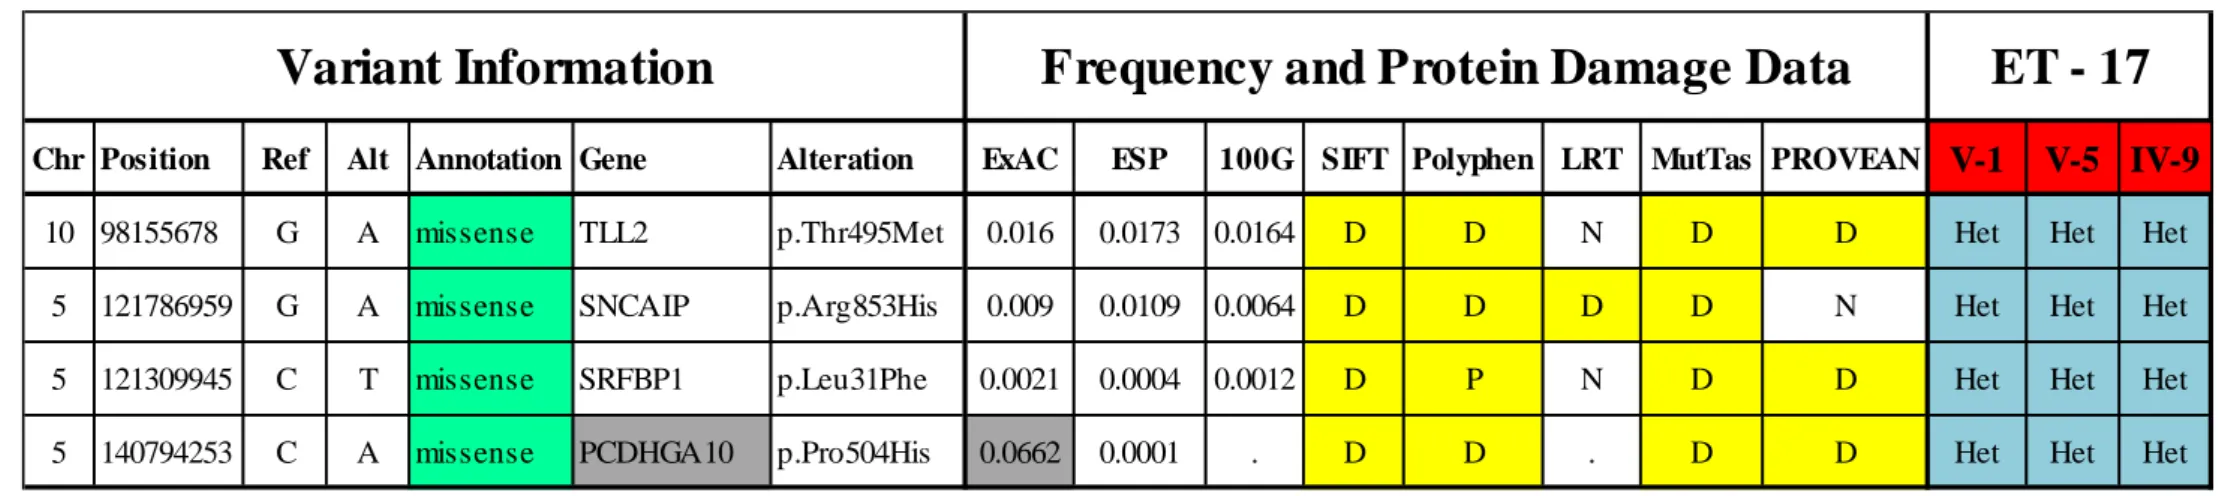
remaining variants, FAM47E-STBD1 p.Pro187Leu, MSLNL p.Gly579Arg, OR8G1 p.Ser289Ile, and TREML3P n.93+1delG, were found to be present in several individuals, affected and unaffected, who were a part of our in-house ET cohort WES database consisting of 52 samples from 15 families (Table 3). As a result, we decided to search for a candidate variant that could fit autosomal dominant inheritance, and checked for variants that were heterozygous for the proband. After the elimination using MAF values and the ET WES database, remaining 3 candidates were TLL2 p.Thr495Met, SNCAIP p.Arg853His, and SRFBP1 p.Leu31Phe (Table 4).
To investigate the cosegregation of the candidate variants with ET in these families, Sanger sequencing and segregation analysis were performed, using primers designed using Primer3Plus (Table A1). Results showed that none of the three candidates cosegregate with ET in this family (Figures 6-8).
27
Table 3 List of prioritized variants that were homozygous for the proband of family ET-17. Gray shading: Variants that had MAF≥0.02. Yellow
shading: Protein damage prediction “Damaging”. Purple Shading: Variants that was present in several individuals from the in-house ET cohort. Hom: Homozygous. Het: Heterozygous. Chr: Chromosome. Pos: Position. Ref: Reference Allele. Alt: Altered Allele. MutTas: MutationTaster.
Chr Position Ref Alt Annotation Gene Alteration CG ESP GME SIFT Polyphen LRT MutTas PROVEAN V-1 V-5 IV-9
4 77184996 C T missense FAM47E-STBD1 p.Pro187Leu 0.011 0.007 0 T B N D N Hom Hom Het 16 824837 C T missense MSLNL p.Gly579Arg . 0.0096 0.0061 D D D D D Hom Hom Hom 11 124121288 G T missense OR8G1 p.Ser289Ile . . . Hom Het Het
6 41190289 C - splice TREML3P n.93+1delG . . . Hom Hom Hom 12 51740415 A C missense CELA1 p.Val3Gly . . 0.0774 D B D N N Hom Het Het 17 45400908 G A splice EFCAB13 c.-86+1G>A 0.75 . . . Hom Het Het 6 32359389 G A splice HCG23 n.245-1G>A 0.054 . . . Hom Hom Het 6 33373341 C T missense KIFC1 p.Ala490Val 0.043 0.0072 0.0122 T B N D N Hom Hom Het 22 31325984 C T splice MORC2-AS1 n.186+2C>T 0.43 . . . Hom Hom Hom
4 4204184 T C missense OTOP1 p.Ile241Val . 0.0202 0 T B N D N Hom Het Het 14 67862269 G A missense PLEK2 p.Thr80Met . 0.0204 0.025 T P N D N Hom Het Het 9 35752124 G A missense RGP1 p.Gly352Ser 0.033 0.0002 0.0031 T B D D N Hom Het Het 18 29136518 A C splice RP11-75N4.2 n.349+2T>G 0.55 . . . Hom Hom Hom
4 5439808 T A splice STK32B n.163+2T>A 0.5 . . . Hom Hom Het 22 17265194 G A missense XKR3 p.Pro232Leu 0.42 . . T B N P D Hom Hom Hom 22 17264565 G T missense XKR3 p.His442Asn 0.86 . . T P U P N Hom Hom Hom 3 75779769 C G missense ZNF717 p.Val114Leu 0.48 . . D . . N N Hom Het Het 3 75790513 T C missense ZNF717 p.Tyr64Cys 0.83 . 0.1 T B . P N Hom Hom Hom
28
Table 4 List of prioritized variants that were heterozygous for the proband of family ET-17. Gray shading: Variants that had MAF≥0.02. Yellow
shading: Protein damage prediction “Damaging”. Het: Heterozygous. WT: Wild Type. Chr: Chromosome. Pos: Position. Ref: Reference Allele. Alt: Altered Allele. MutTas: MutationTaster.
Chr Position Ref Alt Annotation Gene Alteration ExAC ESP 100G SIFT Polyphen LRT MutTas PROVEAN V-1 V-5 IV-9
10 98155678 G A missense TLL2 p.Thr495Met 0.016 0.0173 0.0164 D D N D D Het Het Het
5 121786959 G A missense SNCAIP p.Arg853His 0.009 0.0109 0.0064 D D D D N Het Het Het
5 121309945 C T missense SRFBP1 p.Leu31Phe 0.0021 0.0004 0.0012 D P N D D Het Het Het
5 140794253 C A missense PCDHGA10 p.Pro504His 0.0662 0.0001 . D D . D D Het Het Het
29
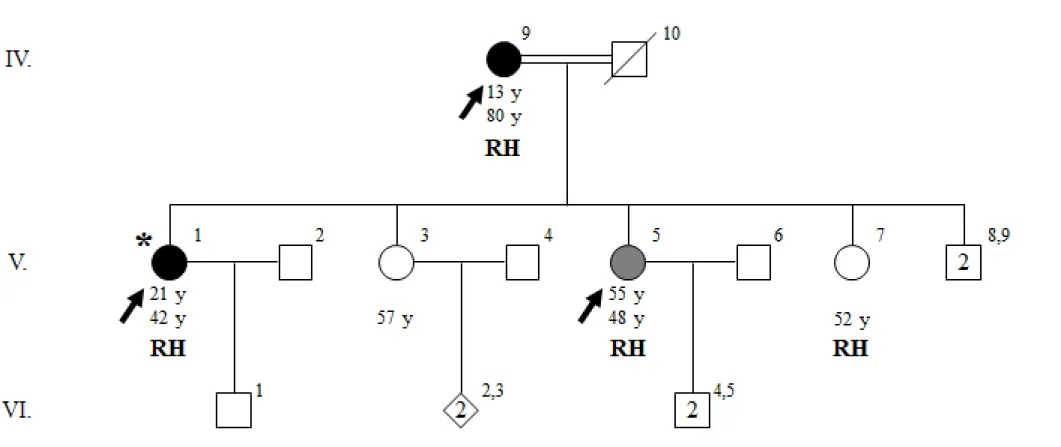
Figure 6 Pedigree of family ET-17 with genotypes at TLL2 p.T495M. Age at onset of tremor for affected individuals, current ages, and
genotypes at TLL2 p.T495M are indicated in this order under the symbols. T indicates the wild-type allele, threonine; M indicates the variant allele, methionine, at TLL2 p.T495M. Individuals who underwent exome sequencing are indicated with arrows. Proband is indicated with an asterisk.
30
Figure 7 Pedigree of family ET-17 with genotypes at SNCAIP p.R853H. Age at onset of tremor for affected individuals, current ages, and
genotypes at SNCAIP p.R853H are indicated in this order under the symbols. R indicates the wild-type allele, arginine; H indicates the variant allele, histidine, at SNCAIP p.R853H. Individuals who underwent exome sequencing are indicated with arrows. Proband is indicated with an asterisk.
31
Figure 8 Pedigree of family ET-17 with genotypes at SRFBP1 p.L31F. Age at onset of tremor for affected individuals, current ages, and
genotypes at SRFBP1 p.L31F are indicated in this order under the symbols. L indicates the wild-type allele, leucine; F indicates the variant allele, phenylalanine, at SRFBP1 p.L31F. Individuals who underwent exome sequencing are indicated with arrows. Proband is indicated with an asterisk.
32
3.2 Variant Search in Family ET-19
3.2.1 Clinical Features of ET-19
The clinical diagnosis of ET was made initially in the proband (IV-3) of a four-generation endogamous family, ET-19. ET-19 is of Turkish origin and ET is observed multiple generations. 9 individuals from this family were clinically assessed based on criteria of both consensus statement of MDS18 and WHIGET82, and 7 individuals were diagnosed with ET (Figure 9). Archimedes spiral drawing tests are shown in figure 10.
Family 19 is from Elazığ, located in east-central Anatolia. Proband of family ET-19 (IV-3) was 25 at the time of diagnosis, and she has shown symptoms since the age of 20. Other affected individuals were her father (III-6) and her paternal grandfather(II-4), both having definite ET, her paternal uncle (III-7) who has moderate ET, and her cousin (IV-4), her half-uncle (III-8) and her half-cousin (IV-5) who have mild ET. The proband also reported that her sister (IV-2) shows tremor symptoms, but this individual didn’t want to participate in the study.
33
Figure 9 Pedigree of ET-19. Age at onset of tremor for affected individuals and current ages are indicated in this order under the symbols.
34
35
3.2.2 Whole Exome Sequencing
Affected family members II-4 and IV-3 along with unaffected IV-1 were selected for WES from ET-19. NanoDropTM ND-1000 Spectrophotometer (NanoDrop Technologies, Inc, DE, USA) was used for the purity and concentration measurements (Table 5). Possible degradation of DNA samples was also checked by running them on agarose gel (Figure 11).
WES resulted in over 49 million reads for each sample. Using Burrows-Wheeler Aligner, ≥99.98% of the reads was mapped to the reference genome, UCSC hg19. SAMtools were used to remove duplicate reads, which consisted ≤1.67% of the total.
Exonic coverage was calculated via using BEDtools. Percentage of exonic regions with at least 5-fold coverage was ≥97.48% for each sample (Table 6).
36
Table 5 Purity and concentration measurements for ET-19 DNA samples.
Figure 11 DNA density evaluations for ET-19 WES samples. After samples were
diluted 1:5 in TE, they were run on 1% agarose gel for 50 minutes under 70 V. BioRad Gel Doc 2000 was used to capture the image. L: NEB 2-Log Ladder.
II-4 (ET-19) 1.92 2.49 255.3 IV-1 (ET-19) 1.91 2.51 325.3 IV-3 (ET-19) 1.88 2.47 195.3 A260/A280 Ratio A260/A230 Ratio DNA Concentration (ng/μL) Measurement DNA Sample
37
Table 6 Statistics of whole exome sequencing results for ET-19 samples.
DNA S ample
Number of Reads
Mapped Reads
Duplicate Reads
Exonic Regions
w/ ≥5x Coverage
II-4 (ET-19)
50913415
50904719
(99.98%)
1.64%
97.72%
IV-1 (ET-19)
54884415
54873761
(99.98%)
1.61%
97.88%
IV-3 (ET-19)
49359617
49352717
(99.99%)
1.57%
97.48%
38
Protein damage prediction data was obtained from SIFT, PolyPhen HDIV, PolyPhen HVAR, MutationAssessor, M-CAP, MutationTaster, LRT, PROVEAN, FATHMM, MetaSVM, MetaLR and CADD databases. MetaSVM showed the highest percentage of predicted benign mutations with 69.35%, while CADD showed the lowest value of 20.76%. For the predicted damaging mutations, highest percentage was 58.51%, predicted by CADD, and the lowest was MetaSVM’s 6.05% (Figure 12). 34.7% of the
mutations were predicted to be benign by all 12 databases, while 50.8% were predicted to be damaging by more than 2 databases and 19.7% were predicted to be damaging by at least half of the databases (Figure 13).
39
Figure 12 Protein damage prediction for ET-19 variants (1). This plot shows the number of variants each tool predicted to be benign, predicted
40
Figure 13 Protein damage prediction for ET-19 variants (2). This plot shows how many of the variants were predicted to be damaging or
41
3.2.3 Identification of Candidate Variants
After filtration and prioritization steps were completed as explained in Section 3.1.3, candidate variant lists were created. Tables 7 and 8 summarize the data about said variants.
Out of the 4 prioritized variants that were homozygous for the proband, 3 were eliminated as they had MAF≥0.02 in different population frequency databases, and
the remaining 1 variant was eliminated due to it being present in several individuals, affected and unaffected, who were a part of our in-house ET cohort WES database (Table 7). As a result, we decided to search for candidate variants that were heterozygous for the proband. After the elimination using MAF values and the ET WES database, remaining 5 candidates were TCP10L2 p.Arg320*, ARHGEF4 p.Gly67Trp, EPHA8 p.Arg879Gln, SPEN p.His3315Gln and TMEM230 p.Arg171Cys (Table 8).
To investigate the cosegregation of the candidate variants with ET in these families, Sanger sequencing and segregation analysis were performed. Results showed 4 of the 5 candidate variants did not cosegregate with the disease in ET-19 (figures 14-15). Only cosegregating variant was TCP10L2 p.Arg320*. To further verify the relation of the variant with ET, a cohort screening for 62 unrelated ET patients were done. Out of these 62 individuals, all of whom the proband of a different family with hereditary ET, two had the TCP10L2 p.Arg320* variant in a heterozygous state, probands of families ET-39 and ET-108. We didn’t have any samples except the proband’s for ET-39, since the family did not want to participate in the study. We performed segregation analysis for ET-108, only to find out the variant did not cosegregate with the disease, thus eliminating it as a candidate (Figure 16).
42
Table 7 List of prioritized variants that were homozygous for the proband of family ET-19. Gray shading: Variants that had MAF≥0.02. Purple Shading: Variants that was present in several individuals from the in-house ET cohort. Yellow shading: Protein damage prediction “Damaging”. Hom: Homozygous. Het: Heterozygous. Chr: Chromosome. Pos: Position. Ref: Reference Allele. Alt: Altered Allele. MutTas: MutationTaster.
Chr Position Ref Alt Annotation Gene Alteration ExAC GME 1000G SIFT Polyphen LRT MutTas PROVEAN IV-3 II-4 IV-1
6 31324207 A C missense HLA-B p.Leu119Arg . . 0.1851 D D U L D Hom Hom Het
19 464140 C G missense ODF3L2 p.Ala192Pro . 0.1638 . D D N L N Hom Hom Het
22 38039746 C T missense SH3BP1 p.Thr190Met 0.0049 0.0237 0.0018 T B N L N Hom Hom Het
16 64497 C T missense WASH4P p.Gly440Arg 0 . . . Hom Hom Het
43
Table 8 List of prioritized variants that were heterozygous for the proband of family ET-19. Gray shading: Variants that had MAF≥0.02. Purple Shading: Variants that was present in several individuals from the in-house ET cohort. Yellow shading: Protein damage prediction “Damaging”. Hom: Homozygous. Het: Heterozygous. WT: Wild Type Chr: Chromosome. Ref: Reference Allele. Alt: Altered Allele. MutTas: MutationTaster.
Chr Position Ref Alt Annotation Gene Alteration ExAC GME 1000G SIFT Polyphen LRT MutTas PROVEAN IV-3 II-4 IV-1
6 167595300 C T stop-gained TCP10L2 p.Arg320* 0.0089 0.017 0.0078 . . . D . Het Hom WT
2 131769466 G T missense ARHGEF4 p.Gly67Trp 0.0006 0.0011 0.0003 D . . N N Het Het WT
1 22927488 G A missense EPHA8 p.Arg879Gln 0.0016 0.011 0.0015 D D D D D Het Het WT
1 16262680 C G missense SPEN p.His3315Gln . . . D D . N N Het Het WT
20 5081478 G A missense TMEM230 p.Arg171Cys 0.003 0.0098 0.0025 D D D D D Het Het WT
19 49622210 C T missense C19orf73 p.Val24Met 0.0058 0.018 0.006 . P . N D Het Het WT
17 39274291 T C missense KRTAP4-11 p.Met93Val 0.02063 0.0001 0.0004 T B . N N Het Het WT
6 151671747 A C missense AKAP12 p.Ser741Arg 0.0057 0.035 0.0051 D B D N D Het Het WT
19 46807262 G A missense HIF3A p.Arg45His 0.0431 0.0001 0.0146 T D N D N Het Het WT
22 30857611 G A missense SEC14L3 p.Ser281Leu 0.0001 0.0002 0.0775 D P D D D Het Het WT
1 16069664 T C missense TMEM82 p.Val104Ala 0.0056 0.082 0.0045 D P N D D Het Hom WT
44
Figure 14 Pedigree of family ET-19 with genotypes at ARHGEF4 p.Gly67Trp (left) and EPHA8 p.Arg879Gln (right). Age at onset of tremor for
affected individuals, current ages, and genotypes are indicated in this order under the symbols. For ARHGEF4 p.Gly67Trp, G indicates the wild-type allele, glycine; W indicates the variant allele, tryptophane. For EPHA8 p.Arg879Gln, R indicates the wild-wild-type allele, arginine; Q indicates the variant allele, glutamine. Individuals who underwent exome sequencing are indicated with arrows. Proband is indicated with an asterisk.
45
Figure 15 Pedigree of family ET-19 with genotypes at TMEM230 p.Arg171Cys (left) and SPEN p.His3315Gln (right). Age at onset of tremor
for affected individuals, current ages, and genotypes are indicated in this order under the symbols. For TMEM230 p.Arg171Cys, R indicates the wild-type allele, arginine; C indicates the variant allele, cysteine. For SPEN p.His3315Gln, H indicates the wild-type allele, histidine; Q indicates the variant allele, glutamine. Individuals who underwent exome sequencing are indicated with arrows. Proband is indicated with an asterisk.
46
Figure 16 Pedigrees of families ET-19 (left) and ET-108 (right) with genotypes at TCP10L2 p.Arg320*. Age at onset of tremor for affected
individuals, current ages, and genotypes are indicated in this order under the symbols. R indicates the wild-type allele, arginine; “―” indicates the nonsense variant. Individuals who underwent exome sequencing are indicated with arrows. Probands are indicated with asterisks.
47
3.3 MMP19 p.R456Q as the Putative Disease Causing
Variant in ET-5 and ET-49
3.3.1 Identification of MMP19 p.R456Q as the Putative Disease
Causing Variant in ET-5 and ET-49
A missense variant, MMP19 p.R456Q, have been previously identified as the putative disease causing variant in two consanguineous and/or endogamous families with ET cases in multiple generations, ET-5 and ET-49 (Figure 17)103.
MMP19 p.R456Q is located at chr12: 56,230,980 (hg19; c.1367G>A), resulting in an
arginine (Arg, R) to glutamine (Gln, Q) substitution at the 456th amino acid residue, coded by of exon 9 of the matrix metalloproteinase-19 (MMP-19, RASI, MMP-18, ENSG00000123342, ENST00000322569) gene in the HX (Hemopexin) superfamily domain (Figure 18b-c). Multiple-sequence alignment of MMP-19 illustrated that the p.R456 residue is conserved in Euteleostomi (Figure 18a), which was also supported by evolutionary conservations scores with a PhastCon score of 0.999 and a GERP++ score of 3.88. Alteration of arginine to glutamine was predicted to be damaging by in
silico analysis tools, Polyphen2 HDIV, Polyphen2 HVAR, MutationTaster,
MutationAssessor and CADD. MAF values showed low frequency in several databases, including ESP (0.0035), 1000G (0.0014), ExAC (0.0037), Kaviar (0.0037), GME (0.0040), PopFreqMax (0.0077) and gnomAD (0.0038). Turkish Peninsula cohort of the GME study also showed a low MAF value with 0.0091. We also genotyped 62 unrelated ET patients, all probands of different families, and none had the MMP19 p.R456Q variant.
48
Figure 17 Pedigrees of families ET-5 and ET-49 segregating essential tremor, with genotypes at MMP19 p.R456Q. Age at onset of tremor for
affected individuals, current ages, and genotypes at MMP19 p.R456Q are indicated in this order under the symbols. R indicates the wild-type allele, arginine; Q indicates the variant allele, glutamine, at MMP19 p.R456Q. Individuals who underwent exome sequencing are indicated with arrows. Probands are indicated with asterisks.
49
Figure 18 Summary of the alterations in the MMP-19 protein (from Şen 2016 with
permission103). a) Sequence homology of MMP-19 protein p.R456 region among
various species. The box indicates the mutant amino acid p.R456. b) Chromosomal location (top) and gene structure (middle) of MMP19. c) The domain structure of the MMP-19 protein, including the signal peptide, the pro-domain and catalytic domain containing zinc ion binding site, hinge region and hemopexin domain (bottom). The p.R456Q missense alteration is in the hemopexin domain.
50
Effect of the variant on the protein structure was examined by constructing a 3D model (Figure 19). Prediction showed an alteration on the electrostatic interactions on the molecular surface of the protein, specifically the forming of a new hydrogen bond between Gln454 and Gln456 residues, latter being the new residue caused by the mutation. Replacement of the positively charged arginine side chain with the polar neutral glutamine side chain seems to open the possibility of hydrogen bonding with other polar side chains.
51
Figure 19 Model 3D protein structure of MMP-19 protein (from Şen 2016 with permission103). (Left) Predicted 3D structure of wildtype
MMP-19 protein. (Right) Predicted 3D structure of mutant MMP-MMP-19 protein. Conversion of p.R456Q results in the formation of a hydrogen bond (arrow) between Gln456 and Gln454.
52
3.3.2 Expression Analysis
In order to analyze mRNA expression levels from multiple C57B16 mouse tissues (brain, eye, kidney, liver, lung, pancreas, spleen and stomach) and brain tissues of animals from different developmental stages (E15, P1, P7, P11, P15, young adult and aged), gene expression profiles were assessed by quantitative RT-PCR. MMP-19 mRNA was most highly expressed in brain which showed statistically significant difference compared to other tissues (Figure 20a). Moderate level MMP-19 expression was also observed in kidney and liver. Compared to brain tissue, eye, lung, pancreas, spleen and stomach showed little expression. MMP-19 expression was further evaluated among brain tissues from different developmental stages. MMP-19 mRNA expression appeared to be developmentally regulated since it was expressed in high amounts at E15, while showing a significant decline at P1, and increased expression until adulthood. Nevertheless, MMP-19 expression declined when the animals reached adulthood and was downregulated in aged animals (Figure 20).
MMP-19 expression pattern within the brain was examined by in situ hybridization. Expression of Mmp19 was observed with anti-sense probe in granular layer of cerebellum and some regions of hippocampus and thalamus of adult mouse brain sections (Figure 21).
53
Figure 20 Expression pattern of MMP19. (a) Gene expression analysis of MMP-19 in different organs of adult C57B16 mouse. The expression
level of MMP-19 was normalized to GAPDH. Values represent mean ± SEM. Statistical analyses were performed by one way ANOVA followed by Bonferroni posttest (**p<0.01 and ***p<0.001 vs. brain). (b) Gene expression analysis of MMP-19 in different developmental stages of C57B16 mouse. Values represent mean ± SEM. Statistical analyses were performed by one way ANOVA followed by post Bonferroni test (*p<0.05, **p<0.01 and ***p<0.001 vs. P1; #p<0.05, ##p<0.01 and ###p<0.001 vs. P7).
54
Figure 21 Expression of Mmp19 in adult mouse brain. (left) In situ hybridization of
adult mouse brain sections revealing increased expression of Mmp19 in granular of cerebellum and some parts of hippocampus (right) No hybridization was observed with the sense probe.