Research Article
Effect of Coronary Slow Flow on Intrinsicoid Deflection of
QRS Complex
Sabri Seyis
Department of Cardiology, Liv Hospital, Istinye University, Istanbul, Turkey
Correspondence should be addressed to Sabri Seyis; [email protected] Received 30 October 2017; Accepted 3 January 2018; Published 1 February 2018 Academic Editor: Julian Bostock
Copyright © 2018 Sabri Seyis. This is an open access article distributed under the Creative Commons Attribution License, which permits unrestricted use, distribution, and reproduction in any medium, provided the original work is properly cited. Coronary slow flow is a rare, clinically important entity observed in acute coronary syndrome. The pathophysiological mechanism is not fully elucidated. We investigated patients with chest pain who had angiographic features consistent with the coronary slow flow. One hundred ten patients were included. Electrocardiography, echocardiography, and angiography results were retrospectively noted. The mean age was 56.4. Fifty-eight were male, and fifty-two were female. The control group consisted of patients with normal angiography. Patients had higher diastolic blood pressure, lower mean ejection fraction, higher average left ventricular end-diastolic diameter, and higher mean left atrial size than the control group (p � 0.009, p � 0.017, p � 0.041, and p < 0.001, resp.). Patients had higher average V1 ID, V6 ID, P wave dispersion, TFC LAD, TFC Cx, TFC RCA, and TFC levels than the control group. A significant linear positive relationship was found between the V1 ID and the TFC LAD, TFC Cx, TFC RCA, and TFC; also between the V6 ID and the TFC LAD, TFC Cx, TFC RCA, and TFC. Angiographic and electrocardiographic features are suggestive and diagnostic for the coronary slow flow syndrome. Although when regarded as a benign condition, coronary slow flow should be diagnosed, followed up, and treated as many of laboratory features suggest ischemic events.
1. Introduction
Coronary slow flow (CSF) is an important clinical entity which may cause precordial pain during rest or exercise, and it is defined as a microvascular disorder characterized by the slow progression of the administered opaque material to the distal vasculature during coronary angiography without the obstruction of the epicardial coronary arteries [1]. It has been reported that CSF is observed in 1% of patients who underwent coronary angiography with a diagnosis of the acute coronary syndrome (ACS) [2]. The underlying mechanism of CSF, its pathophysiologic mechanism, and its clinical significance have not been fully elucidated [1]. Tambe et al. who first described CSF in 1972 suggested that this phe-nomenon might be due to anomalies in the coronary mi-crocirculation [3]. It is clinically different from other coronary microvascular diseases [4]. Microvascular dys-function, endothelial and vasomotor dysdys-function, occlusive diseases of small coronary arteries, and myocardial ischemia
are associated with the impaired coronary blood flow, and they are proposed mechanisms in CSF [5–8].
As demonstrated by all these pathogenetic reasons, it is inevitable that patients with CSF have ischemia and angina pectoris as its clinical manifestation. The presence of is-chemia has been confirmed in 30–80% of these patients by the metabolic processes such as myocardial lactate forma-tion and O2use and by thallium-201 myocardial perfusion
scan (MPS) with exercise electrocardiography (ECG) [8–16]. Although patients with normal coronary arteries and chest pain are generally thought to have a good prognosis, many studies have shown that these normal looking arteries are not innocent since the symptoms continue and patients may be candidates for acute coronary syndrome [13, 17, 18].
The time from the beginning of the QRS complex to the R waves or the peak of the R′ waves in a 12-lead ECG is called R-wave peak time (RWPT) or intrinsicoid deflection (ID) time. This parameter, in fact, reflects the spread of the electrical activity in the heart from the endocardium to the
Volume 2018, Article ID 2451581, 5 pages https://doi.org/10.1155/2018/2451581
epicardium. It is a simple ECG measurement that can be used to facilitate diagnosis and determine prognosis in many different cardiac diseases [19]. It has been shown that ID increases especially in diastolic dysfunction situations where diastolic wall tension increases. Tissue Doppler imaging (TDI) studies have also shown that there is a significant relationship between ID and diastolic dysfunction parameters.
Although there are many studies suggesting that the CSFP disrupts the systolic and diastolic functions, there are also publications claiming the opposite. In this study, we investigated ID, a simple indicator of diastolic dysfunction and electrical activation impairment in particular, in patients with CSF.
2. Methods
2.1. Patient Selection. Patients who were admitted to our
clinic with complaints of chest pain and underwent coronary angiography with appropriate indications are included. One hundred ten patients who had slow coronary flow during angiography were included in the study. Angiography im-ages and ECG were examined retrospectively. The patients’ demographics and echocardiographic findings were recor-ded. And the patients who were found to have normal coronary arteries during angiography were selected for the control group. Patients with permanent pacemaker implan-tation, right and left bundle branch block, atrial fibrillation history, advanced stage pulmonary disease, end-stage heart failure, heart valve disease, and using antiarrhythmic medi-cations were excluded.
2.2. Echocardiographic Evaluation. Echocardiographic
evaluation was performed using a 2-dimensional M-mode cardiovascular ultrasound system (GE-Vingmed Vivid 7 System, Germany). The examination was performed in the standard left lateral decubitus position (LLDP). Parasternal long axis, short axis, and apical four-cavity views were used for measurements. The ejection fraction was calculated using the modified Simpson method. All echocardiography pro-cedures were performed by an experienced cardiologist, and the findings were recorded.
2.3. Electrocardiography. ECGs (Cardiovit AT-102 Plus,
Schiller, Switzerland) were recorded at a standard rate of 25 mm/s and an amplitude of 10 mm/mV. These were routine ECGs recorded before the patients underwent the angiography procedure. All ECGs were scanned at 800 dpi resolution and transferred to the computer. The ID mea-surements in V1 and V6 were performed on the computer by an experienced cardiologist, and the measurement results were averaged. The time from the beginning of the earliest Q or R wave to the peak of the R wave was defined as ID.
P wave duration was measured for all leads. The be-ginning of the P wave was the first upward or downward departure from the baseline for the positive and negative waveforms, respectively. The return to the baseline was accepted at the end of the P wave. The difference between Pmaxand Pmin was defined as P wave dispersion.
2.4. Coronary Angiography and Documentation of the TIMI Frame Count. For all the participants in this study, selective
coronary angiography was performed using standard Jud-kins technique. Coronary arteries were imaged at right and left oblique positions using cranial and caudal angles at a rate of 25 fps by manually injecting an average of 6–8 ml of opaque material for each take. Coronary flow was quantified objectively using the TIMI (thrombolysis in myocardial infarction) frame count (TFC) method as described by Gibson et al. [20, 21]. For the TFC measurement, the mo-ment when the contrast agent touched both sides of the coronary artery and begun to move forward was chosen as the starting point; and as the endpoint, the moment when the contrast agent reached the so-called moustache point was chosen for the left anterior descending (LAD); the moment when the first side branch arises in posterior lateral artery was chosen for the right coronary artery (RCA); and the moment when distal bifurcation of the longest branch was displayed was chosen for the left circumflex artery (Cx). Since LAD lasts longer, the measured value was standardized via dividing by 1.7 [21, 22]. The mean of TFC for each participant was calculated by dividing the sum of the TFCs of LAD (corrected), LCX, and RCA by 3. All participants with a corrected TFC greater than 27 (two standard deviations from the published normal range) in at least one of the three epicardial coronary arteries were accepted as having CSF, while those whose TFC fell within the standard deviation of published normal range were considered as having normal coronary flow [21].
2.5. Statistical Analysis. From the summary of data,
scriptive statistics were tabulated as mean ± standard de-viation for continuous variables. Categorical variables were summarized as number and percentage. The Shapiro–Wilk
test was used in testing the normality distribution of the
numerical variables when n < 50, the Kolmogorov–Smirnov
test was used when n > 50, and the independent samples t-test,
a parametric test, was used in comparisons of two in-dependent groups when there was a normal distribution. The Pearson chi-square test was used in comparisons of differences between categorical variables. Pearson
correla-tion coefficient was used in the evaluacorrela-tion of relacorrela-tionships
between numerical variables when there was a normal distribution. Statistical analyses were performed with the R 3,3,2v Program (open source), and the level of significance in the statistical analyses was p < 0.05.
3. Results
The demographics of the patient and control groups are summarized in Table 1. The patient and control groups were not significantly different in terms of the following char-acteristics: age, gender distribution, BMI, smoking, aspirin use, renin-angiotensin system (RAS) blocker use, beta-blocker use, statin use, heart rate, systolic blood pressure, left ventricular end-systolic diameter (LVESD), in-terventricular septal diameter (IVSD), and left ventricle posterior wall thickness (LVPWT) (p > 0.05).
Diastolic blood pressure was higher in the patient group (75 ± 6.6) than the control group (72.8 ± 5.67) (p � 0.009). The mean ejection fraction (EF) of the control group (62.44 ± 3.08) was found significantly higher than that of the patient group (p � 0.017). The average left ventricular end-diastolic diameter (LVEDD) of the patient group (49.61 ± 3.17) was higher than that of the control group (48.78 ± 2.78) (p � 0.041). The mean left atrial (LA) size of the patient group (36.87 ± 1.52) was higher than that of the control
group (36.03 ± 1.84) (p < 0.001). The average V1 ID of the patient group (45.85 ± 5.72) was significantly higher than that of the control group (27.44 ± 4.38). The average V6 ID of the patient group (65.61 ± 5.86) was significantly higher than that of the control group (38.58 ± 28.89). The average P-wave dispersion (PWD) of the patient group (43.18 ± 7.54) was higher than that of the control group (20.71 ± 3.94). The average TFC LAD of the patient group (42.24 ± 8.6) was higher than that of the control group (16.75 ± 1.16). The av-erage TFC Cx of the patient group (34.97 ± 5.16) was found significantly higher than that of the control group (15.01 ± 0.8). The average TFC RCA of the patient group (31.03 ± 2.86) was higher than that of the control group (14.17 ± 0.81). The average TFC of the patient group (36.04 ± 5.31) was higher than that of the control group (15.28 ± 0.61).
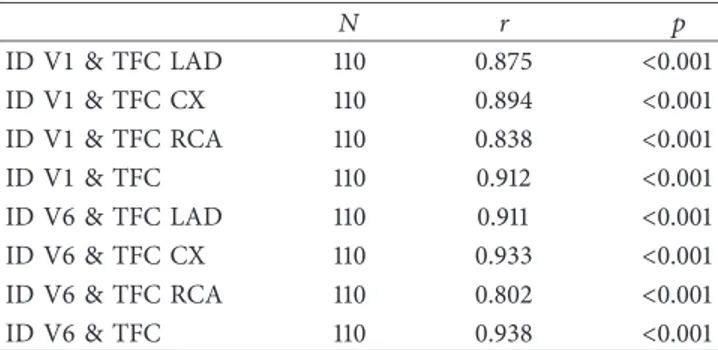
A significant linear positive relationship was found (p < 0.05) between the V1 ID and the TFC LAD, TFC Cx, TFC RCA, and TFC, as shown in Table 2. It appears that V1 ID increases as TFC LAD, TFC Cx, TFC RCA, and TFC increase. Likewise, there was a significant linear positive relationship between the V6 ID and the TFC LAD, TFC Cx, TFC RCA, and TFC (p < 0.05). The V6 ID was found to increase with increases in the TFC LAD, TFC Cx, TFC RCA, and TFC.
4. Discussion
Coronary slow flow phenomenon (CSFP) is not a rare condition. CSF was detected in 7% of the patients who came to clinic with chest pain and underwent angiography due to a suspicion of coronary artery disease [23]. The clinical significance and the underlying pathophysiological mech-anism of CSF have not been fully elucidated. The occlusion of small vessels, increased microvascular resistance, and atherosclerosis are suggested mechanisms. Recently, sig-nificant findings have been published indicating a role for endothelial activation and inflammation [24]. In a study involving endomyocardial biopsy of the left ventricle, vessel wall thickening leading to luminal narrowing, mitochondrial abnormalities, and a decrease in glycogen content were found [25]. In addition, extensive calcification with no lu-minal narrowing, diffuse intimal thickening, and athero-matous plaques on the vascular wall were found at the full length of epicardial coronary arteries in studies of the pa-tients with CSF [26–28]. In another study, flow-mediated dilatation in the brachial artery was found to be impaired in patients with CSF [7]. High concentrations of endothelin 1 and low concentrations of nitric oxide were found in pe-ripheral blood and coronary sinus of the patients with CSF after resting and stress; thus, their endothelial functions were shown to be impaired [9, 29, 30]. In light of these findings, it is not off the mark to say that CSF is associated with is-chemia. Studies with myocardial perfusion scan and cardiac stress test have already shown ischemia in 30–80% of these patients [8–16]. There are publications showing that it may lead to stable angina pectoris and myocardial infarction, and even malignant arrhythmias and sudden deaths. In a study by Sezgin et al., diastolic dysfunction was found in patients with CSF [31].
Table 1: The demographics of the patient and control groups. Group Control Patient p Age1 56.69 ± 6.73 56.35 ± 7.51 0.730 Sex2 Female 47 (43.12) 52 (47.27) 0.537 Male 62 (56.88) 58 (52.73) BMI1 26.6 ± 2.4 26.55 ± 2.87 0.887 Smoking2 No 78 (71.56) 72 (65.45) 0.331 Yes 31 (28.44) 38 (34.55) Aspirin2 No 75 (68.81) 73 (66.36) 0.699 Yes 34 (31.19) 37 (33.64) RAS blocker2 No 56 (51.38) 57 (51.82) 0.948 Yes 53 (48.62) 53 (48.18) Beta blocker2 No 68 (62.39) 69 (62.73) 0.958 Yes 41 (37.61) 41 (37.27) Statin2 No 66 (60.55) 70 (63.64) 0.638 Yes 43 (39.45) 40 (36.36) KKB2 No 84 (77.06) 85 (77.27) 0.971 Yes 25 (22.94) 25 (22.73) Heart rate1 66.96 ± 6.71 67.35 ± 7.21 0.685 Systolic BP1 123.17 ± 6.03 124 ± 6.2 0.314 Diastolic BP1 72.8 ± 5.67 75 ± 6.6 0.009 EF1 62.44 ± 3.08 61.41 ± 3.28 0.017 LVEDD1 48.78 ± 2.78 49.61 ± 3.17 0.041 LVESD1 34.89 ± 2.84 35.5 ± 3.49 0.158 IVSD1 10.64 ± 0.86 10.62 ± 0.94 0.843 LVPWT1 9.69 ± 0.6 9.78 ± 0.75 0.308 LA1 36.03 ± 1.84 36.87 ± 1.52 <0.001 ID V11 27.44 ± 4.38 45.85 ± 5.72 <0.001 ID V61 38.58 ± 28.89 65.61 ± 5.86 <0.001 PWD1 20.71 ± 3.94 43.18 ± 7.54 <0.001 TFC LAD1 16.75 ± 1.16 42.24 ± 8.6 <0.001 TFC Cx1 15.01 ± 0.8 34.97 ± 5.16 <0.001 TFC RCA1 14.17 ± 0.81 31.03 ± 2.86 <0.001 TFC1 15.28 ± 0.61 36.04 ± 5.31 <0.001
In a study by Elsherbiny, impairment in both systolic and diastolic functions was found in patients with CSF [32]. In a study by Baykan et al., systolic and diastolic dysfunction was shown in patients with CSF in the evaluations per-formed with tissue Doppler imaging (TDI), and it was suggested to evaluate them with TDI instead of standard echocardiography [33]. The reason for our inability to detect diastolic dysfunction in the patients with CSF in our study might be the use of echocardiography instead of TDI.
ID measurement is a very simple ECG indicator for detection of diastolic dysfunction. In the study by Boles et al., ID prolongation was detected in the early stages of diastolic dysfunction [34]. It has been proven that the diastolic function was impaired initially in the presence of ischemia [35]. Indeed, it may be said that the changes in electrical activity had begun before the manifestation echocardio-graphic findings. In the study by O’neal et al. that followed up patients over the course of 11 years, it was shown that ID prolongation in people without heart disease is a predictor of heart failure that may develop in the future and that it is more powerful than the QRS duration in predicting the prognosis [36]. Every 10 ms prolongation increases the risk 1.4 fold. Darouian et al. found that there was a relationship between the prolonged ID and sudden cardiac death and that this association was independent of the left ventricular mass [37]. In our study, the ID of the patients with CSF was sig-nificantly prolonged. The average ID measurement was longer in both the V1 and V6 leads of the patient group. Interestingly, the ID measurement in V6 was correlated with the slow flow in LAD and Cx arteries, and the ID mea-surement in V1 was correlated with the slow flow in RCA. This result may be due to the fact that V1 represents mainly the right ventricle, and the right ventricle is often nourished by RCA.
In addition, we found that the more the degree of slow flow, or in other words the higher the TFC is present, the higher the ID is found. This suggests that the risk of de-veloping heart failure in the future is higher as the degree of CSF is higher in patients.
It has been shown that autonomic cardiac function is impaired and sympathetic activity is increased in coronary artery disease [38]. Some authors view CSF as a subgroup of syndrome X. From this point of view, impaired autonomic functions may be thought to prolong the duration of ven-tricular activation.
5. Conclusions
Conclusively, CSF actually contains subclinical findings as shown in our study although it was thought to be a benign phenomenon by many clinicians. In addition to being a practical method for early detection, the prognostic im-portance of ID prolongation is recently being more em-phasized. Therefore, patients with ID prolongation and CSF should be followed closely and further follow-up is needed in terms of treatment.
Conflicts of Interest
The authors declare that they have no conflicts of interest.
References
[1] S. Xia, S. B. Deng, Y. Wang et al., “Clinical analysis of the risk factors of slow coronary flow,” Heart Vessels, vol. 26, no. 5, pp. 480–486, 2011.
[2] S. Singh, S. S. Kothari, and V. K. Bahl, “Coronary slow phenomenon: an angiographic curiosity,” Indian Heart
Journal, vol. 56, no. 6, pp. 613–617, 2004.
[3] A. A. Tambe, M. A. Demany, H. A. Zimmerman, and E. Mascarenhas, “Anjina pectoris and the slow flow velocity of dye in coronary arteries–a new angiographic finding,”
American Heart Journal, vol. 84, no. 1, pp. 66–71, 1972.
[4] M. C. Leone, T. Gori, and M. Fineschi, “The coronary slow flow phenomenon: a new cardiac “Y” syndrome?,” Clinical
Hemorheology and Microcirculation, vol. 39, no. 1–4,
pp. 185–190, 2008.
[5] M. Mosseri, R. Yarom, M. S. Gotsman, and Y. Hasin, “His-tologic evidence for small-vessel coronary artery disease in patients with angina pectoris and patent large coronary ar-teries,” Circulation, vol. 74, no. 5, pp. 964–972, 1986. [6] H. Tanriverdi, H. Evrengul, O. Kuru et al., “Cigarette smoking
induced oxidative stress may impair endothelial function and coronary blood flow in angiographically normal coronary arteries,” Circulation Journal, vol. 70, no. 5, pp. 593–599, 2006. [7] A. T. Sezgin, A. Sigirci, I. Barutcu et al., “Vascular endothelial function in patients with the slow coronary flow,” Coronary
Artery Disease, vol. 14, no. 2, pp. 155–161, 2003.
[8] B. Yaymaci, S. Dagdelen, N. Bozbuga et al., “The response of the myocardial metabolism to atrial pacing in patients with the coronary slow flow,” International Journal of Cardiology, vol. 78, no. 2, pp. 151–156, 2001.
[9] A. Camsari, H. Pekdemir, D. Cicek et al., “Endothelin-1 and nitric oxide concentrations and their response to exercise in patients with slow coronary flow,” Circulation Journal, vol. 67, no. 12, pp. 1022–1028, 2003.
[10] J. F. Beltrame, S. B. Limaye, R. D. Wuttke, and J. D. Horowitz, “Coronary hemodynamic and metabolic studies of coronary slow flow phenomenon,” American Heart Journal, vol. 146, no. 1, pp. 84–90, 2003.
[11] M. Ugur, Yavas¸ Koroner Akım Fenomeni ˙Ile Antiaterojenik
Etkili Adipokin Olan Adiponektin Arasındaki ˙Ilis¸ki, Ph.D.
thesis, Dr. Siyami Ersek Göğüs, Kalp ve Damar Cerrahisi Eğitim ve Araştırma Hastanesi, Kardiyoloji Kliniği, Istanbul, Turkey, 2009.
[12] M. Turkmen, I. Barutcu, A. M. Esen et al., “Comparison of exercise QRS amplitude changes in patients with slow cor-onary flow versus significant corcor-onary stenosis,” Japanese
Heart Journal, vol. 45, no. 3, pp. 419–428, 2004.
Table 2: Relationships between the parameters.
N r p ID V1 & TFC LAD 110 0.875 <0.001 ID V1 & TFC CX 110 0.894 <0.001 ID V1 & TFC RCA 110 0.838 <0.001 ID V1 & TFC 110 0.912 <0.001 ID V6 & TFC LAD 110 0.911 <0.001 ID V6 & TFC CX 110 0.933 <0.001 ID V6 & TFC RCA 110 0.802 <0.001 ID V6 & TFC 110 0.938 <0.001
[13] J. F. Beltrame, S. B. Limaye, and J. D. Horowitz, “The coronary slow flow phenomenon–a new coronary microvascular dis-order,” Cardiology, vol. 97, no. 4, pp. 197–202, 2002. [14] I. Barutcu, A. T. Sezgin, H. Gullu, and A. M. Esen, “Slow coronary
flow phenomenon associated with exercise-induced myocardial ischemia,” Turkish Journal of Thoracic and Cardiovascular
Surgery, vol. 13, no. 3, pp. 295–297, 2005.
[15] L. A. Cesar, J. A. Ramires, C. V. Serrana Junior et al., “Slow coronary runoff in patient with angina pectoris: clinical significance and thallium-201 scintigraphic study,” Brazilian
Journal of Medical and Biological Research, vol. 29, no. 5,
pp. 605–613, 1996.
[16] M. O. Demirkol, B. Yaymaci, and B. Mutlu, “Dypridamole myocardial perfusion single photon emission computed to-mography in patient with slow coronary flow,” Coronary
Artery Disease, vol. 13, no. 4, pp. 223–229, 2002.
[17] J. Chembers and C. Bass, “Chest pain with normal coronary anatomy: a review of natural history and possible etiological factors,” Progress in Cardiovascular Diseases, vol. 33, no. 3, pp. 161–184, 1990.
[18] W. Voelker, U. Euchner, H. Dittmann, and K. R. Karsch, “Long-term clinical course of patients with anjina and angiographically normal coronary arteries,” Clinical Cardiology, vol. 14, no. 4, pp. 307–311, 1991.
[19] R. A. R. Perez, L. C. de Abreu, B. R. Barbarosa, K. C. Nikus, and A. Baranchuk, “R-peak time: an electrocardiographic parameter with multiple clinical applications,” Annals of
Noninvasive Electrocardiology, vol. 21, no. 1, pp. 10–19, 2016.
[20] C. Luo, L. Wang, C. Feng et al., “Predictive value of coronary blood flow for future cardiovascular events in patients with atrial fibrillation,” International Journal of Cardiology, vol. 177, no. 2, pp. 545–547, 2014.
[21] C. M. Gibson, C. P. Cannon, W. L. Daley et al., “TIMI frame count: a quantitative method of assessing coronary artery flow,” Circulation, vol. 93, no. 5, pp. 879–888, 1996. [22] C. Luo, X. Wu, Z. Huang et al., “Documentation of impaired
coronary blood flow by TIMI frame count method in patients with atrial fibrillation,” International Journal of Cardiology, vol. 167, no. 4, pp. 1176–1180, 2013.
[23] V. Oktay and A. Arat ¨Ozkan, “Coronary slow flow,” Turk
Kardiyoloji Dernegi Arsivi-Archives of the Turkish Society of Cardiology, vol. 44, no. 3, pp. 193–195, 2016.
[24] H. Turhan, G. S. Saydam, A. R. Erbay et al., “Increased plasma soluble adhesion molecules; ICAM-1, VCAM-1, and E-selectin levels in patients with slow coronary flow,” International
Journal of Cardiology, vol. 108, no. 2, pp. 224–230, 2006.
[25] E. Mangieri, G. Machiarelli, M. Ciavolella et al., “Slow cor-onary flow: clinical and histopathological features in patients with otherwise normal epicardial coronary arteries,”
Cathe-terization and Cardiovascular Diagnosis, vol. 37, no. 4,
pp. 375–381, 1996.
[26] S. Dagdelen, B. Yaymaci, A. Izgi et al., “Assessment of the relationship of slow coronary flow and myocardial ischemia by using TIMI frame count and intracoronary ultrasound,”
Turk Kardiyoloji Dernegi Arsivi-Archives of the Turkish Society of Cardiology, vol. 28, no. 12, pp. 747–751, 2000.
[27] H. Pekdemir, V. G. Cin, D. Cicek et al., “Slow coronary flow may be a sign of diffuse atherosclerosis, contribution of FFR and IVUS,” Acta Cardiologica, vol. 59, no. 2, pp. 127–133, 2004. [28] V. G. Cin, H. Pekdemir, A. Camsari et al., “Diffuse intimal thickening of coronary arteries in slow coronary flow,”
Jap-anese Heart Journal, vol. 44, no. 6, pp. 907–919, 2003.
[29] H. Pekdemir, D. Cicek, A. Camsari et al., “The relationship between plasma endothelin- 1, nitric oxide levels, and heart
rate variability in patients with coronary slow flow,” Annals of
Noninvasive Electrocardiology, vol. 9, no. 1, pp. 24–33, 2004.
[30] H. Pekdemir, G. Polat, V. G. Cin et al., “Elevated plasma endothelin-1 levels in coronary sinus during rapid rate atrial pacing in patients with slow coronary flow,” International
Journal of Cardiology, vol. 97, no. 1, pp. 35–41, 2004.
[31] A. T. Sezgin, E. Topal, I. Barutçu et al., “Impaired left ventricle filling in slow coronary flow phenomenon: an echo-Doppler study,” Angiology, vol. 56, no. 4, pp. 397–401, 2005. [32] I. A. Elsherbiny, “Left ventricular function and exercise capacity
in patients with the slow coronary flow,” Echocardiography, vol. 29, no. 2, pp. 158–164, 2012.
[33] M. Baykan, E. C. Baykan, S. Turan et al., “Assessment of left ventricular function and Tei index by tissue Doppler imaging in patients with slow coronary flow,” Echocardiography, vol. 26, no. 10, pp. 1167–1172, 2009.
[34] U. Boles, I. Almuntaser, and A. Brown, “Ventricular activa-tion time as a marker for diastolic dysfuncactiva-tion in early hy-pertension,” American Journal of Hypertension, vol. 23, no. 7, pp. 781–785, 2010.
[35] A. J. Labovitz, M. K. Lewen, M. Kern et al., “Evaluation of left ventricular systolic and diastolic dysfunction during transient myocardial ischemia produced by angioplasty,” Journal of the
American College of Cardiology, vol. 10, no. 4, pp. 748–755,
1987.
[36] W. T. O’Neal, W. Qureshi, S. Navarian et al., “Electrocar-diographic time to intrinsicoid deflection and heart failure: the Multi-Ethnic Study of Atherosclerosis,” Clinical Cardiology, vol. 39, no. 9, 2016.
[37] N. Darouian, K. Narayanan, A. L. Aro et al., “Delayed intrinsicoid deflection of the QRS complex is associated with sudden cardiac arrest,” Heart Rhythm, vol. 13, no. 4, pp. 927–932, 2016.
[38] J. Hayano, Y. Sakakibara, A. Yamada et al., “Decreased magnitude of heart rate spectral components in coronary artery disease. Its relation to angiographic severity,” Circulation, vol. 81, no. 4, pp. 1217–1224, 1990.
Stem Cells
International
Hindawi www.hindawi.com Volume 2018 Hindawi www.hindawi.com Volume 2018 INFLAMMATIONEndocrinology
International Journal ofHindawi www.hindawi.com Volume 2018 Hindawi www.hindawi.com Volume 2018
Disease Markers
Hindawi www.hindawi.com Volume 2018 BioMed Research InternationalOncology
Journal of Hindawi www.hindawi.com Volume 2013 Hindawi www.hindawi.com Volume 2018Oxidative Medicine and Cellular Longevity
Hindawi
www.hindawi.com Volume 2018
PPAR Research
Hindawi Publishing Corporation
http://www.hindawi.com Volume 2013 Hindawi www.hindawi.com
The Scientific
World Journal
Volume 2018 Immunology Research Hindawi www.hindawi.com Volume 2018 Journal ofObesity
Journal of Hindawi www.hindawi.com Volume 2018 Hindawi www.hindawi.com Volume 2018 Computational and Mathematical Methods in Medicine Hindawi www.hindawi.com Volume 2018Behavioural
Neurology
Ophthalmology
Journal of Hindawi www.hindawi.com Volume 2018Diabetes Research
Journal ofHindawi
www.hindawi.com Volume 2018
Hindawi
www.hindawi.com Volume 2018 Research and Treatment
AIDS
Hindawi
www.hindawi.com Volume 2018
Gastroenterology Research and Practice
Hindawi www.hindawi.com Volume 2018