CANKAYA UNIVERSITY
GRADUATE SCHOOL OF SOCIAL SCIENCES DEPARTMENT OF ECONOMICS
MASTER’S THESIS
MONEY SUPPLY, INFLATION AND ECONOMIC GROWTH IN LIBYA
AHMED IHMID OMAR KROUSO FEBRUARY 2018
ABSTRACT
MONEY SUPPLY, INFLATION AND ECONOMIC GROWTH IN LIBYA AHMED IHMID OMAR KROUSO
M.Sc. Financial Economics Supervisor: Prof. Dr. Mehmet YAZICI Co- supervisor: Assoc. Prof. Dr. Dilek TEMIZ
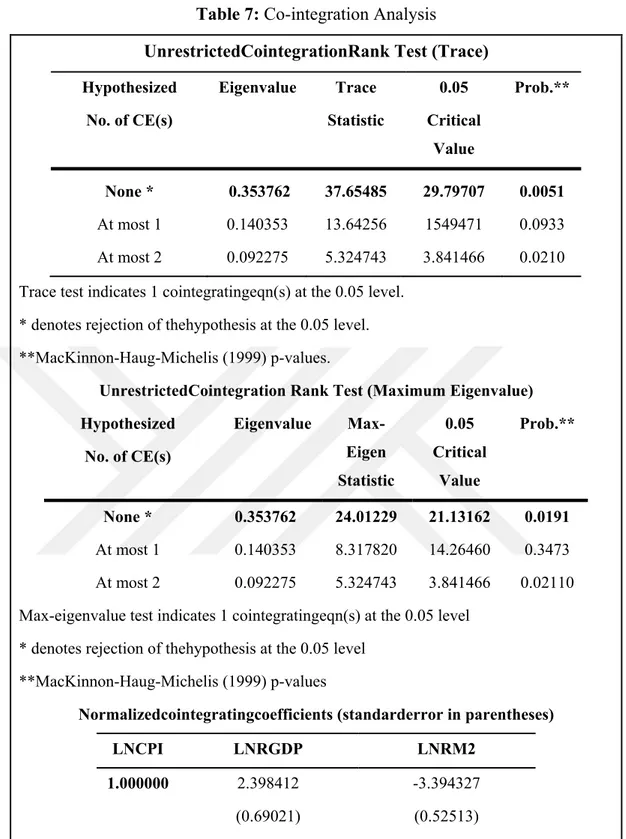
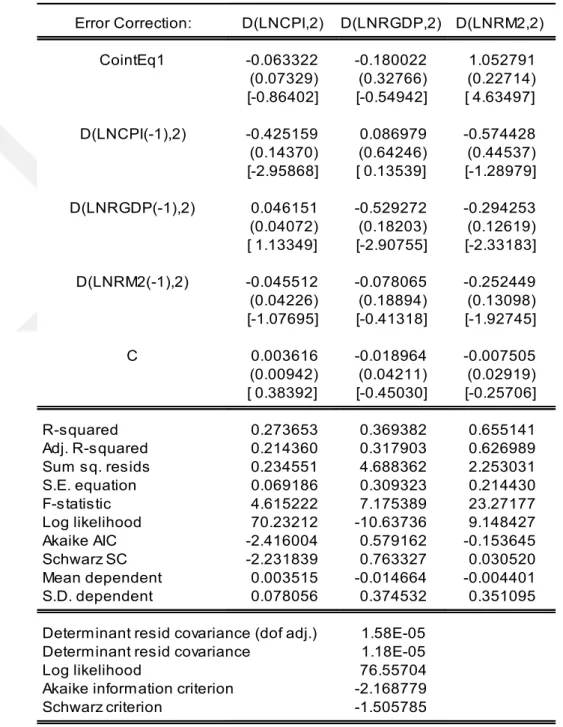
The aim of this study is to exam the relationship between money supply, inflation and economic growth in Libya. Vector Auto-regression Model, Johansen co-integration test and Granger causality were used in the analysis for the sample period 1960-2016. The results shown that all the variables are co-integrated in long term. Furthermore, the increase in economic growth by 1% decreases Inflation by 1.55%. While the growth in money supply by 1 percent will increase the price level by 1.15 %. According to the results of causality test, there is no causality direction in short run between the study variables except unidirectional causality among economic growth and money supply running from RGDP to RM2 according to 5% significance level. In addition, the response of inflation on the economic growth is negative all throughout the ten periods, also the same applies to money supply and economic growth. Also besides, economic growth had an early and positive impact on money supply.
Key words:Money supply, Inflation, Economic Growth, Co-integration, Libya
ÖZET
PARA ARZI, ENFLASYON VE EKONOMİK BÜYÜME: LİBYA ÖRNEĞİ AHMED IHMID OMAR KROUSO
Finansal Ekonomi Yüksek Lisans Programı (M.Sc.) Danışman: Prof. Dr. Mehmet Yazıcı
Eş-Danışman: Doç. Dr. Dilek Temiz
Bu çalışmanın amacı Libya için enflasyon, para arzı ve ekonomik büyüme arasındaki ilişkiyi incelemektir. Analiz 1960-2016 dönemi yıllık verileri ile Vektör Otoregresyon modeli, Johanson Eşbütünleşme Testi ve Granger nedensellik methodu kullanılarak yapılmıştır. Değişkenler arasında eşbütünleşme belirlenmiş ve buna göre %1 ekonomik büyüme enflasyonu %1.55 düşürmekte, diğer taraftan %1 para arzında artış enflasyonu %1.15 artırmaktadır. Nedensellik testi sonuçlarına göre, milli gelirden para arzı yönünde nedensellik dışında, model değşkenleri arasında kısa dönemde bir nedensellik ilişkisine rastlanmamıştır. Ek olarak, enflasyonun ekonomik büyümeye tepkisi on dönem boyunca negatiftir ve ekonomik büyümenin ilk dönemlerde para arzı üzerinde pozitif bir etkisi bulunmaktadır.
ACKNOWLEDGEMENTS
I would like to express my deepest gratitude to my supervisor, Prof. Dr. Mehmet Yazici, who has provided full support and guidance with patience. He kept his eye on the progress of my work and was available for help whenever I needed it during the course of my study. His door was always open for me.
Appreciation is also extended to my co- supervisor, Assoc. Prof. Dr. Dilek TEMIZ, for her valuable comments and critical advice during the writing of my thesis, and for her immense help in planning and executing the work especially with the econometric aspects of this thesis on time.
I would like to express my greatest appreciation to The Republic of Turkey, and its wonderful people for their hospitality.
I would like to share this moment of happiness with my father, mother, brothers and other family members.
I express gratitude from deep in my heart to my wife for her inspiration. She made the real sacrifices when I was busy writing my thesis. Also to my little children, Fatma and Mohamed, who inspire me whenever I see them.
I would also like to thank all my friends and colleagues who supported me directly and indirectly. They were very patient in listening to my various arguments and provided valuable suggestions.
Finally, my thanks go to my friends who are from different nationalities, for their belief in me: always saying, ‘You will do it’.
TABLE OF CONTENTS
STATEMENT OF NON-PLAGIARISM ... iii
ABSTRACT ... iv
ÖZET ... v
ACKNOWLEDGEMENTS ... vi
TABLE OF CONTENTS ... vii
TABLE OF FIGURE ... ix TABLE OF TABLES ... x LIST OF ABBREVIATIONS ... xi INTRODUCTION ... 1 CHAPTER I ... 3 THEORETICAL FRAMEWORK ... 3 1.1 Classical Theory ... 3 1.2 Keynesian Theory ... 4
1.3 The Quantity Theory of Money ... 5
1.4 Neo-Classical and Endogenous Growth Theories ... 6
1.5 Demand-pull & Cost-push Theory ... 7
1.6 Phillips Curve ... 8
CHAPTER II ... 10
LITERATURE REVIEW ... 10
CHAPTER III ... 20
OVERVIEW OF THE LIBYAN ECONOMY ... 20
3.1 Background ... 20
3.2 Money Supply ... 24
3.3 Inflation in Libya ... 26
3.4 Economic Growth ... 28
CHAPTER IV ... 31
4.1 Data ... 31
4.2 Methodof Analysis ... 31
4.2.1 Specification of the Model ... 32
4.2.2 The Vector Auto-Regression Model (VAR) ... 32
4.2.3 Unit Root Test ... 34
4.2.3.1 Augmented Dickey-Fuller (ADF) Test and Philips Perron (PP) Test... 34
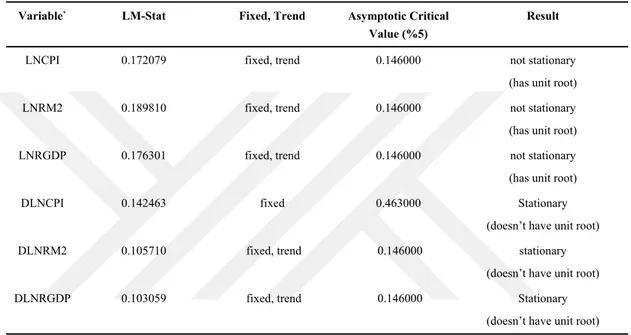
4.2.3.2 The KPSS ... 35
4.2.4 Determination of LagLength ... 36
4.2.5 Diagnostic Tests ... 36
4.2.6 Co-Integration Test ... 36
4.2.7 Error Correction Model Test (ECM) ... 37
4.2.8 Pair-wise Granger Causality Tests ... 37
4.2.9 Impulse Response Analysis (IRF) ... 38
CHAPTER V ... 39
EMPIRICAL RESULTS ... 39
5.1 Empirical Model (1960-2016) Without Dummy ... 39
5.2 Empirical Model (1960-2016) With Dummy "1970 & 1986" * ... 53
5.3 Empirical Model (1960-2010) with dummy "1970&1986" ... 55
CHAPTER VI ... 68
CONCLUSION AND RECOMMENDATIONS ... 68
REFERENCES ... 72
APPENDIX ... 76
APPENDIX 1. Data Used For The Study ... 76
APPENDIX 2: Summary of Related Literature ... 78
APPENDIX 3: Co-Integration Analysis ... 93
TABLE OF FIGURE
Figure 1 : Phillips curve ... 9
Figure 2 : M2 ... 26
Figure 3 : INF ... 28
Figure 4 : GDP ... 29
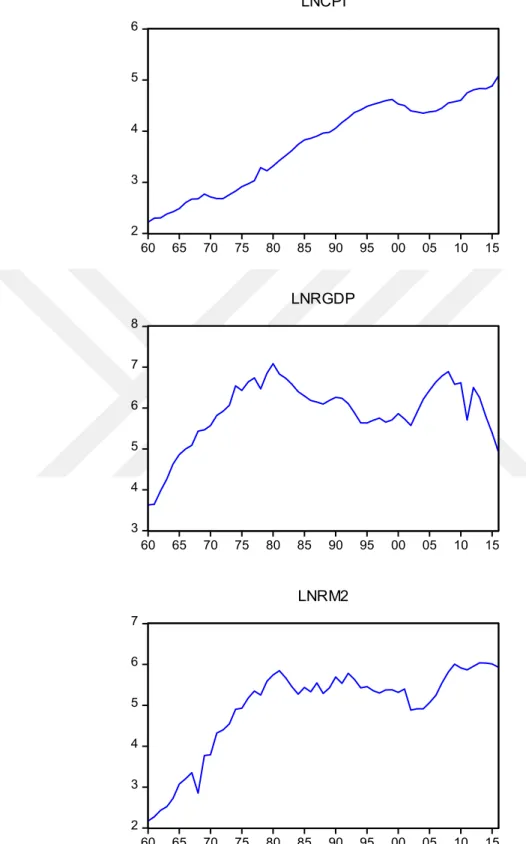
Figure 5 : Time Trace Graphics of LNRM2, LNCPI, LNRGDP Series ... 40
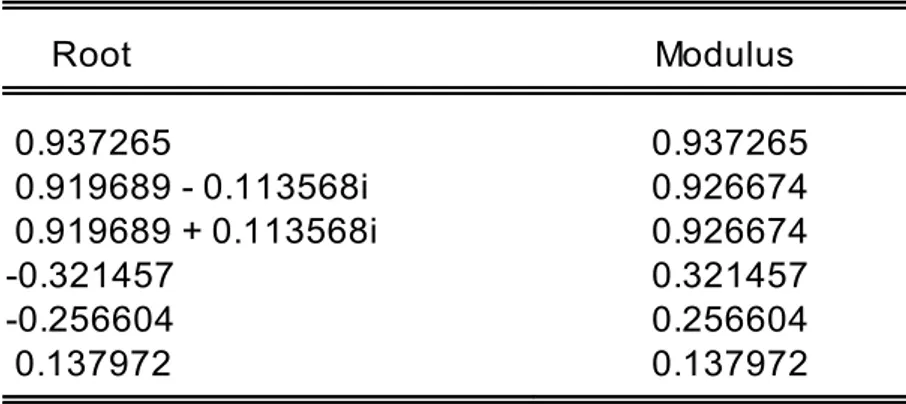
Figure 6 : Inverse Roots of AR Characteristic Polynomial ... 44
Figure 7 : Impulse Response Analysis (Response of LNRGDP and LNRM2 to LNCPI) ... 50
Figure 8 : Impulse-Response Analyses (Response of LNCPI and LNRM2 to LNRGDP) ... 51
Figure 9 : Impulse-Response Analyses (Response of LNCPI and LNRGDP to LNRM2) ... 52
Figure 10 : Time Trace Graphics of LNCPI, LNRGDP, LNRM2 Series... 55
Figure 11 : Impulse Response Analysis (Response of LNRGDP and LNRM2 to LNCPI) ... 64
Figure12 : Impulse-Response Analyses (Response of LNCPI and LNRM2 to LNRGDP) ... 65
Figure 13 : Impulse-Response Analyses (Response of LNCPI and LNRGDP to LNRM2) ... 66
TABLE OF TABLES
Table 1 : Overview of Some Libyan Data ... 22
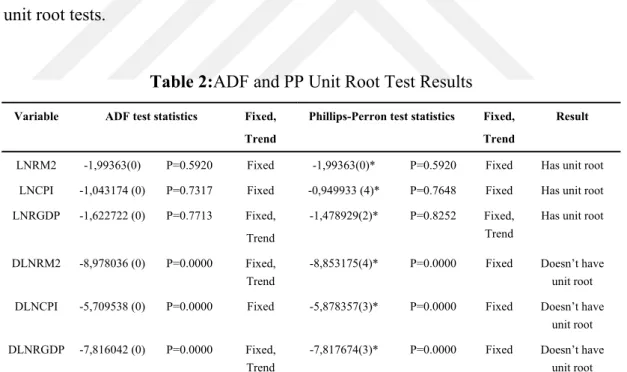
Table 2 : ADF and PP Unit Root Test Results ... 41
Table 3 : KPSS Test Results ... 42
Table 4 : Determination of VAR Lag Length ... 43
Table 5 : Inverse Roots of AR Characteristic Polynomial ... 43
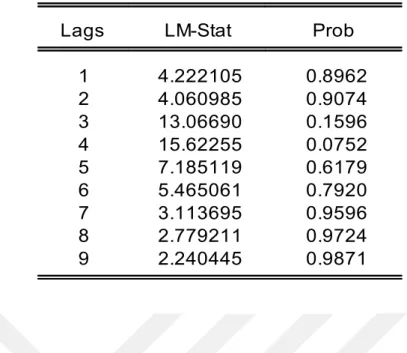
Table 6 : Serial Correlation LM Test ... 45
Table 7 : Co-integration Analysis ... 46
Table 8 : Vector Error Correction Model Test Results ... 48
Table 9 : Pairwise Granger Causality Tests ... 49
Table 10 : ADF and PP Unit Root Test Results ... 56
Table 11 : KPSS Test Results ... 56
Table 12 : Determination of VAR Lag Length ... 57
Table 13 : Inverse Roots of AR Characteristic Polynomial ... 57
Table 14 : Serial Correlation LM Test ... 58
Table 15 : Co-integration Analysis ... 59
Table 16 : Vector Error Correction Model Test Results ... 62
LIST OF ABBREVIATIONS
ADF Augmented Dickey-Fuller
CPI Consumer Price Index ECM Error Correction Mechanism GDP Gross Domestic Product IMF International Monetary Fund J&J Johansen-Juselius
KPSS Kwiatkowski Phillips Schmidt and Shin’s test AIC Akaike Information Criterion
PP Phillips And Perron INF Inflation Rate UN United Nations
QTM Quantity theory of money IMF International Monetary Fund SME Small Or medium Enterprise AEC Asian Economic Community CBL Central Bank Of Libya
VAR Vector Auto-regression Model IRF Impulse Response Analysis
Null hypothesis
Alternative Hypothesis
QTM Quantitative Theory Of Money
AD Aggregate Demand
AS Aggregate Supply VEC Vector Error Correction OLS Ordinary Least Squares
OPEC Organization of the Petroleum Exporting Countries LYD Libyan Dinar
INTRODUCTION
Money supply has a considerable influence on economic activities in both developing and industrialized countries. Not surprisingly, these countries always seek to achieve a sustainable economic growth and development with a very low inflation rate (stable prices), which is considered the primary goal of monetary policy makers and Monetary authorities. Some economists discussed these core issues related with macroeconomics. Keynesians argue that inflation has a positive impact on economic growth. Also they say that the positive changes in income can lead to increasing of demand of money, and then rising of the general price level. However, the Classical economistsassume that inflation associated with an increase in the supply of money leads to a decrease in the value of money that causes inflation. If the economic growth rate is less than the growth in the money supply, inflation will result, as Monetarism suggest.
The processes that lead to increases in money supply in an economy ultimately result into inflation within that country. Money supply in an economy comes from direct government spending, foreign trade among other sources. While demand pressures as well as constraints of supply are critical elements of inflation, central planned economies pose a unique challenge in analyzing the forces of demand and supply as sole contributors to inflation. This is because such economies introduce other factors that affect inflation such as subsidies and price control. Ultimately, these additional factors greatly detach inflation from forces of demand and supply. Libya presents such a case scenario in which the forces of demand and supply are greatly impaired as sole contributors of inflation and overall economic growth of Libya,like other developing countries.
Libya has a memorable position in the global energy market, and has the largest oil reserves in Africa among the tenth largest globally with 46.4 billion barrels. Further, the Oil sector has long dominated the Libyan economy which is about $80 billion, accounting for more than 70 percent of gross domestic product (GDP), more than 95 percent of exports, and approximately 90 percent of government revenue. But The Libyan economy witnessed several international and domestic crises, beginning with economic sanctions in the 1980s. The sanctions included a comprehensive ban on imports and exports, which negatively affected the economic situation of the state and the citizens, where the cost of sanctions amounted to 33 billion in 1991 due to the loss of oil revenues.
As a consequence of the popular revolution that erupted in 2011, crude oil production dropped to 335 thousand barrels per day (a fifth of potential) compared with the natural rate 1.77 million barrels per day pre-revolution. As a result, the economy has remained in recession since 2011 and this led to the deterioration of living conditions and a rise in the level of prices. Thus, this period became the most difficult period for the Libyan economy.
This study aims to examine the relationship between money supply (M2), inflation, and economic growth in Libyafor the period of 190-2016with application from EVIEWS 9.1Econometrics software to find out if these variables are negatively or positively related by using several tests of time series macroeconomic variables and regression models. To ascertain or prove the validity of Empirical evidence, we have to use annual time series data and time series methods of unit root test, co-integration test and Vector Auto-Regression (VAR) model.
After this brief introduction, this work is organized as follows: section I presents the theoretical framework. Section II a brief review of the literature an overview of Libya economy is given in section III. Section IV presents the data and methodology used. While section V shows interpretation of results and discussion. Final section draws conclusion and recommendation.
CHAPTER I
THEORETICAL FRAMEWORK
Macro-economic variables are important indicators of the economic trends in any economy. The relationship that exists between different macroeconomic variables has been subject to debate among economists. The differing opinion among economists on this topic has led to the emergency of numerous economic theories (Kacemi, 2012). This chapter discusses the various economic theories that attempt to explain the relationship between various macro-economic variables.
1.1 Classical Theory
The classical economic theorists formed the foundation over which other theories were developed later. Adam Smith was the first who set the foundation for the classical growth model that would later be used to develop other economic theories. In Smith's classical growth model, he pointed out that three factors of production are correlated directly with the economic output (Sahu, 2016). Also, he identified the three factors of production as land, labour and capital. So, Smith proposed that the three factor of production relate to economic output in the below equation:
, , (1)
From this equation, Smith said that factors that increase the three main factors of production ultimately lead to increasing in productivity. For instance, he pointed that the savings as a factor that increases one’s ability to invest and increases his capital. Furthermore, the income distribution is significant factor that push the economic growth in different countries. He also noted that an increase in the demand for workers increases their bargaining power and increases the cost of labour. The major weakness of this classical theory is that it does not show clearly the relationship between the effects of inflation and the tax on profit margin and the final economic output. However, we can infer from the last discussion of Smith’s classical theory that the two factors has a negative connection with each other. Eventually,high wages reduces profit level as discussed in this theory, hence one can conclude that increase in the taxes and inflation equally has a negative effect on the profit margin. The main critics of this theory argued that it does not account for the causes of inflation and the effect of the tax on profit level and total output (Diebolt and Kyrtsou, 2005).
1.2 Keynesian Theory
This an economic theory which introduced a new school of thought to the discussion on the relationship between the macroeconomic factors. In his book entitled “The General Theory of employment, interest and money” John Maynard suggested that the Keynesians believe in this interrelationship. From the Keynesian view, that government interventions in the economic affairs of the country are significant for the economic growth of that country. This theory suggested that the government intervenes by both contractionary and expansionary economic policies which aim to encourage the investments and increasing the production capacity in the economy.
The traditional Keynesian theory is based on an attempt to attain a point of equilibrium between the aggregate supply curve and the aggregate demand curve. The relationship between the two curves is a demonstration of the relationship between inflation and growth. The theory suggested that the supply curve appears as
sloping straight upward and not a straight vertical line (Dornbusch and Fischer, 2001). The implication of this that any change in aggregate demand has effect on both the prices of products and output. If the supply curve was vertical, it implies that any change in aggregate demand has effect only on the prices but has zero effect on the output (Dornbusch and Fischer, 2001). This position is derived that several other factors come into play in determining the inflation rate in the short term apart from the aggregate demand. Inflation is equally influenced by other factors like the monetary policy, labour force and the cost of other factors of production.
1.3 The Quantity Theory of Money
This theory is mainly related to the changes in demand for money and how such changes affect the price of products in an economy. The Fisherian or “neo-quantity” version of this theory suggests that changes in the supply of money have fixed and mechanical relationship with general price levels in that economy.The economic equation presented by Irving Fisher was the basic version of the quantity theory of money formulated as follows:
(2)
In this equation, M represents the supply of money, V represents velocity of money, and P represents Average levels of price in the economy while T represents the Transaction volumes in the economy.
The quantity theory of Money made the assumption that the only fixed factor in the short run is the velocity of money. Going by this assumption, the equation 2 can be rewritten as %Δ =%Δ +%ΔT. This means that a change in the supply of money has an effect on the overall GDP of the economy. The main argument for this theory is that the controlling of money supply in an economy is a key strategy to achieve the stability in the economy.
The second assumption of this theory is that both; the velocity of money and the volume of transaction will remain fairly constant when viewed in the long-run. The implication of this assumption on equation two is that it can equally be written as %Δ =%Δ . This means that an increase in the quantity of money supplied in an economy will lead to an equal increase in the price levels (Hasan, 2013). Consequently, this assumption led to the conclusion that a change in the supply of money only results into a change in the levels of prices in an economy. Therefore, this theory suggests that inflation is only dependent on the supply of money and not any other variable in the long run. This phenomenon is referred to as the neutrality of money.
Critics of this theory like Keynes say that the velocity of money cannot remain constant in the long run. Moreover, the theory was inconsistent and cannot be demonstrated in the short run in cases where price is sticky.
1.4 Neo-Classical and Endogenous Growth Theories
The Neo-classical theory was articulated by Tobin (1965) and Mundell (1963). Mundell explained how inflation in an economy relates to the growth of output without consideration of the excesses in the demand for products. He suggested that an increase in inflation or a mere expectation of its increase lead to an immediate decrease in the level of people’s wealth. He attributed this decrease in wealth of people to the balancing off on the people’s rate of return on real money (Hasan, 2013). In response, people resort to saving in assets and increasing price levels of their assets and products. Consequently, this lowers the interest rates. An increase in savings as translates into accumulation of capital and increases the rate of capital growth. Tobin developed on Mundell’s assertions by suggesting that inflation causes people to transform their money to assets that can generate more interest. Thus, inflation results to a positive economic growth.
The two economists "Tobin and Mundell" made the assumption that investment is a substitute of the balance of real money. This assumption leads to the
conclusion that an increase in inflation and decrease on real money balance returns will force people to substitute their real money with interest generating assets. Since such assets constitute capital, this switching results to an accumulation capital which consequently leads to economic growth. Therefore, there is a positive relationship between inflation and economic growth in an economy.
Stockman (1981) presented another approach that leads to a conclusion that disagrees with that concluded from Mundell and Tobin. In Stockman’s opinion, the two variables are complemented each other in a way that leads to a negative relationship between inflation rate and the level of output in the steady state. He argued that decrease in purchasing power of money balances leads to a decrease in the people’s purchase of both capital goods and cash goods. Consequently, inflation leads to a decrease of output at a steady level. Therefore, Stockman concludes that there is a negative relationship between inflation and economic growth in an economy.
1.5 Demand-pull & Cost-push Theory
The Keynesian Theory discussed that the increase in the Aggregate demand is the main contributor to demand-pull inflation. Therefore, the aggregate demand includes the net exports, government expenditure, consumption and investment. An inflationary gap occurs in case if the aggregate supply does not meet the aggregate demand and hence creates a surplus of the aggregate demand. Therefore, the rate of inflation is the difference between the aggregate supply and the aggregate demand.
Keynes and his followers made the assumption that price will remain fixed. However, they did not deny that price can only remain fixed in the short run, since other non-monetary factors play a role in determining the prices. Moreover, output is a variable factor since it is influenced by levels of investment expenditure. From this theory, changes in price are affected by nominal money income through the effect of the interest rates. For instance, an increase in the amount of money would
interest rates will cause an increase in aggregate demand which in turn will serve as a motivation for the increase of investments. Also, the increased aggregate demand will have the impact on output first rather than price assuming unemployed resources are available.
In simple terms this theory proposes that the main cause of inflation occurs when both increased demand of products and high level of production of the same products. Therefore, increased aggregate for demand goods and services increased prices and the overall increase in GDP. This conclusion leads to the demand pull theory. Under the demand pull theory, demand pull inflation occurs when there is “too much money chasing too few goods” (Tobin, 1965).
On the other hand, the cost push theory presents a opposite story to the demand pull theory. According to the cost push theory, inflation occurs when the factors affecting prices leads to a more rapid increase in the prices compared to the rate of increase in productivity resulting from changes in the factors affecting productivity (Hasan 2013). These Factors such as increase in the cost of labor or raw material will lead to an increase in the overall cost of production. This in turn, leads to an increase in prices and hence inflation. Therefore, inflation that arises from an increase in the cost of production is referred to as the cost push inflation.
1.6 Phillips Curve
The Philips growth curve shows that the inflation rates have an inverse relationship with the unemployment rate. This curve remains very controversial among economists. The centre of this controversy is in the very existence of the tradeoffs that this curve suggests (the prices and unemployment) based on data that used to develop this curve which obtained from the United Kingdom during the period between 1861 and 1913. The Philips curve suggests a tradeoff between unemployment, inflation and wages (Diebolt and Kyrtsou, 2005). For instance, an increase in inflation and consequently wages leads to a decrease in unemployment. Moreover, a reduced unemployment rate results in an increase in the cost of labour.
The Philip’s curve below shows the impact of the shift in prices from equilibrium (U*) and the subsequent effect on inflation.
10% PC 0 ∗ Figure2:Phillips curve
CHAPTER II
LITERATURE REVIEW*
It is important and relevant to notice that; most early studies in the past, investigated theoretical and empirical aspects of the relationship among various variables, especially money supply, inflation rate and economic growth. Different authors have different conclusions about the relationship that exists between these variables. it is useful to briefly review some of their related works below.
Rosemary (2015) Empirically, examines of the impact of inflation on Nigeria’s economic growth and shown that it has had an influence on the real gross domestic product in Nigeria over the past decades. The time series of data collected annually indicated the significances of the variables from the time period between (1970-2013). Research has shown that both the high rate of inflation and the high rate of unemployment have had a negative impact on the economic growth and real gross domestic growth (GDP) which has although been less responsive to inflation as compared to unemployment. Although in most cases the results have also shown that the real GDP is more responsive to inflation and less responsive to unemployment. Granger’s study shows that long-run causality did not find between inflation and real GDP.The results showed that at lag1; both inflation rateand unemployment have had a negative effect on the economic growth a meanwhile at lag 2; it showed that RGDP is more responsive to inflation but not like responsive to unemployment. This study applied the Augmented Dickey-Fuller (ADF), Phillips Peron (PP),
Kwiatkowski Phillips Schmidt and Shin’s test (KPSS) unit root tests and the Johansen co-integration test.
Komain Jiranyakul (2001), using the series quarterly collected data that ranged from the first quarter of (1990 to 2000), showed that there is no causal relationship between money growth and the inflation rate. The test results reject the notion that money growth is the main cause of inflation in Thailand during the period under study. Through a clearer observation, it was imperative to pinpoint a list of other determinants of inflation in Thailand such as: the oil shock, an increase in the production costs, and stimulus fiscal policy variables. Empirically, the paramount goal of this paper was set to investigate the correlations and connection between: real money supply, inflation rate, and real gross domestic product. Methodologically, this study used the Augmented Dickey Fuller (ADF), ECM and Phillips Peron (PP) test
Chan Wun (2016), based on series of quarterly collected data from (1999 to 2015) using Vector Error Correction Model (VECM), error correction model (ECM), Johansen co-integration, and Granger causality test, found that both of the money supply growth and economic growth are positively related and connected to the inflation rate. These results can be explained by Quantity theory of money (QTM) model which states that the velocity of money and real output are fixed in the long run. Therefore, the increase in money supply directly causes an increase in the inflation rate. In an AD-AS model, a rise in money supply causes a fall in the interest rate, which stimulates the aggregate demand; it causes a rise in the price level in a long run. It is important to notice that when it comes to the issue of the short run, through an empirical study one can find out that money supply negatively causes inflation rate. It is unlikely to have a long run relationship. Inflation rates are affected by the price of imported goods, raw material, and agricultural produce. Therefore, money supply is not the only source and factor that influences inflation rate. Moreover, the impact of inflation rate on money supply growth fluctuates in the short run. Now based on observation, money supply proves negatively, in relation to economic growth in the short run. One of the reasons behind economic growth is the more direct influence on the growth of the consumption, investment, government
expenditure and net export. Therefore, money supply is not the only factor that affects the economic growth of a country.
Faraji Kasidi (2013), examines the impact of inflation on the economic growth in Tanzania. Through an annual time-series of economic data collection for the period of time between 1990 to 2011 which obtained from the CBN Statistical Bulletin (2010). The findings from a regression analysis discovered that inflation had a negative impact on the economic growth in Tanzania. The results of the co integration test showed that there was no co-integrating relationship between inflation and economic growth through the period of (1990-2011). A statistically significant long-term relationship between inflation and economic growth was found. However, there was a negative and statistically significant relationship in short term. The study proved that the degree of responsiveness of the change in GDP because of the change in the price levels was inelastic.
For Cameroon, Henri Ngoa Tabi, Henri Atangana Ondoa (2011), examined three macroeconomic variables (Inflation, Money and Economic Growth) based on the data from the Central Bank between the period of 1960 to 2007.They suggested that an increase in money supply can boost growth and that inflation is not a major determinant of economic growth. Also, the results from these estimations showed that an expansionary monetary policy did not necessarily lead to an increase in the general price level in Cameroon. Moreover, The results showed that money in circulation caused growth and growth caused inflation. However, it was realized that an increase of money in circulation does not necessarily induce an increase in the general price level. Furthermore, The study showed that money supply was positively related to inflation. Exchange rate, interest rate, and government expenditure were inversely related to inflation. With these findings, it became clear to infer and assert that money supply, exchange rate and interest rate determined inflation in Cameroon. The study used Granger causality test, Augmented Dickey- Fulley (ADF) test, and the VAR model.
Cuma Bozkurt (2014), examined money, inflation and growth relationship a Turkish case, which was derived and taken from a quarterly data time collection from 1999 to 2012. The increase in money supply and speed of money can lead to inflation in a long run. In other words, there is a high relationship between money supply and inflation. a raise in the growth of money causes an equal boost in the inflation rate. Co integration tests indicated that there was a unique long-term or equilibrium relationship between variables. This study was conducted through the use of ADF unit root test and Co- integration tests.
Fekadu Dereje Girma (2012), analyzes the short run and long run relationship between economic growth and the inflation in Ethiopia by using the yearly data obtained from the world economic outlook database of IMF for the period between (1980 to 2011). The research showed and revealed that inflation does not have any forecasting power on the economic growth in the short run. Co-integration test showed that there was a long run relationship between the economic growth and the inflation rate in Ethiopia. The Vector Error Correction (VEC) estimated some results that showed that increase in output growth decreased inflation in the short run during the sample period of 1980-2011. However, the second equation showed that inflation does not have a significant effect on the economic growth in the short run.The error correction terms were classified to be statistically significant which showed that if both inflation and economic growth were out of equilibrium, inflation will adjust to reduce the equilibrium error in the long run. This was also an indication that economic growth significantly reduced inflation in a short run while the inflation did not have any significant effect on the economic growth. If inflation had previously been larger than the normal share, then economic growth could have caused the inflation to be lower in the long run. The VAR model showed and proved that inflation does not have significant effects on economic growth in a short run. On the other hand, the Granger Causality test showed that economic growth causes inflation which means that economic growth can predict movements in inflation.
Fitsum, et al (2016), examines the relationship between inflation, money supply and economic growth in Ethiopiaand analyzed by a co integration and
between inflation rate and economic growth in Ethiopia between the period of 1970 to 1971 and between the years 2010 to 2011 in Ethiopia through a secondary data source this study employs a tri-variant Granger causality test with Vector Error Correction Model (VECM) and Johansen Co integration Test, Augmented Dickey-Fuller (ADF) and Phillips-Perron (PP) test statistic which showed: that money supply, aggregate price, and real GDP were co-integrated. It implied that the variables had a long run equilibrium relationship. Furthermore, VECM test indicated that there is a bi-directional causal relationship between inflation rate and supply of money as well as unidirectional causal relationship from economic growth to the inflation rate in the long run. In the short run, the model indicated that there was the presence of unidirectional causality from money supply to inflation. The model also revealed that economic growth has had a negative effect on inflation in the short run.
Iwedi Marshal (2016) The Link between money supply and economic growth in Nigeria through an econometric investigation reveals that the data collection between the time period of 1970 to 2014 with regards to money supply had a short and long run positive and significant linkage on the Real Gross Domestic Product in Nigeria. There were co- integration between M2 and RGDP and so there was an equilibrium relationship between the two variables in the long run. On causality, there was a causality running from M2 to RGDP and not vice versa. This showed that there was unidirectional causality from money supply (M2) to Real GDP in Nigeria during the period of study. These findings were concluded from theVAR testing the short run relationship between the variables, from; co-integration testing the long run relationship between the variables, and from; Granger causality test for testing the direction of the causality linkage.
A.S Bakare (2011) An empirical study of the determinants of money supply growth and its effects on the inflation rate in Nigeria were covered during the periods between 1981 and 2006.The results showed that changes in money supply determined the inflation rate in Nigeria. It showed that a 1% rise in money supply can lead to increase in inflation by 5.6 percent. And also, a rising in exchange rate had a positive impact on inflation. Similarly, the interest rate determined the inflation by the highest level. It showed that a 15% increase in the interest rate leads to 102.9
percent rise in the inflation in Nigeria. These findings were derived from and concluded through the VAR for testing the short run relationship between the variables, co-integration for testing the long run relationship between the variables, and Granger causality test for testing the direction of the causality linkage.
Evans Ovamba Kiganda (2014) The relationship between inflation and money supply in Kenya was examined based on the annual time series data spanning from 29 years between the time periods of 1984 to 2012. In general, the findings of this study indicated that inflation and money supply in Kenya had a positive relationship. Also, unidirectional Granger causality was established through the running out of money supply to inflation in Kenya. In conclusion, there is a significant positive long-run relationship between inflation and money supply in Kenya. That is, the source of inflation is mainly derived from the growth rate of the money supply and that a quick increase in money supply leads to a rapid rise in inflation rate. This study employed the: Augmented Dickey Fuller (ADF) test, Vector Error Correction Model (VECM) and Granger causality test.
Obaid (2007) has examined the causality connection between the actual GDP and money supply (M3) in Egypt from 1970 to 2006 by utilizing Granger test. This author has found that causality does not exist between the nominal GDP and the nominal money supply during the research period. For instance, when he applied the real GDP and definite money supply, he realized that there is a collective causality connection between the real GDP and the actual distribution of money in Egypt. As a result, Obaid considers an economic policy as a suitable strategy to be used as far as Egypt’s real GDP is concerned. However, the mutual causality connection could aid the researcher to predict the GDP’s performance in a given volume of money distribution by the Egyptian economic policymakers.
Moreover, Hossain (2005) has examined the casual link amid economic growth, currency devaluation, inflation and money growth in Indonesia in between 1954 to 2002. This inscriber has realized that there is a short-term bi-directional causality occurring among currency inflation and devaluation as well as between the
rise in prices and money supply growth. In consideration of the entire sample period, the causality succeeding inflation to the growth of narrow distribution of money was strong while compared to tapered capital supply expansion to inflation.
Furthermore, Vector and Stephen (2000) have studied if there is a momentous long-run connection between the nominal GDP and money as well as the price level and money in the Venezuelan financial system. These authors have employed time-based econometric methods to get annual data of the above nation from 1950 to 1996. One of the crucial aspects of their analysis is the application of co-integration and unit roots test in combination with structural ruptures. Indeed, the structural breaks are suggested to be important by some elements of the Venezuelan. Because economy relies greatly on oil gains, the shocks concerning oil price are believed to have a great impact on various macroeconomic variables. Since the economy also has large far-off debt, the global liability crisis that occurred in 1982 had persistent implications on Venezuela’s financial system. The radical alterations concerning political instability and economic policy might also lead to a significant effect on the macroeconomic changes. However, these writers have concluded that there exists a long-term interaction amid nominal GDP and narrow money (M1), the CPI and the GDP deflator particularly when one made grants for one or more structural breaks.
Tan and Baharumshah (1999) have explored the informal link between prices, output, and money in Malaysia. These authors have recognized that in short-term cash is non-neutral, thus an indication that there is a unidirectional connection between output and money though the opposite is not true.
Al-Sawai’e, Al-Fawwaz (2012) investigated Output, Money, and Prices for Jordan. The empirical analysis was based on VAR model with annual data for the period 1976-2009. The findings of this study showed that, a non-presence of a long-term link between the study variables. They conclude that the changes in money do not have any influences on the output in Jordan in the short run. In addison to, this results discovered that money supply as a dependent variable will cause inflation
movement and not in the economic activity. The authors concluded that the monetary policy will not be effective in Jordan in a short run.
Daniela and Mihail (2010) have also researched about the relationship between GDP and money supply in Romania. This study used ADF method and relied heavily on the data harnessed from GDP and money supply (M3) over ten years. The analysis showed that both sequences are non-stationary, but when the Engle-Granger co-integration technique was employed it indicated a conjoining between M3 and GDP in long term, also M3 can cause GDP. In the view of developing nations, Abbas (1991) has explored the casual connection amid output and money in Asian countries and found that there exists a collective interaction between income and money in Thailand, Pakistan, and Malaysia. On the other hand, Kalumia and Yourogou (1997) have spotted a causal interaction between income and money in West Africa thus indicating the existence of non-neutrality aspect of money.
Sims (1972) has applied Granger causality method to research about the connection between the output and amount of money in the United States. He discovered that the quantity of wealth helps the interpretation output though vice versa is not true. In other words, his results indicates that there is a causality course from the volume of money to GDP, an aspect which is unswerving to the views of monetarists and Friedman.
Ogunmuyiwa and Francis (2010) have employed the VAR model, causality test and econometric method OLS to study the explication of money distribution on economic growth in Nigeria in between 1980 - 2006. These authors have found that despite money distribution being positively linked to growth, there is a connection between expansionary and contractionary money supply. Also, Ahmed and Suliman (2011) explored that three macroeconomic variables such as price level (CPI), money supply and real gross domestic product of yearly data of Sudan in between 1960 to 2005 are co-integrated in long run. Through the application of Granger causality, they revealed that the causal direction between GDP and CPI is uni-directional
without any feedback. While, CPI does not cause money supply, but the causation runs from money supply to price level.
Nevertheless, Babatunde, Shuaibu (2001) checked the relationship among Money supply, inflation and economy growth in Nigeria.In thisanalysis, they employed ARDL model, based on 33 observations and an annual datawas used.The results presented that real income, money supply, inflation, gross fixed, capital formation are cointegrated. Moreover, they found that the real income is positively influenced by the gross fixed capital formation in the long run at 5% level. While a 1 percent price increase in money supply will lead to boost real income by 0. 144%.Also, the increase in inflation rate will cause to increase by 0.128% in real income.
Wang Yan-liang (2012) his study proved that there exist co-integration relationship between supply of money and inflation rate. But the cointegration among economic growth and money supply is completely absent.
Additionally, Yuan (2007) has used variance decomposition and co-integration methods to investigate the relationship between economic growth, inflation, and money supply. The author noted that capital distribution was non-neutral and exogenous to the output in the long run view. Moreover, Yao realized that economic growth and inflation have a devastating connection in both long run and short run, though they would get back to usual level. However, the writer has rowed that money supply has a lag impact on economic expansion and inflation velocity.
Prasert Chaitipa, Kanchana Chokethaworna, Chukiat Chaiboonsrib, Monekeo Khounkhalaxc, (2015) looked at Money Supply Influencing on Economic Growth-wide Phenomena of AEC Open Region; which are Singapore, Indonesia, Thailand, and Malaysia. The analysis was based on the yearly period from 1995 to 2013. Unit root, co-integration, Hausman Test and ARDL approach were used. The most appropriate way to investigate the relationship between money supply and economic
growth was Pooled Mean Group estimator. The conclusion of this study that there is a long run relationship between supply of money and gross domestic product. Money supply (M1) has a positive relationship with GDP growth, however, demand deposits were a negative relationship with GDP.
CHAPTER III
OVERVIEW OF THE LIBYAN ECONOMY
3.1 Background
Libya is among the developing nations having a large relatively populated land. This country has identical idiosyncrasies of other developing regions for it relies on agriculture as the basic source of revenue, that is, contributing to about 30%of the Gross Domestic Product (GDP) and the rest proceeds are obtained from grants and aid from the United Kingdom and the USA. Prior to the discovery of oil, Libya was amid the poorest nations in the global view since most of its citizens lived an underprivileged life with an average per capita of less than $40 in every year; and there were no mineral and power resources.
Despite the Libyan country being among the poorest nations in the entire universe, this nation had equilibrium between aggregate demand and aggregate supply. The above balance had not resulted from the efficiency of production, though it emanated from the equilibrium between the factors influencing poverty and economic backwardness. However, Libyan’s economy was in the dire urge of a big push of pernicious equilibrium that overwhelmed it.
In the end of 1950s, oil was invented in this nation and it started to be exported at the start of 1960s hence bringing about great changes in the economy of Libya. For instance, the discovery of this mineral made various foreign companies to enter Libya and commenced to export products hence making the economic structure to prevailing leading to a radical transformation of the financial system. Oil has made
this nation to capture prominent rank in the global energy market. In 1962, Libya subscribed to the Organization of Petroleum Exporting Countries (OPEC), two years subsequent to the creation of the above institution. In 1962, this nation had managed to produce about 67.1 million barrels of oil though in 1965 this volume hiked to 445.4 million barrels. As a result, Libya has positioned fourth biggest oil manufacturer in non-communists and it was followed by Venezuela, Iran, and Saudi Arabia. Similarly, this nation produces an average of 1.6 million barrels daily (that is, 2.09% worldwide oil production) thus being ranked 17th amid the global largest oil makers whereas Africa is the third largest producer. Otherwise, the oil reserves of Libya are the biggest in Africa hence getting positioned 9th among ten nations with largest confirmed oil resources in the world; this is an estimation of about 48.12 billion barrels, roughly 3.04% of the international reserves (Waddams, 1980).
Because of oil, Libyan financial system primarily relies on the oil export revenue accounting to more than 70% of GDP (above 95% exports and 90% government revenue). In this country, the oil sector is controlled by the government since it acts as the core basis of distant trade earnings. Oil has also made Libya’s GDP to rise hence this country is amid the nations having highest per capita earning in Africa because of low population and lots of wealth. Libya’s financial system has transformed from primitive farming economy to petroleum-based cutback hence leading to improvement of living standards and making this country to have unbalanced expansion economy. Eventually, Libya’s situation has subjected the administration to great pressure of trying to satisfy the entire requirement of community and catering for their needs. Indeed, the above aspect has enabled Libya to be responsible for getting the best mean of attaining its targets.
Since the 1970s, the government has put notable efforts on achieving economic diversification due to uncertainties concerning oil prices and issues regarding global warming which can lead to serious unenthusiastic implications in the economic view.The above trials aimed at reforming the economy. For instance, the Libyan administration has invented three strategies geared at the instigation of economic diversification. For example, there were started annual investment
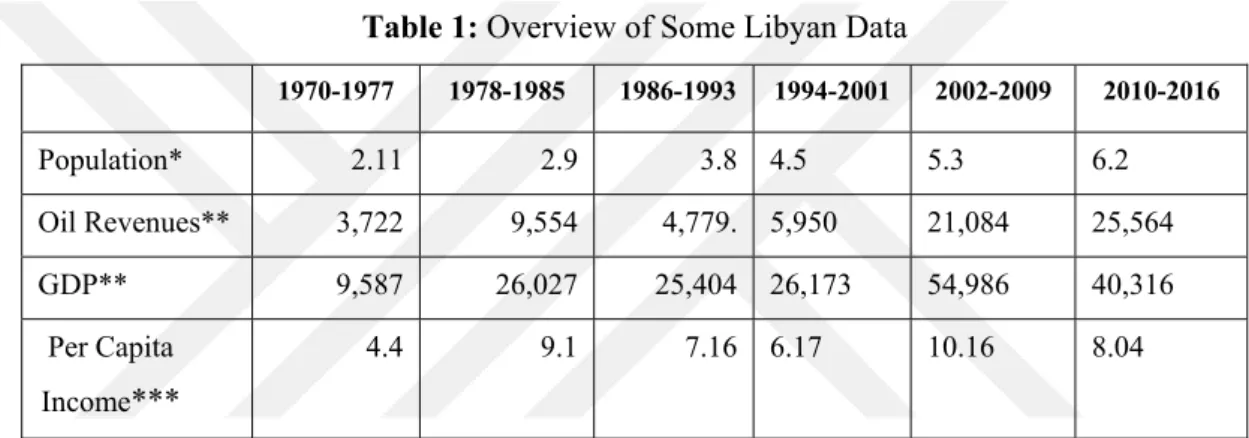
five-year program (1976 to 1980); and a five-year project (1981 to 1985). The core purpose of thee programs and strategies was to attain a measured reduction of the governance of the oil subdivision on the entire economy as well as ensuring diversification of production, particularly manufacturing and agriculture sectors. The above activities have been positively echoed by the financial system. Table 1 denotes that the GDP had risen drastically from 9.5 Billion to 26.0 Billion, that is, an increase of 17% during 1970 to 1985. The Libyan plenty financial reserves are enhanced by the rise in oil earning by 20%. The above improvement was accompanied by a significant augmentation in per capita income that rose by 104% as well as a population increase by 37%.
Table 1: Overview of Some Libyan Data
1970-1977 1978-1985 1986-1993 1994-2001 2002-2009 2010-2016 Population* 2.11 2.9 3.8 4.5 5.3 6.2 Oil Revenues** 3,722 9,554 4,779. 5,950 21,084 25,564 GDP** 9,587 26,027 25,404 26,173 54,986 40,316 Per Capita Income*** 4.4 9.1 7.16 6.17 10.16 8.04
Author’s calculation taken as an average of 8 years. Sources of data are International Monetary Fund (IMF) and Libyan Statistics and Census Bureau.
In thousand dollars***, billion dollars** and in millions of people*.
In 1986, the UN and the US obliged economic endorsement on Libya, a thing that coincided with the decline in the global oil price hence hindering the entire success of the above three plans. The sanctions entailed restriction of US firms from transacting with Libya; freezing the assets owned by Libya; prevention of global flights to Libya; stopping the selling of aircraft, oil equipment, and arms. These actions basically affected the oil firm operating in Libya though the rest activities were going on. The regime was also pressured to cut subsidies for monetary diversification programs, thus failing to boost its economy. As a result, the economic status started to worsen and the earnings from oil severely dropped by almost half at the begging of sanctions. However, this rise was meek by 24% in the 1980s and 1990s as contrasted with pre-sanctions shown in the above table. Irrespective of these
sanctions, the GDP did not attain any progress but it remained volatile, that is, rising to 26.1 and falling to 25.4 again. On the other hand, the population poll did not vary notably since the population density rose by 4% because of fall in per capita income.
For United Nations (UN/SU) sanctions got picked up in 2003 and the sympathetic developments in the international oil market; this nation had maintained an upward economic growth. Moreover, various measures had also occurred thus boosting the role of the private sector in the financial system. Eventually, the gains from foreign investors rose, particularly in the infrastructure and hydrocarbon field. Nonetheless, the Libyan’s economy was still relying on hydrocarbon reserves. Evidently, the sanctions lifting were the core watershed in the history of Libya. Conversely, various macroeconomic variables including GDP encountered an extremely spiky bounce back by 110% due to heightening oil revenues by about 254%. Because of these increases, the per capita income faced drastic growth of 65% and the population rose by 16.8%.
Libya has made a momentous progress on economic reformations and has potentially gotten closer to the developed nation in different regions such as Saudi Arabia, Qatar, Jordan, and United Arab Emirates. However, the violent resistance that emerged in Libya on 17th February 2017 has made the UN Security Council compel sanctions on Libya hence leading to freezing of Libyan international assets. As a result, the Libyan economy suffered for six lean years before encountering a labyrinth of political complexity and the distinctions that emanated from February Revolution that unswervingly impacted oil production. Eventually, the volume of crude oil dropped to the lowest point on record to about 0.4 million barrels daily (bad); a number that represents a quarter of possible production. This country also encountered a historic economic depression where its revenue reduced by 60%. As a result, GDP went to 40.3$ billion, a figure that was lower compared to the flourishing period. Moreover, a per capita income fell by 20% because of the high population growth rate of approximate 17%. Furthermore, the Libyan upheaval also led to drastic international and regional spillover. Before the conflict, Libya was accounted for 2% international production of crude oil, and the decline of Libyan oil
3.2 Money Supply
Libya encountered a great revenue boom from oversea currencies in between the 1970s and 1980s resulting from higher charges of oil during 1970 to 2010. These rises were accompanied by both positive and negative implications on all fields of the Libyan national economy and money distribution. The surplus distribution of money was applied to fund regime expenditure as well as for changing the Libyan financial system from aid beneficiary to a donor. Furthermore, Libya also attained an economic transformation from capital scarcity to abundance.
The analysis of the indicators and statistics of Libyan money supply1, it is clear that in 1970 this country had approximate 668000$ million and was about to attain 3,453$ Billion by 1976. The anticipated improvement was due to the continued increase of money supply the nation sometimes experienced some declines, particularly during the sanction period. The Libyan monetary advancements were viewed in terms of steady money growth following embargo lifting of 2003 to 2004. These developments also denote economic re-monetizing which aligns with the progressed domestic economic status and heightened public assurance as well as the sharp rise in public crediting at an interest rate of 23%. According to Figure 3, during the completion of the study (2016) Libya had approximate 60.639$ Billion. This development in money distribution emanated from a rise in the narrow money supply2 or balanced heightening supply of quasi-money3. The above condition indicates that expansionist policy implemented by the CBL is enabling Libya to open up international market.
Otherwise, Broad Money (M3)4distributions are applied in some developed nations. For instance, the expansion of money markets and the instigation of the fiscal organization as well as liaison between the central bank and commercial plays
1 In this study we use M2 as money supply
*2; Includes currency traded outside commercial banks plus demand deposits (known as current
deposits) M1= CS + CD.
3; Includes Time deposits and savings deposits (DM). 4; M3 = M1 + Time Deposits at Banks.
vital role in boosting economic growth. The other factor attracting lots of revues include banks dealings involving securities from purchase and sale of securities always carried out by organizations such as lending and saving banks (AL Dujaili A, 2001).
However, the categorization of M3 is not practiced in Libya due to the absence of mechanisms of carrying out this activity. Prior to and after the rebellion, the financial condition of the community was not good hence the government could only finance the expenditures through borrowing money from CBL and through drawing down deposits from lending organizations. Otherwise, the money supply rose because of monetization of the budget shortfall; hence making the circulating currency to increase three times from 6.1$ Billion at end of 2010 to 18.8$ Billion at the finish of 2016. Apart from this rise in circulating currency, demand for money heightened, even more, leading to deficiency of liquidity in the banking system addressed by the CBL.
Undoubtedly, the financial policies used by Libya have affected the exchange rate of Libyan dinar alongside the dollar, that is, the higher the level of dinars, the lower the value of dinar as compared to the dollar. Indeed, the amount more than the dinar is supposed to be exchanged with a dollar to increase the commodity prices or to lessen the level of personal real income. For this reason, we assumed that the amount of money supply positively affects the level of prices.
Figure 2: M2
Source: This data is sourced from Central Bank of Libya and the Libyan Statistics and
Census Bureau.
3.3 Inflation in Libya
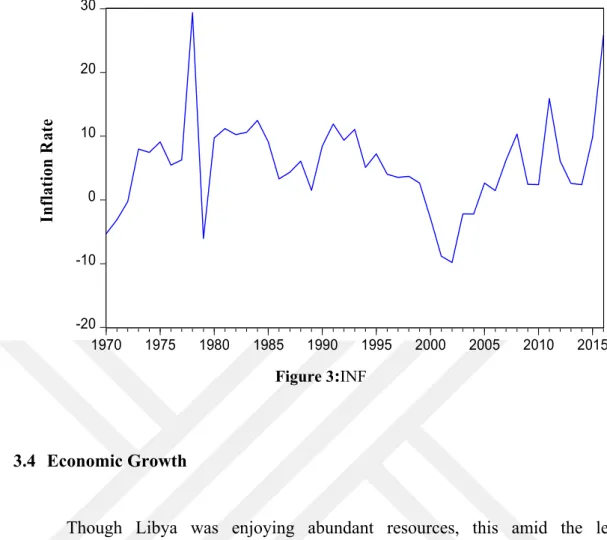
By 1970s and during early 1980s, Libya has encountered a severe rise in oil revenues because of the advancing nature of its economy and restricted availability of endogenous resources instead of oil. Moreover, the Libyan financial system experienced a rapid rise in almost entire macroeconomic variables as indicated previously, particularly, the consumer price level(Alkoum & Agil, 2013). For instance, Figure 4 denotes that the inflation went to the highest level (29%) because of the heightened level of reserves and liquidity emanating from oil revenues. However, the administration was forced to trail a contractionary strategy to minimize inflationary pressure through reducing public spending, lessening budget deficits and increasing taxes (Alshami, 2014).
On the other hand, inflation became moderate but has also denoted a considerable volatility concerning exogenous shocks and policy changes accompanied by instances of stable and stable inflation. This condition was followed by sudden bursts as shown in Figure 4. However, consumer price inflation and
0 10,000 20,000 30,000 40,000 50,000 60,000 70,000 1970 1975 1980 1985 1990 1995 2000 2005 2010 2015 N om ina l M one y Sup pl y (M 2) '' M ill io n $"
supply growth exhibited a high level of contemporaneous correlation that occurred in the middle of 1980s and 2000. Figure 3 and 4 indicates that the route of development of money distribution and the inflation rate is moving in a single direction. The above condition confirms that the QTM theory, which found that the level of money supply impacts the entire intensity of prices. Since in both year, 2000 and 2004 Libya had encountered a deflation in consumer prices index at a yearly rate of 7.2%. In between, 2004-2010 was a period of rising in oil prices accompanied by an increase in civic disbursement (investment and consumption), with the intensification rate of public spending that reached 16.5% hence leading to rising in money distribution to 20.28%. Moreover, the GDP heightening led to pushing up of inflation (ShenbischA, 2013).
The Central Bank of Libya (CBL) did non have foreign assets hence faced hardship in foreign exchange selling because of UN sanctions. The above condition was worsened by the corresponding market value of Libyan dinar (LYD) that fall drastically in 2010. In 2016, the LYD also depreciated by about 620 percent because of restriction concerning foreign exchange restrictions that were applied by the UN. Furthermore, in late 2016, there also emerged a shortage in food distribution and prospering of black markets which led to an increase in food prices by 71% (Bank, 2016). As a result, the inflation hiked to 25.9% at the same period. Nonetheless, the Central Bank failed to deal with the crisis in a professional way and did not undertake suitable measures irrespective of the aspect that it had tools and time.
Figure 3:INF
3.4 Economic Growth
Though Libya was enjoying abundant resources, this amid the least diversified financial systems in the north Africa among different oil-producing nations. The weakening of economic situations started in the mid-1980s with the global fall of oil prices and the condition exacerbated by the imposition of intercontinental sanctions (Alhaj, 2006). Eventually, Libya suffered from a structural private investment gap, since most economic growth has relied more on public investment, and less on private investment and human capital. The above condition made Libyan financial authorities to come up with growth and transformation plans. In particular, there was started a three program that was to be implemented in three phases, that is, 1973-1975, 1976-1980, and 1981-1985.
Additionally, there were yearly investment programs that were formulated in between 1986 and 2000. Apart from the above programs, Libya was getting revenues from different sources such as agriculture contributing to about 20%, the manufacturing sector had 26% whereas the oil product donated about 54% of the gross product. All the above sectors led to an approximate 171% rise in GDP.
-20 -10 0 10 20 30 1970 1975 1980 1985 1990 1995 2000 2005 2010 2015 In fl at io n R ate
Moreover, the US/UN sanctions, as well as the weakening of oil prices, subjected Libya to most influential situations hence leading to disturbance in economic growth thereby making the annual growth to drop to 3%. Furthermore, the state intervention also led to a reduction of imports’ spending which caused recession aggravation and fall in the development rate of the entire local production in various sectors in 1985-2001 (Secretary of Planning, 1998). Additionally, the yearly investment policies applied during the embargo time (1986 to 2003) had not attained any noteworthy developed as indicated in Figure 5 below.
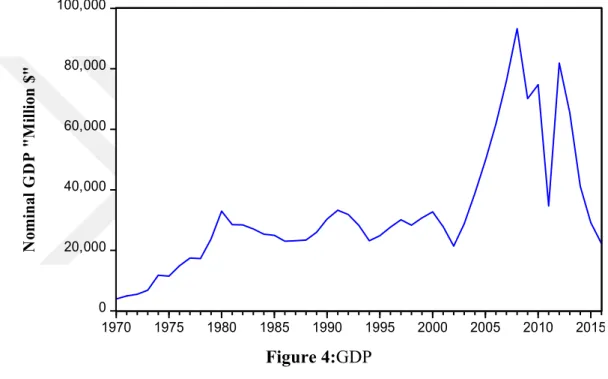
Figure 4:GDP
From the lifting of global sanctions in 2003, Libya has attained high levels of economic developments by taking advantage of the increase in international oil prices. Subsequently, state revenues have risen and spending on expansion projects has heightened too. This time also denotes the return of growth strategy, following planning that had halted in between 1980s-1990s (Mhannam, 2014). Furthermore, interest emanating from overseas investors also augmented, particularly in the hydrocarbon field. The Libyan GDP has piercingly risen by 52 percent for seven years. Based on the IMF’s data, the GDP of this nation was 74.7$ Billion in 2010 as contrasted to 2003 when it was28.5$ Billion. The revenue collected from oil was more than 68% of GDP, that is, 95% of the entire GDP. Gross domestic product
0 20,000 40,000 60,000 80,000 100,000 1970 1975 1980 1985 1990 1995 2000 2005 2010 2015 N om ina l G D P "M illio n $"
(GDP) growth has been highly volatile since a civil war in 2011. The hydrocarbon sector was negatively impacted by the turmoil which led to an over 70% reduction in oil production. This fall off in production had a debilitating effect on the economy evidenced by the significant decline in GDP growth by -53%. In 2012 GDP growth was restored recording an increase of 135%. However, since 2013, Libya has been in a recession with growth contracting every year through 2015. In 2016 economic growth is declined by 24%.
CHAPTER IV
MEHTODOLOGY AND DATA
This chapter focuses on explaining the data, theoretical model as well as empirical methodology applied in the study.
4.1 Data
In this study, the causality interaction between economic growth, money supply, and inflation was analyzed through application of annual data retrieved from the Census Libya, the International Monetary Fund (IMF) and the Bureau of Statistics Central Bank of Libya in between 1960 to 2016. However, some of the information from 1960 was implemented since the previous studies didn’t have a connection with the preceding years.
4.2 Method of Analysis
The Vector Auto-regression Model (VAR) is amongst tool designed to analyze the available data series. This research has also applied various developed time series approaches such as Error Correction Model Test, Unit Root Test, Diagnostic Test, Granger Causality Tests, Eviews9.1 program and Co-integration Analysis. However, the series is transformed to logarithmic form to obtain LNCPI, LNGDP and LNM2 and respectively over the period.
4.2.1 Specification of the Model
The regression framework for this research was founded on the monetarist theory, a model that shows a link between different variables. During this study, the used function or model should have variables indicating their connections. The link between inflation and pertinent economic variables can be explained in functional form as follows:-
2, (3)
Where:-
= (the natural log of Consumer price index) is applied to indicate the rate of inflation.
2 = (the natural log of Real Money Supply) represents the supply of money.
= (natural log of Real gross domestic product) is considered as a tool for determining economic growth in Libya.
To ensure that the regression function is in an estimation formality, the function should be restructured to a Vector Auto-regression Model and it should entail a lag period and an error term.
4.2.2 The Vector Auto-Regression Model (VAR)
The VAR model is commonly applied to investigate the connection among macroeconomic variables applicable in this study. Indeed, VAR is an econometric model that helps in capturing the progression and relationships between different times series through generalizing AR sculpts. However, all the variables in a VAR are considered to be methodological since it includes every variable in an equation as
well as explaining its evolution with regard to its lags and the wraps of the remaining variables in each mock-up. Because of this feature, Christopher Sims advice people to apply VAR sculpt for they are theory-free tactics of guesstimating economic links. As a result, this model is viewed as a substitute of the “incredible identification limitations” available in structural approaches. The VAR model calls for the application of suitable integration order from I (1) to ensure that the entire variables are stationary at the leading difference.
The Vector Auto-regression Model (VAR) used for determining the relationships between these variables are as follows:
ln ∑ ln ∑ ln 2 ∑ ln (4) ln ∑ ln ∑ ln 2 ∑ ln (5) ln 2 ∑ ln 2 ∑ ln ∑ ln (6)
At this point, β stand for coefficients that are about to be estimated, represents error term, is time 1, 2… 56 (that is different periods in between 1960 to 2016);" "denotes the most favorable lag length of every variable.
The functional part of the above equation demonstrates the interaction between the independent and dependent variables; the error term stands for all elements that influence monetary growth and price rate that is about to be explored in this research based on the main equation (4). Moreover, the study’s parameters are applied to approximate the variation concerning inflation rate and also the changes revolving around economic growth and distribution of money. As a result, the leading priority of this research is to check the availability of stationary in the series of LNRGDP, LNRM2, and LNCPI.
4.2.3 Unit Root Test
The Unit Root analysis is applied to determine the stability of three macroeconomic variables within this study. The above test is preferred because of two cogent purposes. First, this tool is used to hinder spurious regression issues. On the other hand, a common assumption underlying the use of causality analysis is that the time series in the query must be stationary. During the implementation of the above test, Phillips-Perron (PP) and Augmented Dickey-Fuller (1981) analysis are used to denote the stability of the existing variables.
4.2.3.1 Augmented Dickey-Fuller (ADF) Test and Philips Perron (PP) Test
ADF was conducted to determine the level of incorporation among the used variables. Which is based on the t-proportion of a regression to test for the non-stationary or non-stationary properties of the time series. In order to eliminate autocorrelation ADF test is included lagged term of the dependent variable. So a set of hypotheses is carried out by the test:
: series is non-stationary : Series is stationary
∆ ∑ ∆ (7)
The estimation of considered as the most important concern of the ADF test.
Where:
indicates to the number of lags included into the model to ensure the error terms are white noise, i.e., error terms have zero mean and constant variance through different time .