Doğuş Üniversitesi Dergisi, 18 (1) 2017, 99-114
(1, 2) Dokuz Eylül Üniversitesi, İşletme Fakültesi; [email protected] (2) Maastricht School of Management; [email protected]
Geliş/Received: 14-12-2015, Kabul/Accepted: 27-06-2016
Is There a Relationship between Country Classification and
Market Efficiency?: A Global Investigation
Ülke Sınıflandırması ile Piyasa Etkinliği Arasında Bir İlişki Var Mı?: Küresel Bir Çalışma
Berna KIRKULAK ULUDAĞ
(1), Hassan EZZAT
(2)ABSTRACT:The objective of this paper is to test the Efficient Market Hypothesis (EMH) for countries at different economic development levels. The FTSE Country Classification was used to reveal the economic development of 17 developed and 12 emerging markets. The sampling period is between 2005 and 2013. In order to test market efficiency, Portmanteau Q test, the runs test, the single and multiple variance ratio (VR) tests were used. The results show that the weak-form market efficiency is becoming prevalent in the Advanced Emerging markets. The striking finding of the paper presents that the market efficiency is associated with the market evolution. As the economies and markets of countries evolve and meet the criteria for promotion to upper country classification, they become weak-form efficient. Further, the findings reveal the facts that the markets which suffer from severe financial and political crises, or belong to low ranked emerging markets are unlikely to be efficient.
Keywords: market efficiency, market development JEL Classification Codes: G12, G14, G15
ÖZET
: Bu makalenin amacı farklı ekonomik gelişmişlik düzeyinde olan ülkeler için
Etkin Piyasa Hipotezini (EPH) test etmektir. Çalışmada 17’si gelişmiş ve 12’si gelişmekte olan ülkenin ekonomik gelişmişlik düzeyini göstermek için FTSE Ülke Sınıflandırması kullanılmıştır. Çalışmanın örneklem aralığı 2005ile 2013 yılları arasıdır. Piyasa etkinliğini test etmek için Portmanteau Q testi, runs testi, tekli ve çoklu varyans oranı testleri kullanılmıştır. Sonuçlar, gelişen piyasalar içerisinde ekonomik gelişmişliği daha iyi olan piyasaların zayıf formda etkin olduğunu göstermektedir. Çalışmanın en önemli bulgusu ise piyasaların ekonomik gelişmişlik seviyesi ile piyasa etkinliğinin yakından ilişkisi olduğudur. Piyasalar geliştikçe ve bir üst düzey gelişmişlik kademesine geçtikçe daha etkin hale gelmektedirler. Ayrıca, çalışmanın bulguları, finansal ve politik krizlerden etkilenen piyasalar ile daha az gelişmiş finansal piyasaların etkin piyasa olmaktan uzak olduğunu ortaya koymaktadır.Anahtar Kelimeler: piyasa etkinliği, piyasa gelişmişliği
1. Introduction
In the finance literature, one of the most widely applied and a tested theory is the Efficient Market Hypothesis (EMH) developed by Fama (1965, 1970). EMH argues that investors cannot beat or predict future stock prices since stock prices reflect all available information and that new information arises randomly. In this regard, the EMH is closely associated with the Random Walk Theory (RWT) which asserts that security prices are random and not influenced by past price changes. Hence, the stock prices cannot be predicted.
It is widely accepted that investment decisions of international investors are affected by stock market efficiencyalong with other factors. Numerous studies mainly test the
100 Berna KIRKULAK ULUDAĞ, Hassan EZZAT EMH in developed countries and currently, with increasing amount in the emerging countries. Empirical results on testing the efficiency of stock markets present mixed results not only across national stock markets but also within a particular market. While some studies present favorable evidence of the EMH (see for example Worthington and Higgs, 2004 for Europe; Chang and Ting, 2000 for Taiwan; Cheong, 2008 for Malaysia), a number of studies report evidence against the EMH (see for example, Ortiz and Arjona, 2001 for Latin America, Smith, 2008 for Middle East). In particular, the existing evidence on emerging markets is inconclusive and it is hard to make an overall conclusion whether or not emerging markets are weak-form efficient. As a matter of fact, the distinction between developed and emerging markets is necessary for EMH studies but is not sufficient to understand the diversity among emerging markets. The substantial differences in institutional infrastructure, market size, and liquidity make it difficult to put emerging markets in a single category. Since the level of economic development is not the same for emerging markets, one should not anticipate that in general, emerging markets are weak-form inefficient. Therefore, it is important to classify stock markets to capture the relationship between market efficiency and economic development level. This may also help to overcome the inconclusive EMH results regarding the large and diverse group of emerging markets to some extent.
The objective of this paper is to present a survey of global evidence regarding the EMH at different economic development levels. The contribution of the paper to the literature is twofold. First, our paper is not the first to study market efficiency across markets. However, it contributes to the literature by testing the EMH for the countries at different economic development levels. It is a particular interest of this paper to investigate whether different economic development levels exhibit same market efficiency. In order to achieve this task, we identify the countries according to their level of development. There are well-known international country development classifications including the World Bank, UNDP, IMF, FTSE, MSCI. However, there is no grounded taxonomy by which the classification is generally accepted. Setting a country classification for equity markets requires more than a focus on relative wealth. It would be a mistake to assume that high levels of relative national wealth are associated with developed equity markets. Indeed, the accessibility and openness of the equity markets are the key determinants for the country classification. Following the work of Hull and McGroarty (2014), we use the FTSE country classification as a proxy for development level. When it comes to equity markets, FTSE country classification is widely used, particularly by leading investment banks, asset and portfolio managers. Second, the current paper provides a comprehensive examination of market efficiency across 17 developed and 12 emerging markets, using the most recent data. The sampling period is from 2005 through 2013. Since financial markets evolve over the years, the market efficiency could change as a result of political, economic, social, technological and regulatory changes. Then it becomes important to test the market efficiency as a continuous on-going process. Among the existing EMH literature, some studies exhibit a particular attention on specific regions including Europe, Asia, Africa and Latin America. A few studies consider many countries together and analyzed the international level of efficiency or inefficiency. To the best of authors’ knowledge, this paper employs the most recent and comprehensive set of data from 30 stock markets in 29 countries in Europe, North and South America, Africa, Australia and Asia.
Is There a Relationship between Country Classification and Marketing Efficiency… 101 The empirical results show that while the evidence of weak-form efficiency for developed markets is inconclusive, the majority of the emerging markets with rapid economic development, referred to as Advanced Emerging markets, are weak-form efficient. Among the Secondary Emerging markets, the majority of the test results broadly agree that the random walk hypothesis is accepted for China. It is worth noting that there is a strong association between market efficiency and market evolution. As markets evolve and meet the criteria to get promoted to upper market classification, they are likely to be weak-form efficient. In this context, South Korea, Israel, and Turkey are found to be weak-form efficient. Further, the findings suggest that the markets of Egypt, the US, and Greece that suffered from political or financial crises, exhibit predictability and serial dependence in stock returns. Further, the results show that the lowest level of market efficiency is observed in Kuwait and Saudi Arabia in which the markets exhibit restrictions in their regulatory environments.
The rest of the paper is structured in the following way: Section 2 summarizes the relevant literature review; Section 3 presents the selected data; Section 4 exhibits the methodology used for the study; Section 5 presents the analysis of the empirical findings in detail; and Section 6 summarizes and concludes the study.
2. Literature Review
There are mixed results of the various tests for the EMH in different countries. There is no consensus among researchers due to the inconclusive results therein. In the literature, the majority of empirical papers examine the EMH in countries that are located in specific geographic regions or have similar economic development levels. Early studies investigated the EMH in developed markets and the evidence was, in general, in favor of the weak-form EMH (Fama and Macbeth, 1973; Jaffe, 1974; Lee, 1992; Chan et al, 1997). However, the recent studies report a controversial situation in the developed markets (Worthington and Higgs, 2004, 2009).
Emerging markets started to receive increasing attention following the liberalization policies in the stock markets in the late 1980s and early 1990s. Accordingly, international investors recognized the possibility of higher profits in emerging markets albeit with higher levels of risk, thus market efficiency became an important question in determining the appropriateness of investments in these markets. Among the emerging markets, Asian countries received greater interest due to the prominent growth in their economies. Hoque et al. (2007) test the market efficiency of eight Asian emerging markets including Hong Kong, Indonesia, Korea, Malaysia, the Philippines, Singapore, Taiwan, and Thailand. Their findings indicate that with the exception of Taiwan and Korea, the other markets present predictive behavior of stock prices. Çelik and Taş (2007) tested the weak form efficiency of 12 emerging markets between 1998-2007. Using the unit root and variance ratio tests, their results show that among the emerging markets investigated, the null hypothesis of weak-form efficiency was not rejected for the markets of South Korea and Turkey.
In Europe, the expansion of the European Union, transitions from a centrally planned economy to a free market and the consolidation of European equity markets lead to an increased interest to investigate the EMH among researchers. In a comprehensive study, Worthington and Higgs (2004) test random walks and weak-form market efficiency in sixteen developed and four emerging European equity markets. They apply several tests including serial correlation, runs tests, unit root tests and multiple
102 Berna KIRKULAK ULUDAĞ, Hassan EZZAT variance ratio tests. Their findings show that large equity markets in the developed markets exhibit weak-form efficiency. However, with the exception of Hungary, the other emerging markets are unlikely to be associated with the random walks. Some studies shift the interest towards emerging markets in Latin America. Ojah and Karemera (1999) test the market efficiency for Argentina, Brazil, Chile and Mexico using multiple variance ratio and auto-regressive fractionally integrated moving-average tests. They conclude that all markets tested follow a random walk and are generally weak-form efficient. In another study, Worthington and Higgs (2003) present contradictory results. They test weak-form market efficiency of seven Latin American markets and find that none of the analyzed markets follow a random walk and therefore are not weak-form efficient.
The markets of Africa and the Middle East received relatively less attention from researchers. These markets are described as pre-emerging or frontier markets due to low liquidity, weak market regulations, and inadequate financial reporting standards. Smith (2008) tests the random walk hypothesis for 11 African stock markets using joint variance ratio tests from 2000 to 2006 and rejects the random walk. Abdmoulah (2010) tests the weak-form efficiency of 11 Arab stock markets and finds a departure from weak-form efficiency.
Concerning the other studies performed in other countries, a recent study of Mobarek and Fiorante (2014) investigates the EMH in BRIC countries from 1995 through 2010 and their findings suggest that these markets exhibit weak-form efficiency from 2000 to 2010. In their paper, Jain et al (2013) examine the weak form of efficiency of the Indian capital market during the period of global financial crisis. The evidence indicates that the Indian equity market was weak-form efficient during the period of recession. Lim et al. (2013) investigate the efficiency of Shanghai and Shenzen stock markets in China and they accept the presence of random walk.
3. The Data Set
The data was obtained from Yahoo Finance (http://finance.yahoo.com/) and stock exchange websites for some countries (including Saudi Arabia and Kuwait). Data is exctracted from 30 stock exchanges in 29 countries. There are 2 stock exchanges from the United States in the dataset. The daily closing prices of national stock indices were used between 2005 and 2013. The only exception is the stock market of Saudi Arabia, where the investigation period was from the beginning of January 2007 till the end of July 2013. The markets are grouped according to FTSE Group classification which classifies the emerging markets as Developed (D), Advanced Emerging (AE), Secondary Emerging (SE), Watch List Emerging (WE), Frontier Market (F) and Stand Alone Market (SA). The classification is based on; economic size, wealth, quality of markets, depth of markets, and breadth of markets. During the sampling period, Israel and South Korea were promoted to Developed Market in 2008 and 2009 respectively. Turkey and Malaysia were promoted to Advanced Emerging Markets in 2011. Further, Argentina was demoted from Secondary Emerging to Frontier in 2010. The other countries classifications remained the same.
4. Methodology
In order to test the market efficiency and randomness, three tests of linear independence were used. These tests include Portmanteau Q test, the runs test and the
Is There a Relationship between Country Classification and Marketing Efficiency… 103 variance ratio (VR) test. Daily stock index returns are calculated as:
1 t t t P R ln P
, where and Pt and Pt-1 are closing prices of an index at time t and t – 1.
The efficient market hypothesis is associated with random walk hypothesis. The theory of random walk in stock prices state that the successive price changes are independent and the price changes conform to some probability distribution (Godfrey, 1964; Fama 1965).1 The random walk process is basically an AR(1) process and it can be modified to create a tendency to grow over time by adding a constant term to the model:
y
t
u
t
y
t1
t , εt ~ iid (1) wherey
t1denotes the price of a stock at time t-1,u
tis a drift constant and
tis a random disturbance term. Equation 1 is nonstationary process with unit root. The above process does not allow predicting the change (y
t
y
t1)
, where the change is absolutely random. If we take the first difference,
y
t
y
t
y
t1 (2) The first difference ofy
t is stationary and also completely random (not autocorrelated). The random walk process is given as:
y
t
u
t
1y
t1
t (3) Where
1
becomes stationary when first difference is taken.4.1. Portmanteau Q test
The portmanteau test is used to test the quality of fit of a time series model. The portmanteau tests are used for testing the autocorrelation in the residuals of a model. Ljung-Box (1978) test is a widely used portmanteau test that is used to figure out whether autocorrelations of the residual time series are different from zero. This test is used for overall randomness based on a number of lags rather than testing randomness at each distinct lag.
The focus of Partmanteau Q test is to understand whether or not the data exhibits serial correlation.The null hypothesis for Ljung-Box test is that the first m autocorrelations are jointly zero. The choice of m affects test performance. The Ljung-Box test statistic is given as follows:
QLB =
p jj
T
T
T
1 2ˆ
)
2
(
(4) where ˆ2 j is sample autocorrelation t lag k, and h is the number of lags being tested.
4.2. The Runs Test
A run test shows a sequence of consecutive price changes with the same sign. The runs test is used to examine whether or not the sequence of series of data is
1 See also Samuelson (1965), Shiller and Perron (1985), Lo and McKinlay (1988), Chan et al. (1996),
104 Berna KIRKULAK ULUDAĞ, Hassan EZZAT independent (Wald and Wolfowitz, 1940). The runs test is a non-parametric test that is designed to examine whether successive price changes are independent. The runs test provides information to decide if a data set is from a random process. The assumption of runs test states that if price changes are random, the actual number of runs should equal to expected number of runs (Fama, 1965). Under the null hypothesis, successive returns are serially independent. Hence, the expected total number of runs is normally distributed with a mean value. The formula for the runs test has been given by developed by Wallis and Roberts (1956) as follows:
3 2 1 1 i i N N n N
(5)
1 3 3 2 3 3 3 2 1 1 1 2 1 2 1 i i i i n N N N i n N N N
(6)where ni is the number of price changes each of sign (+,-). Serial independence is then determined by comparing the actual number of runs (R) with the expected number of runs ( ) in equation (1). The standardized variable (Z) for the runs test can be expressed as follows: Z
R 0.5
(7)If the number of runs is more or less than expected, the hypothesis of statistical independence can be rejected. When actual number of runs are higher than the expected runs, a positive (negative) z value is calculated. A negative Z value implies a positive serial correlation, whereas a positive Z value shows a negative serial correlation. The positive serial correlation implies a positive dependence of stock prices (Abraham, 2002; Guidi, 2011)
4.3 The Variance Ratio Test
The variance ratio test is the only way to test random walk process directly and has superiority over other tests. The variance ratio test does not require data to be normally distributed and they allow heteroskedasticity in the data (Lo and MacKinlay, 1988). The variance ratio test is based on the assumption that the variance of increments in the random-walk series is linear in the sample interval. This test is used to test the hypothesis that a given time series or its first difference is independent and follows a martingale difference sequence. Specifically, if a series follows a random-walk process, the variance of its q-differences would be q times the variance of its first differences. The variance ratio is calculated as follows:
Var R
t
R
t q
qVar R
t
R
t1
(8)
1
1 ( ) 1 . t t q t t t t Var R R Var R q q VR q Var R R q Var R (9)Is There a Relationship between Country Classification and Marketing Efficiency… 105 The single variance ratio tests the null hypothesis that the VR of the q-th lag should be approximately 1 in the case of linear independence indicating a random walk (𝐻0: 𝑉𝑅(𝑞) = 1). If the VR is significantly different from 1, linear independence and market randomness are rejected. Lo and MacKinlay derived asymptotic distributions for different specifications of the error term. The test statistic under the homoskedasticity assumption is calculated as follows:
1 ~ 0,1 VR q z q N q
(10)
1 2 2 2 1 1 3 q q q q nq (11)The other alternative was the test statistic Z*(q) under the assumption of heteroskedasticity of the error term. The test statistic under the heteroskedasticity assumption is calculated as follows:
* * 1 ~ 0,1 VR q z q N q , (12)
1 1 2 1 4 1 q t t t q q
(13) 1 1 2 1 1 2 2 2 1 1 ( ) ( ) ( ) nq j j j j t j t t nq j j j P P P P P P
(14)Chow and Denning (1993) developed a multiple variance ratio test that controls for the test size, and provides a multiple comparison of variance ratios. The Studentized Maximum Modulus (SMM) critical values are used to control for the test size and to create a confidence interval for the Variance Ratio estimates. The null hypothesis is formulated as
0 ( ) 1i
H VR q , in which (qi) are the different aggregation intervals
for
q i m
i 1,2,..., . The random walk hypothesis is rejected if VR q( i) is significantly
different from 1. In this case, only the maximum absolute value of test statistics is considered. The statistics are as follows:
1* 1 1 * 2 2 1 ( ) max ( ) , ( ) max ( ) . i i m i i m Z q Z q Z q Z q (15)
The confidence interval of at least 100(1-
) percent (%) for the *( )1 q
Z statistic is defined as SMM( , m,)and asymptotic critical values are calculated from the standard normal distribution as SMM(,m,)Z/2 where
106 Berna KIRKULAK ULUDAĞ, Hassan EZZAT
5. Empirical Findings
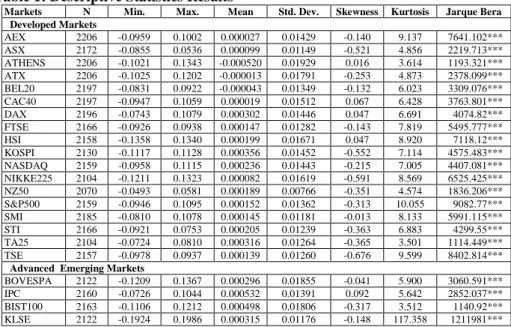
Table 1 presents a summary of descriptive statistics. The highest and the lowest stock returns are in Malaysia. Among the developed markets, the equity markets of Greece, Austria and Belgium present negative mean returns. On average, the equity markets of both secondary developed and advanced developed emerging markets exhibit higher mean returns than developed markets.
New Zealand is the least volatile developed market with standard deviation of 0.00796 and Kuwait has the lowest standard deviation among the emerging markets with a standard deviation of 0.00767. As expected, volatility is high in emerging markets, in particular those that are severely affected by a sudden shock or a financial crisis. The high standard deviations for Greece and Egypt reveal the increased volatility during the periods of economic and political instability. Greece suffered from the Eurozone crisis with a bankrupt government, a severe austerity program and a substantial bailout from the European Union. Two revolutions took place in Egypt during the period under investigation, one on the 25th of January 2011 and the second on the 30th of June 2013. These major events significantly contributed to the high standard deviations of returns for Greece and Egypt.
The distribution of most markets seems non-normal. The most negatively skewed is the market for Egypt with a skewness value of -0.934. The index for Saudi Arabia is the second most negatively skewed with a value of -0.902. The markets of Greece, Germany, Hong Kong, France and Mexico are slightly positively skewed. The kurtosis values range from 3.027 to 117.358. The highest kurtosis belongs to the Malaysian stock market with a value of 117.358. This extremely high kurtosis for Malaysian stock market is consistent with the findings of Shamiri and Isa (2009). The high kurtosis is associated with high volatility related to uncertainty. The Jarque-Bera test for normality is presented in Table 1. The null hypothesis of normal distribution is rejected at 1% significance level for all stock markets. This result indicates that the stock returns are not normally distributed.
Table 1: Descriptive Statistics Results
Markets N Min. Max. Mean Std. Dev. Skewness Kurtosis Jarque Bera
Developed Markets AEX 2206 -0.0959 0.1002 0.000027 0.01429 -0.140 9.137 7641.102*** ASX 2172 -0.0855 0.0536 0.000099 0.01149 -0.521 4.856 2219.713*** ATHENS 2206 -0.1021 0.1343 -0.000520 0.01929 0.016 3.614 1193.321*** ATX 2206 -0.1025 0.1202 -0.000013 0.01791 -0.253 4.873 2378.099*** BEL20 2197 -0.0831 0.0922 -0.000043 0.01349 -0.132 6.023 3309.076*** CAC40 2197 -0.0947 0.1059 0.000019 0.01512 0.067 6.428 3763.801*** DAX 2196 -0.0743 0.1079 0.000302 0.01446 0.047 6.691 4074.82*** FTSE 2166 -0.0926 0.0938 0.000147 0.01282 -0.143 7.819 5495.777*** HSI 2158 -0.1358 0.1340 0.000199 0.01671 0.047 8.920 7118.12*** KOSPI 2130 -0.1117 0.1128 0.000356 0.01452 -0.552 7.114 4575.483*** NASDAQ 2159 -0.0958 0.1115 0.000236 0.01443 -0.215 7.005 4407.081*** NIKKE225 2104 -0.1211 0.1323 0.000082 0.01619 -0.591 8.569 6525.425*** NZ50 2070 -0.0493 0.0581 0.000189 0.00766 -0.351 4.574 1836.206*** S&P500 2159 -0.0946 0.1095 0.000152 0.01362 -0.313 10.055 9082.77*** SMI 2185 -0.0810 0.1078 0.000145 0.01181 -0.013 8.133 5991.115*** STI 2166 -0.0921 0.0753 0.000205 0.01239 -0.363 6.883 4299.55*** TA25 2104 -0.0724 0.0810 0.000316 0.01264 -0.365 3.501 1114.449*** TSE 2157 -0.0978 0.0937 0.000139 0.01260 -0.676 9.599 8402.814***
Advanced Emerging Markets
BOVESPA 2122 -0.1209 0.1367 0.000296 0.01855 -0.041 5.900 3060.591*** IPC 2160 -0.0726 0.1044 0.000532 0.01391 0.092 5.642 2852.037*** BIST100 2163 -0.1106 0.1212 0.000498 0.01806 -0.317 3.512 1140.92*** KLSE 2122 -0.1924 0.1986 0.000315 0.01176 -0.148 117.358 1211981***
Is There a Relationship between Country Classification and Marketing Efficiency… 107 TSEC 2116 -0.0673 0.0652 0.000131 0.01316 -0.377 3.027 852.7216***
Secondary Emerging Markets
BSE 2120 -0.1160 0.1599 0.000507 0.01651 -0.108 7.450 4880.081*** EGX30 2072 -0.1798 0.0731 0.000351 0.01881 -0.934 6.887 4373.322***
Watch List Emerging
JKSE 2097 -0.1095 0.0762 0.000728 0.01501 -0.675 6.708 4069.135*** SSE 2152 -0.0925 0.0903 0.000210 0.01722 -0.320 3.528 1145.628*** KSE 2214 -0.0387 0.0504 0.000104 0.00796 -0.591 4.399 1903.779*** Frontier MERV 2197 -0.1295 0.1043 0.000420 0.01858 -0.563 5.171 2549.929*** Stand Alone TASI 1647 -0.1032 0.0908 -0.000004 0.01513 -0.902 9.613 6521.123***
Note: The abbreviations are used for stock exchange indices. AEX: Holland, ASX: Australia, ATX: Austria, ATHEX: Greece, BEL20: Belgium, CAC40: France, DAX: Germany, FTSE: United Kingdom,
HIS: Hong Kong, KOSPI: South Korea, NASDAQ: USA, NIKKEI 225: Japan, NZ 50 SMI: New
Zealand, SMI: Switzerland, STI: Singapore, TA 25:Israel, TSE: Canada, BOVESPA: Brazil, IPC: Mexico, BIST 100: Turkey, KLSE: Malaysia, TSEC: Taiwan, BSE 30: India, EGX 30: Egypt, JKSE: Indonesia, SSE: China(Shanghai), KSE: Kuwait, MERVAL: Argentina, TASI: Saudi Arabia. Significance levels: *** = 1%, ** = 5%, * = 10%.
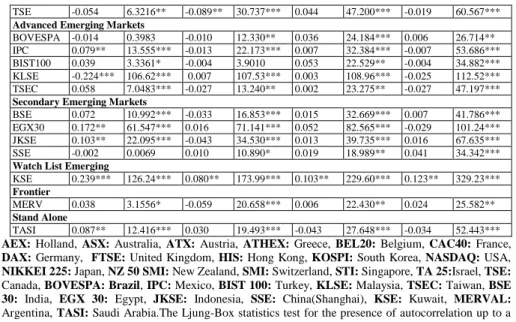
The predictability test results based on Portmanteau Q test. The Ljung-Box statistics up to 15 lags are presented in Table 2. The Ljung-Box test determines whether the serial-correlation coefficients are significantly different from zero. The results provide the evidence of autocorrelation at different lag levels. While the developed and advanced emerging markets suffer from negative autocorrelation (mean reversion), secondary emerging, watch list and stand alone markets suffer from positive autocorrelation (persistence).The occurrence of positive correlation in the emerging markets indicates persistence or predictability of the returns. The markets of Holland, France, Switzerland, Canada, India, Malaysia, Egypt, Indonesia, Kuwait, Saudi Arabia display significant autocorrelation patterns at all lags.
The Ljung-Box Q-statistics is used to test the joint hypotheses that all the autocorrelation coefficients are equal to zero. It is evident from test statistics that the null hypothesis cannot be rejected at any lag level for Australia, Korea, Japan, and Israel index returns. With the exception of these countries, all developed and emerging markets display signs of predictability. The Netherlands, Belgium, Germany, Singapore, and Switzerland in the developed markets along with Turkey and China in the advanced emerging markets show predictability for the higher lags.
Table 2: Results for Portmanteau Q test
Q(1) Q(5) Q(10) Q(15)
ACF Q-Stat ACF Q-Stat ACF Q-Stat ACF Q-Stat
Developed Markets AEX -0.023 1.1245 -0.066** 16.646*** 0.014 26.097*** 0.069** 40.609*** ASX -0.025 1.3096 0.007 8.1049 0.015 13.041 -0.006 16.662 ATHENS 0.061 8.0953*** 0.013 13.572** 0.012 22.998** -0.011 44.375*** ATX 0.068 9.8034*** -0.010 16.014*** -0.003 17.727* 0.026 26.506** BEL20 0.030 2.0089 -0.024 12.255** -0.049 25.244*** -0.032 31.489*** CAC40 -0.047 4.8266** -0.066** 32.709*** -0.008 41.690*** -0.025 44.675*** DAX 0.003 0.0208 -0.052 0.006*** 0.038 21.086** -0.021 24.484* FTSE -0.051 5.5992** -0.060 40.788*** 0.021 50.532*** -0.018 53.474*** HSI -0.036 2.8501* -0.027 9.1458 -0.062 23.756*** 0.045 44.099*** KOSPI 0.019 0.7947 -0.034 6.8286 0.008 9.0795 -0.014 14.401 NASDAQ -0.084** 15.232*** -0.032 26.560*** 0.048 32.288*** -0.039 42.256*** NIKKE225 -0.046 4.4518** -0.017 6.2364 0.033 9.1486 0.036 12.391 NZ50 0.065 8.8535*** 0.028 16.178*** 0.020 25.776*** -0.021 28.406** S&P500 -0.166** 29.291*** -0.052 47.950*** 0.051 57.783*** -0.046 71.326*** SMI 0.023 1.1309 -0.086** 40.938*** 0.035 50.699*** -0.042 59.536*** STI -0.007 0.1207 0.024 7.2604 0.044 19.293** 0.003 47.675*** TA25 0.003 0.0238 0.012 3.2393 -0.013 12.601 -0.019 21.493
108 Berna KIRKULAK ULUDAĞ, Hassan EZZAT TSE -0.054 6.3216** -0.089** 30.737*** 0.044 47.200*** -0.019 60.567*** Advanced Emerging Markets
BOVESPA -0.014 0.3983 -0.010 12.330** 0.036 24.184*** 0.006 26.714** IPC 0.079** 13.555*** -0.013 22.173*** 0.007 32.384*** -0.007 53.686*** BIST100 0.039 3.3361* -0.004 3.9010 0.053 22.529** -0.004 34.882*** KLSE -0.224*** 106.62*** 0.007 107.53*** 0.003 108.96*** -0.025 112.52*** TSEC 0.058 7.0483*** -0.027 13.240** 0.002 23.275** -0.027 47.197*** Secondary Emerging Markets
BSE 0.072 10.992*** -0.033 16.853*** 0.015 32.669*** 0.007 41.786*** EGX30 0.172** 61.547*** 0.016 71.141*** 0.052 82.565*** -0.029 101.24*** JKSE 0.103** 22.095*** -0.043 34.530*** 0.013 39.735*** 0.016 67.635*** SSE -0.002 0.0069 0.010 10.890* 0.019 18.989** 0.041 34.342*** Watch List Emerging
KSE 0.239*** 126.24*** 0.080** 173.99*** 0.103** 229.60*** 0.123** 329.23*** Frontier
MERV 0.038 3.1556* -0.059 20.658*** 0.006 22.430** 0.024 25.582** Stand Alone
TASI 0.087** 12.416*** 0.030 19.493*** -0.043 27.648*** -0.034 52.443*** AEX: Holland, ASX: Australia, ATX: Austria, ATHEX: Greece, BEL20: Belgium, CAC40: France, DAX: Germany, FTSE: United Kingdom, HIS: Hong Kong, KOSPI: South Korea, NASDAQ: USA, NIKKEI 225: Japan, NZ 50 SMI: New Zealand, SMI: Switzerland, STI: Singapore, TA 25:Israel, TSE:
Canada, BOVESPA: Brazil, IPC: Mexico, BIST 100: Turkey, KLSE: Malaysia, TSEC: Taiwan, BSE
30: India, EGX 30: Egypt, JKSE: Indonesia, SSE: China(Shanghai), KSE: Kuwait, MERVAL:
Argentina, TASI: Saudi Arabia.The Ljung-Box statistics test for the presence of autocorrelation up to a specified lag distributed Chi-square (df = # of lag). Significance levels: *** = 1%, ** = 5%, * = 10%.
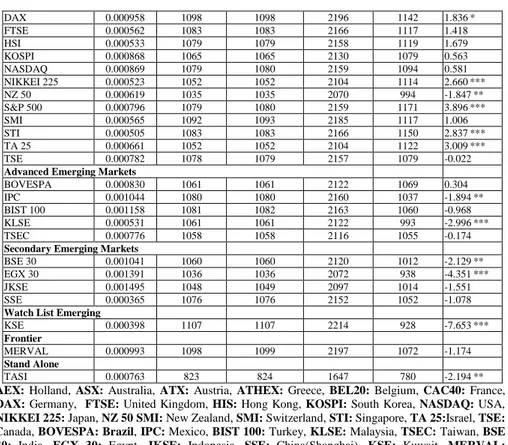
Table 3 presents the runs test results for the classified markets. Case < mean indicates the number of cases below the mean, while Case ≥ mean denotes the number greater than or equal to the mean. With the exception of Holland, Austria, Belgium, UK, US (Nasdaq), Switzerland, Canada, Brazil, Turkey, Taiwan, Indonesia, China and Argentina, null hypothesis of return independence has been rejected for all the indices. The null hypothesis is accepted for 7 out of 17 developed markets, 3 out of 5 advanced emerging markets, 2 out of 4 secondary emerging markets. The markets that fail to reject the null hypothesis suggests that the sequence of returns series is independent. The findings further show positive and significant Z values for the markets of France, Hong Kong, Japan, the S&P, Singapore, and Israel. The number of runs for these markets exceeds the number of expected runs.
For the emerging markets, the opposite is true. The findings indicate negative significant Z values for most of the emerging markets including Turkey, Mexico, Egypt, Malaysia, Kuwait and Saudi Arabia. The negative and significant Z-values indicate that the actual number of runs are smaller than the expected number of runs under the null hypothesis of return independence
Overall, the number of stock indices with significant negative Z values is higher than those with significant positive Z values. In particular, the runs test results are consistent with serial correlation results for the markets of Austria, Belgium, the UK, Brazil, Turkey, Taiwan, China and Argentina.
Table 3: Runs Test Results
Markets Test Value(a) Cases < Test Value Cases ≥ Test Value
Total Cases Number of
Runs Z Developed Markets AEX 0.000482 1103 1103 2206 1103 -0.043 ASX 0.000590 1086 1086 2172 1163 3.262*** ATHEX 0.000000 1043 1163 2206 1023 -3.321*** ATX 0.000692 1103 1103 2206 1067 -1.576 BEL20 0.000308 1098 1099 2197 1101 0.064 CAC40 0.000335 1098 1099 2197 1181 3.478***
Is There a Relationship between Country Classification and Marketing Efficiency… 109 DAX 0.000958 1098 1098 2196 1142 1.836* FTSE 0.000562 1083 1083 2166 1117 1.418 HSI 0.000533 1079 1079 2158 1119 1.679 KOSPI 0.000868 1065 1065 2130 1079 0.563 NASDAQ 0.000869 1079 1080 2159 1094 0.581 NIKKEI 225 0.000523 1052 1052 2104 1114 2.660*** NZ 50 0.000619 1035 1035 2070 994 -1.847** S&P 500 0.000796 1079 1080 2159 1171 3.896*** SMI 0.000565 1092 1093 2185 1117 1.006 STI 0.000505 1083 1083 2166 1150 2.837*** TA 25 0.000661 1052 1052 2104 1122 3.009*** TSE 0.000782 1078 1079 2157 1079 -0.022
Advanced Emerging Markets
BOVESPA 0.000830 1061 1061 2122 1069 0.304 IPC 0.001044 1080 1080 2160 1037 -1.894** BIST 100 0.001158 1081 1082 2163 1060 -0.968 KLSE 0.000531 1061 1061 2122 993 -2.996***
TSEC 0.000776 1058 1058 2116 1055 -0.174
Secondary Emerging Markets
BSE 30 0.001041 1060 1060 2120 1012 -2.129** EGX 30 0.001391 1036 1036 2072 938 -4.351***
JKSE 0.001495 1048 1049 2097 1014 -1.551
SSE 0.000365 1076 1076 2152 1052 -1.078
Watch List Emerging
KSE 0.000398 1107 1107 2214 928 -7.653***
Frontier
MERVAL 0.000993 1098 1099 2197 1072 -1.174 Stand Alone
TASI 0.000763 823 824 1647 780 -2.194**
AEX: Holland, ASX: Australia, ATX: Austria, ATHEX: Greece, BEL20: Belgium, CAC40: France, DAX: Germany, FTSE: United Kingdom, HIS: Hong Kong, KOSPI: South Korea, NASDAQ: USA, NIKKEI 225: Japan, NZ 50 SMI: New Zealand, SMI: Switzerland, STI: Singapore, TA 25:Israel, TSE:
Canada, BOVESPA: Brazil, IPC: Mexico, BIST 100: Turkey, KLSE: Malaysia, TSEC: Taiwan, BSE
30: India, EGX 30: Egypt, JKSE: Indonesia, SSE: China(Shanghai), KSE: Kuwait, MERVAL:
Argentina, TASI: Saudi Arabia.Significance levels: *** = 1%, ** = 5%, * = 10%.
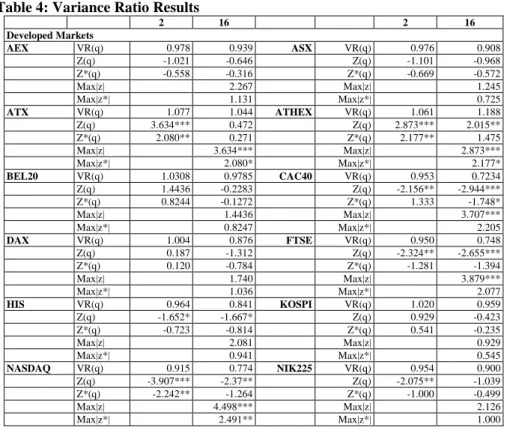
Table 4 presents the predictability results based on single and the multiple variance ratio tests. The findings display the estimates of the variance ratios Vr(q), asymptotic Z and Z* statistics under homoskedasticity and heteroskedasticity over two holding periods, q=2 and 16 days. Under the multiple variance ratios (Chow and Denning) procedure, the maximum absolute values of test statistics are examined. If the maximum absolute values of the test statistics exceed the critical value, the null hypothesis of a random walk is rejected.
The results are mixed. The single variance ratio test does not provide consistent results at different holding periods.2 Further, while the null hypothesis of a homoskedastic random walk is rejected, the hypothesis of a heteroskedastic random walk is not rejected. According to the single variance ratio test results, the null hypothesis of a homoskedastic random walk is rejected for Japan, Canada, Hong Kong, Turkey, Brazil, and Malaysia. It appears that these stock markets are weak-form inefficient. However, the heteroskedastic robust statistic is insignificant for these markets at all lags. This shows that rejection of random walk for these markets is due to conditional heteroskedasticity.
2We calculated the variance ratio tests for the holding periods of 4 and 8 as well. Due to the space constrain,
we could not present the results. The findings for the holding periods of 4 and 8 resemble the findings for the period of 16. In most cases, the null hypothesis of random walk hypothesis is rejected.
110 Berna KIRKULAK ULUDAĞ, Hassan EZZAT The random walk hypothesis for the majority of the equity market indices including Austria, Greece, France, UK, USA, New Zealand, Switzerland, Canada, Brazil, Malaysia, Taiwan, India, Indonesia, Argentina, Mexico, Egypt, Kuwait, and Saudi Arabia are rejected at different lags and at different significance levels. In particular, market randomness for Kuwait and Egypt is strongly rejected at 1% significance level by both single and multiple variance ratio tests. Positive serial correlation exists for the markets of Austria, Greece, New Zealand, Switzerland, Taiwan, India, Indonesia, Kuwait, Argentina, Mexico, Egypt, and Saudi Arabia when the null hypothesis of the random walk is rejected and variance ratio is greater than one. Negative serial correlation exists for the markets of France, UK, Canada, Brazil, and Malaysia when the null hypothesis of the random walk is rejected and variance ratio is smaller than one. This indicates a mean reverting process. However, there are only few markets where both the single and multiple variance ratio tests provide inconsistent results. While the single variance ratio test rejects the random walk hypothesis, multiple variance ratio test supports the random walk hypothesis for the markets including Holland, Hong Kong, Japan, and Turkey.
Both single and multiple variance ratio tests reveal the fact that among the developed markets, Australia, Belgium, Germany, South Korea and Singapore are weak form efficient. The findings show that both homoskedastic and heteroskedastic statistics including the maximum absolute values are insignificant at all holding periods. The variance ratios are greater than one for different time intervals and thus show the presence of significant positive autocorrelations in the stock returns. Among the emerging markets, only the Chinese market is weak-form efficient. The presence of random walk is accepted, as the test statistic is lower than the critical value.
Table 4: Variance Ratio Results
2 16 2 16 Developed Markets AEX VR(q) 0.978 0.939 ASX VR(q) 0.976 0.908 Z(q) -1.021 -0.646 Z(q) -1.101 -0.968 Z*(q) -0.558 -0.316 Z*(q) -0.669 -0.572 Max|z| 2.267 Max|z| 1.245 Max|z*| 1.131 Max|z*| 0.725 ATX VR(q) 1.077 1.044 ATHEX VR(q) 1.061 1.188 Z(q) 3.634*** 0.472 Z(q) 2.873*** 2.015** Z*(q) 2.080** 0.271 Z*(q) 2.177** 1.475 Max|z| 3.634*** Max|z| 2.873*** Max|z*| 2.080* Max|z*| 2.177* BEL20 VR(q) 1.0308 0.9785 CAC40 VR(q) 0.953 0.7234 Z(q) 1.4436 -0.2283 Z(q) -2.156** -2.944*** Z*(q) 0.8244 -0.1272 Z*(q) 1.333 -1.748* Max|z| 1.4436 Max|z| 3.707*** Max|z*| 0.8247 Max|z*| 2.205 DAX VR(q) 1.004 0.876 FTSE VR(q) 0.950 0.748 Z(q) 0.187 -1.312 Z(q) -2.324** -2.655*** Z*(q) 0.120 -0.784 Z*(q) -1.281 -1.394 Max|z| 1.740 Max|z| 3.879*** Max|z*| 1.036 Max|z*| 2.077 HIS VR(q) 0.964 0.841 KOSPI VR(q) 1.020 0.959 Z(q) -1.652* -1.667* Z(q) 0.929 -0.423 Z*(q) -0.723 -0.814 Z*(q) 0.541 -0.235 Max|z| 2.081 Max|z| 0.929 Max|z*| 0.941 Max|z*| 0.545 NASDAQ VR(q) 0.915 0.774 NIK225 VR(q) 0.954 0.900 Z(q) -3.907*** -2.37** Z(q) -2.075** -1.039 Z*(q) -2.242** -1.264 Z*(q) -1.000 -0.499 Max|z| 4.498*** Max|z| 2.126 Max|z*| 2.491** Max|z*| 1.000
Is There a Relationship between Country Classification and Marketing Efficiency… 111 NZ50 VR(q) 1.066 1.255 S&P500 VR(q) 0.883 0.686 Z(q) 3.013*** 2.637*** Z(q) -5.389*** -3.310*** Z*(q) 1.697* 1.402 Z*(q) -2.887*** -1.559 Max|z| 3.013*** Max|z| 6.093*** Max|z*| 1.976* Max|z*| 3.063*** SMI VR(q) 1.023 0.784 STI VR(q) 0.993 1.120 Z(q) 1.104 -2.287** Z(q) -0.308 1.270 Z*(q) 0.484 -1.109 Z*(q) -0.184 0.708 Max|z| 2.693* Max|z| 1.270 Max|z*| 1.251 Max|z*| 0.708 TA25 VR(q) 1.004 0.991 TSE VR(q) 0.945 0.783 Z(q) 1.202 -0.085 Z(q) -2.509** -2.286** Z*(q) 0.126 -0.056 Z*(q) -1.066 -1.049 Max|z| 0.586 Max|z| 3.162*** Max|z*| 0.381 Max|z*| 1.392
Advanced Emerging Markets
BOVSPA VR(q) 0.986 0.781 IPC VR(q) 1.079 0.947 Z(q) -0.606 -2.290** Z(q) 3.709*** -0.549 Z*(q) -0.392 -1.293 Z*(q) 2.493** -0.338 Max|z| 2.961** Max|z| 3.709*** Max|z*| 1.692 Max|z*| 2.497** BIST100 VR(q) 1.040 1.074 KLSE VR(q) 0.776 0.652 Z(q) 1.874* 0.784 Z(q) -10.29*** -3.636*** Z*(q) 1.448 0.593 Z*(q) -1.341 -1.066 Max|z| 1.963 Max|z| 10.297*** Max|z*| 1.509 Max|z*| 1.343
Secondary Emerging Markets
TSEC VR(q) 1.058 1.081 EGX30 VR(q) 1.172 1.555 Z(q) 2.684*** 0.846 Z(q) 7.833*** 5.738*** Z*(q) 2.085** 0.625 Z*(q) 4.431*** 3.984*** Max|z| 2.839** Max|z| 7.883*** Max|z*| 2.183* Max|z*| 4.810*** BSE 30 VR(q) 1.073 1.069 SSE VR(q) 0.998 1.185 Z(q) 3.362*** 0.724 Z(q) -0.053 1.955* Z*(q) 2.227** 0.454 Z*(q) -0.040 1.522 Max|z| 3.362*** Max|z| 1.955 Max|z*| 2.229** Max|z*| 1.522 JKSE VR(q) 1.103 1.099 Z(q) 4.752*** 1.039 Z*(q) 2.622*** 0.606 Max|z| 5.052*** Max|z*| 2.907**
Watch List Emerging
KSE VR(q) 1.239 2.390 Z(q) 11.272*** 14.856*** Z*(q) 6.733*** 9.559***
Max|z| 14.856***
Max|z*| 9.559***
Frontier Stand Alone
MERV VR(q) 1.037 1.182 TASI VR(q) 1.087 1.282
Z(q) 1.762* 1.937* Z(q) 3.569*** 2.599*** Z*(q) 1.041 1.187 Z*(q) 1.917* 1.340
Max|z| 3.415*** Max|z| 4.252***
Max|z*| 2.053 Max|z*| 1.087 1.282
AEX: Holland, ASX: Australia, ATX: Austria, ATHEX: Greece, BEL20: Belgium, CAC40: France, DAX: Germany, FTSE: United Kingdom, HIS: Hong Kong, KOSPI: South Korea, NASDAQ: USA, NIKKEI 225: Japan, NZ 50 SMI: New Zealand, SMI: Switzerland, STI: Singapore, TA 25:Israel, TSE:
Canada, BOVESPA: Brazil, IPC: Mexico, BIST 100: Turkey, KLSE: Malaysia, TSEC: Taiwan, BSE
30: India, EGX 30: Egypt, JKSE: Indonesia, SSE: China(Shanghai), KSE: Kuwait, MERVAL:
Argentina, TASI: Saudi Arabia. Under the random walk null hypothesis, the value of the variance ratio test is 1 and the test statistics have a standard normal distribution (asymptotically).Significance levels: * = 1%, ** = 5%, *** = 10%. VR (q) denotes variance ratio estimates. Z(q) assuming homoskedasticity and Z*(q) assuming heteroskedasticity.
112 Berna KIRKULAK ULUDAĞ, Hassan EZZAT
6. Summary and Conclusion
In this paper, we attempt to test the Efficient Market Hypothesis (EMH) for countries at different economic development levels. The term “Emerging Markets” definition is too broad to accurately describe fast-and-slow-growing countries, and the diversity among emerging stock markets makes it difficult to place all emerging markets into the same basket. The reality is that emerging markets are changing rapidly and each of these economies faces its own set of challenges. Therefore, we classify the markets using the FTSE Country Classification which breaks down stock market indices according to their development level such as ‘Developed’, ‘Advanced Emerging’, ‘Secondary Emerging’, ‘Watch List’ , ‘Frontier’ and ‘Stand Alone’. The paper provides a comprehensive survey of 30 stock markets in 29 countries. The sampling period is from 2005 through 2013.
The findings show that the random walk hypothesis is accepted for Belgium, Germany, Australia, South Korea, Israel, Singapore, Turkey, and China with high confidence. These countries satisfy most of the stringent requirements of the serial correlation, runs, single and multiple variance ratio tests. In particular, Far East Asian countries have the most consistency in the empirical results. On the other hand, Egypt, the S&P, and Greece are found to be inefficient markets by all tests applied. This can be attributed to volatility, financial and political instability. These were the countries which were the origin of the Egyptian Revolution, the Sup-prime Mortgage Crisis, and the Euro zone Crisis. Further, the findings indicate that the market returns of Watch List Emerging and Stand Alone countries are found to be more predictable than Advanced and Secondary Emerging Markets. The lowest level of market efficiency is observed in Kuwait and Saudi Arabia in which the markets are less accessible to foreign investors and exhibit restrictions in their regulatory environments.
When the economic development level is taken into account, the evidence of weak-form efficiency for developed markets is inconclusive. Since South Korea and Israel were promoted to developed markets in 2008 and in 2009 respectively, it is difficult to conclude that the majority of the developed markets are associated with market efficiency. On the other hand, the majority of Advanced Emerging markets exhibit greater evidence of market efficiency. The test results provide the most consistency for Turkey which has modernized its economy significantly over a 10-year period. Further, the findings report that the majority of Secondary Emerging markets exhibit market inefficiency. Only China satisfies the stringent requirements of weak-form market efficiency for almost all tests. This implies that a successful transition holds the promise of market efficiency, especially in massive economies like China. The striking finding of this paper is that the countries which are promoted to upper market classifications are likely to be weak-form efficient. The market efficiency is associated with the market evolution. As the economies and markets of the countries evolve and meet the criteria for promotion, these markets are likely to become weak-form efficient. As promoted countries are facing many challenges in terms of transparency of information and the effectiveness of regulations, the market efficiency can be attributed to the economic reforms undertaken and the successful transition. During the sampling period, Israel and South Korea were promoted to Developed Market in 2008 and 2009 respectively. Turkey and Malaysia were promoted to Advanced Emerging Markets in 2011. With the exception of Malaysia, all the promoted markets are weak-form efficient. In spite of its promotion, the descriptive
Is There a Relationship between Country Classification and Marketing Efficiency… 113 statistics shows that the Malaysian market appears to be volatile. Given the importance of market evolution, investors should keep a close eye on the markets that are promoted or are soon to be promoted.
Since financial markets evolve over years, the market efficiency could change as a result of political, economic, social, technological and regulatory changes. It would be also interesting to extend this study and examine the market efficiency of promoted or demoted countries in the future.
7. References
Abdmoulah, W. (2010). Testing the Evolving Efficiency of Arab Stock Markets, International
Review of Financial Analysis, 19, 25-34.
Abraham, A., Seyyed, F,J, and S.A. Alsakran, S.A. (2002),.Testing the Random Walk Behaviour and Efficiency of the Gulf Stock Markets, The Financial Review, 37(3): 469–80.
Bollerslev, T. (1986). Generalized Conditional Heteroskedasticity, Journal of Econometrics, 31, 307-315.
Çelik,T.T. ve Taş, O. (2007). Etkin piyasa hipotezi ve gelişmekte olan hisse senedi piyasaları, İTÜ Dergisi/b, Sosyal Bilimler Cilt:4, Sayı:2, 11-22
Campbelll, J., LO, A., and MACKINLAY, A. C. (1997). The Econometrics of Financial Markets. Princeton: Princeton University Press.
Chan, K. C., Jegadeesh, N. and Lakonıshok, J. (1996), Momentum strategies, The Journal of
Finance 51(5), 1681– 1713.
Chan, K.C., Gup, B.E., and Pan, M.S. (1997). International Stock Market Efficiency and Integration: A study of Eighteen Nations, Journal of Business Finance and Accounting, 24(6), 803-
Chang, K. and Ting, K. (2000). A Variance Ratio Test of the Random Walk Hypothesis for Taiwan’s Stock Market, Applied Financial Economics, 10, 525-32.
Cheong, C.W. (2008). A sectoral efficiency analysis of Malaysian stock exchange under structural break, American Journal of Applied Sciences, 5, 1291-1295
Chow, K.V. and Denning, K.C. (1993). A simple multiple variance ratio test, Journal of
Econometrics 58, 385–401.
Engle, R. F., Lilien,D.M., and Robıns,R.P. (1987). Estimating Time Varying Risk Premia in the Term Structure: The ARCH-M Model, Econometrica, 55, 391–407.
Fama, E. F. (1965). The Behavior of Stock Market Prices, The Journal of Business, 38 (1), 34-105.
Fama, E. F. (1970). Efficient Capital Markets: A Review of Theory and Empirical Work,
Journal of Finance, 25, 383-417.
Fama, E. F. and Macbeth, J. (1973). Risk, Return and Equilibrium: Empirical Tests, Journal of
Political Economy, 81 (3) 607-636.
FTSE (2013).FTSE Global Equity Index Series Country Classification.
Godfrey, M. D., Granger, C. W. J. and Morgenstern, O. (1964), The random walk hypothesis of stock market behavior, Kyklos 17(1), 1–30.
Guidi, F., Gupta, R., and Maheshwari, R. (2011). Weak-form Market Efficiency and Calendar Anomalies for Eastern Europe Equity Markets, Journal of Emerging Market Finance, 10(3), 337-389.
Hassan, K. M., Haque, M., and Lawrence, S. (2006). An Empirical Analysis of Emerging Stock Markets of Europe, Quarterly Journal of Business and Economics, 45(1&2), 31-52. Hoque, H. A., Kım, J. H., and Pyun, C. S. (2007). A Comparison of Variance Ratio Tests of Random Walk: A Case of Asian Emerging Markets, International Review of Economics
and Finance, 16, 488-502.
Hull, M. and Mcgroarty, F. (2014). Do emerging markets become more efficient as they develop? Long memory persistence in equity indices, Emerging Markets Review, 18, 45-61.
114 Berna KIRKULAK ULUDAĞ, Hassan EZZAT Jain, P., Vyas,V. and Roy, A. (2013). A study on weak form of market efficiency during the period of global financial crisis in the form of random walk on Indian capital market,
Journal of Advances in Management Research, 10(1), 122-138.
Lee, U. (1992). Do stock prices follow random walk? Some international evidence,
International Review of Economics and Finance, 1(4), 315-327.
Lim, T.C., Huang, W., Yun, J.L.X, And Zhao, D. (2013). Has stock Market efficiency improved? Evidence from China, Journal of Finance & Economics, 1(1), 1-9. Ljung G.M, Box G.E. (1978) On a measure of lack of fit in time series
models. Biometrika 65: 297–303.
Lo, A. and Mackinlay, A. C. (1988). Stock Market Prices Do not Follow Random Walks. Evidence from a Simple Specification Test, Review of Financial Studies, 1 (1), 41-66. Mobarek, A. and Fiorante, A. (2014). The prospects of BRIC countries: Testing weak-form
market efficiency, Research in International Business and Finance, 30, 217-232. Ojah, K., And Karemera, D. (1999). Random Walk and Market Efficiency Tests of Latin
American Emerging Equity Markets: A Revisit, The Financial Review, 34 (2), 57-72. Ortiz, E., and Arjona, E. (2001). Heteroskedastic behavior of the Latin American Emerging
Markets, International Review of Financial Analysis, 10, 287-305.
Ojah, K., and Karemera, D. (1999). Random Walk and Market Efficiency Tests of Latin American Emerging Equity Markets: A Revisit, The Financial Review, 34 (2), 57-72. Ortiz, E., and Arjona, E. (2001). Heteroskedastic behavior of the Latin American Emerging
Markets, International Review of Financial Analysis, 10, 287-305.
Samuelson, P. A. (1965), Proof that properly anticipated prices fluctuate randomly, Industrial
Management Review 6(2), 41–49.
Shamiri, A. and Isa, Z. (2009). Modeling and forecasting volatility of the Malaysian stock markets. Journal of Mathematics and Statistics, 5(3), 234-240. DOI: 10.3844/jmssp.2009.234.240
Shiller, R. J. and Perron, P. (1985) Testing the random walk hyporhesis: power versus frequency of observation, Economics Letters 18, 381-386.
Smith, G. (2008). Liquidity and the Informational Efficiency of African Stock Markets, South
African Journal of Economics, 76 (2), 161-175.
Wald, A. and Wolfowıtz, J. (1940). On a Test Whether Two Samples are from the Same Population, The Annals of Mathematical Statistics, 11, (2), 147-162.
Wallıs, W. and Roberts, H. (1956). Statistics: A New Approach, Free Press, Glencoe Illinois, U.S.
Worthington, A.C. and Higgs, H. (2003). Weak-form market efficiency in European emerging and developed stock markets, In: Discussion Paper No. 159. Queensland University of Technology.
Worthıngton, A. C. and Higgs, H. (2004). Random Walks and Market Efficiency in European Equity Markets, Global Journal of Finance and Economics, 1 (1), 59-78.
Worthington, A. C. and Higgs, H. (2009). Efficiency in the Australian stock market 1875-2006: A note on extreme long-run random walk behaviour, Applied Economics Letters, vol.16, no. 3, pp. 301-306.