T.C.
BAHÇEŞEHİR ÜNİVERSİTESİ
STOCK VALUATION BY DISCOUNTED CASH
FLOW ANALYSIS AND AN APPLICATION
Yüksek Lisans Tezi
MUSTAFA KEÇELİ
T.C.
BAHÇEŞEHİR ÜNİVERSİTESİ
SOSYAL BİLİMLER ENSTİTÜSÜ
CAPITAL MARKETS AND FINANCE
STOCK VALUATION BY DISCOUNTED CASH
FLOW ANALYSIS AND AN APPLICATION
Yüksek Lisans Tezi
MUSTAFA KEÇELİ
Tez Danışmanı: Prof. Dr. Niyazi BERK
T.C.
BAHÇEŞEHİR ÜNİVERSİTESİ
SOSYAL BİLİMLER ENSTİTÜSÜ SERMAYE PİYASASI FİNANS PROGRAMI
Tezin Adı: Stock Valuation by Discounted Cash Flow Analysis and An Application
Öğrencinin Adı Soyadı: Mustafa Keçeli Tez Savunma Tarihi: 04.02.2013
Bu tezin Yüksek Lisans tezi olarak gerekli şartları yerine getirmiş olduğu Enstitümüztarafından onaylanmıştır.
Yrd.Doç. Dr. Burak Küntay Enstitü Müdürü
---
Bu tezin Yüksek Lisans tezi olarak gerekli şartları yerine getirmiş olduğu Enstitümüz tarafından onaylanmıştır.
Assist. Prof. Hakkı Öztürk Program Koordinatörü
---
Bu Tez tarafımızca okunmuş, nitelik ve içerik açısından bir Yüksek Lisans tezi olarak yeterli görülmüş ve kabul edilmiştir.
Jüri Üyeleri İmzalar Prof. Dr. Niyazi BERK --- Assist. Prof. Hakkı Öztürk ---
ACKNOWLEDGEMENTS
I would like to thank Prof. Niyazi BERK who not only served as my supervisor but also challenged, encouraged and motivated me throughout my thesis period. I am grateful to him especially for his kind appreciation of the special situation of a student active in professional life without giving any compromise from the quality of academic study.
I also want to thank my wife and my friends for their continious support and understanding throughout my thesis studies.
iv
ABSTRACT
STOCK VALUATION BY DISCOUNTED CASH FLOW ANALYSIS AND AN APPLICATION
Mustafa Keçeli
Capital Markets and Finance Program
Thesis Supervisor: Prof. Dr. Niyazi BERK
January 2013, 103 pages
Valuation topic is of crucial interest to the finance world. Therefore it is one of the most scrutinized fields of finance. Its theory has been vastly implemented in stock market transactions, merger and acquisitions, initial and secondary public offerings, company restructurings, capital budgeting as well as performance evaluation techniques.
In this work, the details of the Discounted Cash Flow Valuation methodology are discussed. Although different approaches include various discounted cash flow models, three valuation model are examined in this thesis; Dividend Discount Model, Free Cash Flow to Equity and Free Cash Flow to Firm. Author of this document attempted to see the problems and concepts related with the subject from the eyes of a valuation analyst.
Value and Valuation concept are explained in the first section of this work, Valuation Methodologies are discussed in the second section.
The main inputs of a Discounted Cash Flow Analysis, which are fundamental analysis and discount rate calculation, are demonstrated in the third section.
v
In the fourth part, Discounted Cash Flow Analysis is examined under three different models. The differences, limitations and advantages of each model are also interpreted in this section. Additionally, the important points in the construction of the models are argued in this part of the document.
The final part of the thesis includes implementation of a discounted cash flow analysis to a real company. The results of each methodology are contrasted and interpreted.
vi
ÖZET
HİSSE SENEDİ DEĞERLEMESİNDE NAKİT AKIMLARI ANALİZİ
Mustafa Keçeli
Sermaye Piyasası ve Finans Programı
Tez Danışmanı: Prof. Dr. Niyazi BERK
Ocak 2013, 103 sayfa
Değerleme konusu finans dünyasında önemli bir yere sahiptir. Bu nedenle konu finans dünyasında dikkatle incelenmekte ve takip edilmektedir.Konunun teorik içeriği hisse senedi piyasalarındaki işlemlerde, satın alma ve birleşme işlemlerinde, halka arzlarda, şirket kurulumlarında ve bütçeleme işlemlerinde hem hedeflerin hem de değerlerin belirlenmesinde sıklıkla uygulanmaktadır.
Bu çalışmada hisse senedi değerlemesinde nakit akımları analizi yöntemleri ve bu yöntemlerin ayrıntıları tartışılmıştır. Farklı çalışmalarda farklı değerleme modelleri nakit akımları analizi içinde değerlendirilse de, bu çalışmada nakit akımları analizi 3 model altında incelenmiştir; Temettü iskontolama modeli, sermayeye nakit akımları analizivefirmaya nakit akımları analizi.İlgili modeller açıklanırken kavramlara hisse senedi analisti gözüyle yaklaşılmaya ve pratik yaklaşımlardan bahsedilmeye çalışılmıştır.
Çalışmanın birinci bölümünde değer ve değerleme kavramları açıklanırken, ikinci bölümde değerleme yöntemlerinden kısaca bahsedilmiştir.
vii
Çalışmanın üçüncü.bölümünde nakit akımları analizinin önemli girdileri olarak kabul edilebilecek temel analiz süreci ve iskonto oranın belirlenmesi süreci tartışılmıştır.
Daha sonra nakit akımları analizi 3 model altında ayrıntılı olarak incelenmiş, modeller arasındaki farklılıklar, birbirlerine karşı üstünlükleri ve eksiklikleri üzerinde durulmuştur. İlgili bölümün devamında ise bu modellerin kurulması sırasında önem verilmesi gereken girdiler hakkında bilgiler verilmiştir.
Çalışmanın son bölümünde ise nakit akımları analiz yöntemleri örnek şirket üzerinde uygulanmaya çalışılmıştır. Her bir yöntemin ayrı ayrı uygulamasının ardından ortaya çıkan sonuçlar karşılaştırılmış ve yorumlanmaya çalışılmıştır.
viii
TABLE OF CONTENTS
LIST OF TABLES...XI
LIST OF ABBREVIATIONS...XII
LIST OF SYMBOLS...XIII
1. THE VALUE AND VALUATION CONCEPT………... 1
1.1 VALUE………... 1
1.2 VALUATION……… 1
1.2.1 Valuation Process... 2
2. STOCK VALUATION METHODS……….. 3
2.1 ALTERNATIVE DISCOUNTED CASH FLOW VALUATION MODELS (INCOME BASED VALUATION MODELS)………. 3
2.1.1 Economic Value Added (EVA)………. 4
2.1.2 Residual Income………. 5
2.2 RELATIVE VALUATION (MARKET BASED VALUATION APPROACH)… 6 2.2.1 Matching Price to Parameter……… 6
2.2.2 Commonly Used Market Multiples……….. 7
2.2.2.1 Price to earning (P/E)………. 7
2.2.2.2 Enterprise value / revenue………. 8
2.2.2.3 Enterprise value /EBIT or Enterprise value /EBITDA……….. 8
2.2.2.4 Price to book value and Tobin’s Q……… 9
2.3 ASSET-BASED APPROACH TO COMPANY VALUATION………... 9
3. PRIMARY INPUTS OF CASH FLOW ANALYSIS……….. 11
3.1 FUNDAMENTAL ANALYSIS……… 11
3.1.1 Economic Analysis………. 12
3.1.2 Industry Analysis………... 14
3.1.3 Company Analysis……….. 16
ix
3.1.4.1 Comparative statement analysis……… 19
3.1.4.2 Trend analysis……… 19
3.1.4.3 Common size analysis……… 19
3.1.4.4 Ratio analysis………. 19
3.2 DETERMINATION THE DISCOUNT RATE FOR CASH FLOW……… 24
3.2.1 Cost of Equity……….. 25
3.2.1.1 Capital asset pricing model (CAPM)………... 26
3.2.1.2 Beta………. 27
3.2.1.2.1 Determinants of betas……….. 30
3.2.1.2.2 Alternatives to regression betas………. 32
3.2.1.3 Risk free rate……… 35
3.2.1.4 Equity risk Premium………. 37
3.2.2 Cost of Debt………. 45
3.2.3 Weighted Average Cost of Capital……….. 49
4. DICOUNTED CASH FLOW MODELS……… 51
4.1 DIVIDEND DICOUNTED CASH FLOW MODEL……… 51
4.1.1 Growth Models……… 52
4.1.1.1 Gordon growth model……… 52
4.1.1.2 Two stage growth model……… 53
4.1.1.3 Multy stage growth model………. 55
4.1.2 Limitations of DDM……….. 56
4.2 FREE CASH FLOW TO EQUITY MODEL (FCFE)………. 57
4.3 FREE CASH FLOW TO FIRM MODEL (FCFF)………... 60
4.4 FORECASTING CASH FLOWS……….. 63
4.4.1 Forecasting Sales and Profits………... 63
4.4.2 Depraciation&Amortization……… 65 4.4.3 Capital Expenditure………. 66 4.4.4 Working Capital………... 67 4.4.5 Tax Effect……….. 69 4.4.6 Terminal Value………. 70 4.5 LIMITATIONS OF DCF VALUATION……… 72
x
5.1 ECOMOMIC ANALYSIS……… 74
5.1.1 Global Economy………. 74
5.1.2 Domestic Economy………. 74
5.2 INDUSTRY ANALYSIS……….. 75
5.2.1 The Turkish Retail Market………... 75
5.2.2The Turkish Food Retail Market………... 75
5.2.3 Comparative Data of Public Companies Operating in the Same Industry………..……….. 79
5.3 COMPANY ANALYSIS……….. 79
5.3.1 Differences Generated Bim in Retail Industry ………...……… 80
5.3.1.1 Decentralısed organısatıon………. 80
5.3.1.2 Hard-dıscount concept……… 81
5.3.1.3Effectıve cost management………. 81
5.3.1.4Hıgh ınventory turnover rate………. 81
5.3.1.5 Source of financing..……… 82
5.3.1.6 Product range……….. 82
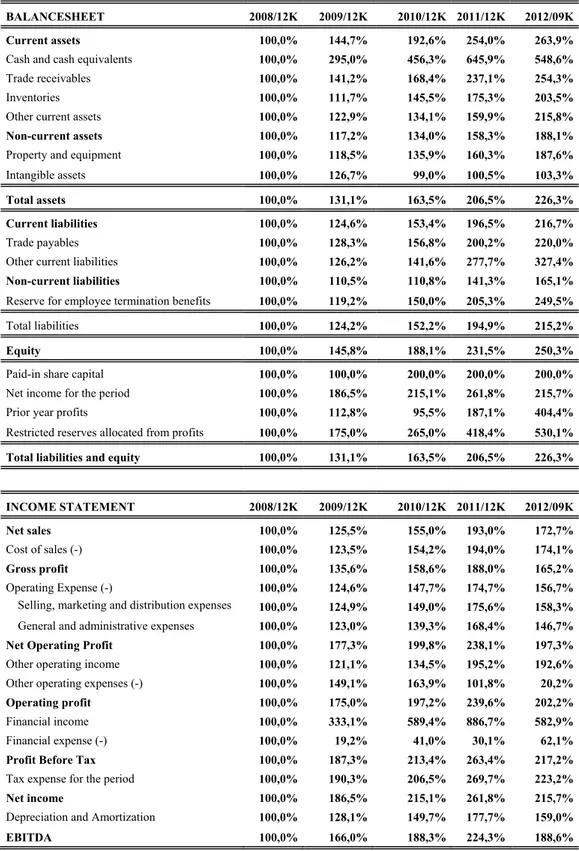
5.4 FINANCIAL STATEMENT ANALYSIS………. 83
5.5 EXPACTATIONS AND ASSUMPTIONS ABOUT CASH FLOWS………. 85
5.6 VALUATION OF BIMAS………... 92
5.6.1 Discount Rate……….. 92
5.6.1.1 Cost of equity………... 92
5.6.1.2 Cost of debt……….. 93
5.6.1.3 Weighted average cost of capital……… 93
5.6.2 Dividend Discount Model……….. 94
5.6.3 Free Cash Flow to Equıty……….. 97
5.6.4 Free Cash Flow to Firm………. 99
6. COMPARISON AND INTERPRETATIONS OF MODELS……… 101
xi
LIST OF TABLES
Table 3.1: Example of one common method for the calculation beta………. 28
Table 3.2: Differences in the beta measurement………. 30
Table 3.3: Some countries’ rating and risk premiums……….. 44
Table 3.4: Synthetic rating table by Damodaran……….. 47
Table 5.1: Comperative data of public companies………. 78
Table 5.2: Horizontal Analysis……….. 82
Table 5.3: Vertical and Common Analysis……… 83
Table 5.4: Ratio Analysis……… 84
Table 5.5: “Per store” historical data of BIM.AS……….. 86
Table 5.6: Historical income statement………. 87
Table 5.7: Historical income statement margins……… 87
Table 5.8: Assumptions “per store”……… 88
Table 5.9: Income statement as per store assumptions………. 88
Table 5.10: Income statement margins as per store assumptions……… 89
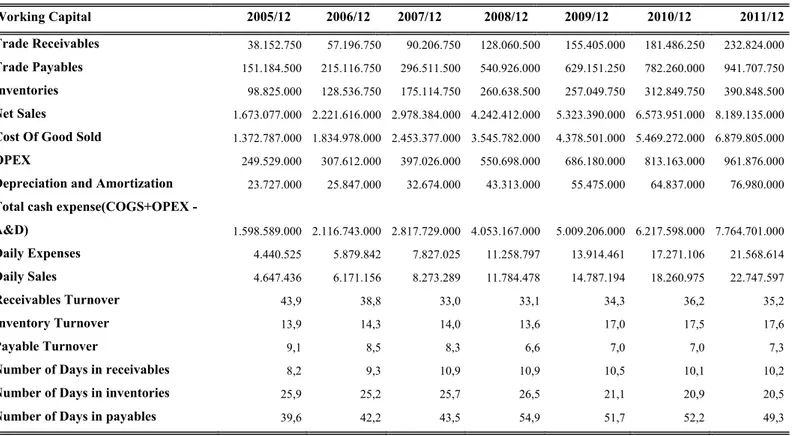
Table 5.11: Historical working capital……… 90
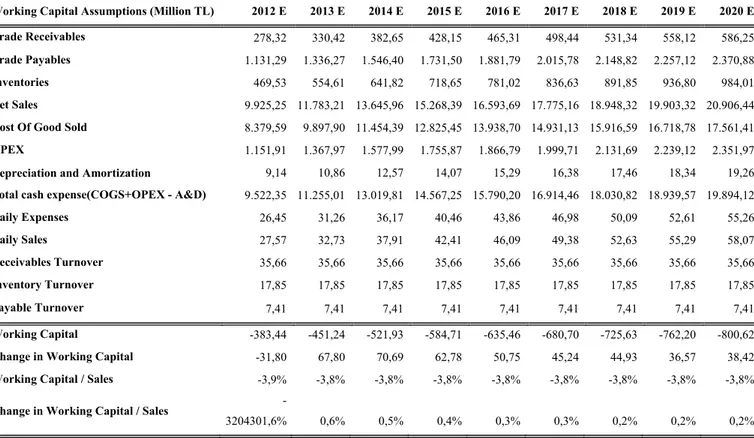
Table 5.12: Working capital assumptions……… 91
Table 5.13: Dividend discount model implementation………. 93
Table 5.14: Company dividend payout detail……… 94
Table 5.15: Historical dividend growth of company……… 95
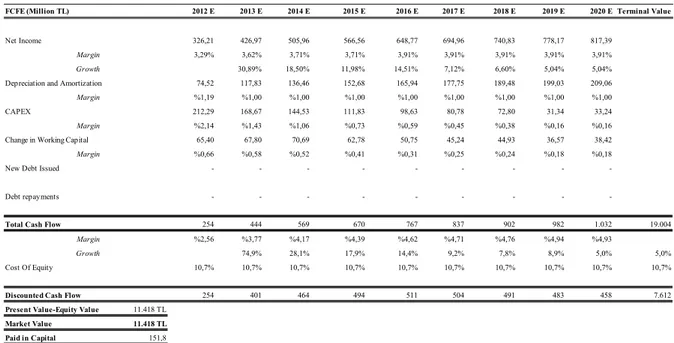
Table 5.16: FCFE implementation………. 96
Table 5.17: FCFF implementation……….. 98
xii
LIST OF ABBREVIATIONS
A&D APV
: Amortization and depreciation : Adjusted present value
APM : Arbitrage pricing model
A/P A/R BIM-BIMAS CAPM : Account payable : Account receivable
: Bim Birleşik Mağazaları A.Ş. : Capital asset pricing model CAPEX : Capital expenditures CBRT
COGS
: Central Bank of The Republic Of Turkey : Cost of goods sold
DCF : Discounted cashflow valuation DDM
EBIT
: Dividend discount model : Earnings before interest and tax
EBITDA : Earnings before interest, tax, depreciation and amortization
EPS : Earning per share
EXP. : Expense
EV/BV : Enterprise value to book
EV/EBIT : Enterprise value to earnings before interest and tax
EV/EBITDA : Enterprise value to earnings before interest,tax, depreciation and amortization
EV/S : Enterprise value to sales FCF
FCFE FCFF FMCG OPEX
: Free cash flow
: Free cash flow to equity : Free cash flow to firm
: Fast-moving consumer goods : Operating expenses
NOPAT : Net operating profit after tax
NPV : Net present value
xiii
P/E : Price to earnings ratio
P/EBIT : Price to earnings before interest and taxes ratio P/EBITDA : Price-to-earnings-before-interest-taxes-depreciation
amortization ratio
TL : Turkish Lira
UK : United Kingdom
US : United States
US$ : United States Dollar
WACC : Weighted average cost of capital
xiv
LIST OF SYMBOLS
Company cashflow in period t : CFt
Value of debt : D
Value of equity : E
Expected return on an asset : E(R)
Expected return on market portfolio : E(Rm)
Expected return on a portfolio with a beta of one on such defined
macroeconomic variable n and zero on all other factors : E(Rn) Growth rate of company cashflows after period t : gstable
Discount rate : k
Cost of debt : kd
Cost of debt after tax : kd(after-tax)
Borrowing cost of the firm for its longer term debt with t years : kd,t
Cost of equity : ke
The last period of forecast period : n
Risk free rate : Rf
Yield of a US Treasury bond with a term of t years : Rf,t
Corporate tax rate : T
Terminal value of the company : X
Beta : β
Beta relative to changes in inflation : βI
Beta relative to changes in a defined macroeconomic variable defined as n : βn
Unlevered beta : βu
Spread for the debt of the company : ∆d
Volatility of the country bond market : бequit y
0
1. VALUE AND VALUATION CONCEPT
1.1 VALUE
The definition of value today is the amount of money which something is worth (Black 2006, p.211). In economics, value is the exchange value of an asset, that is, value of a unit of an asset is measured by the units of the other asset or currency, which is traded in exchange for that asset. Therefore, the value of the asset depends on its desirability and its scarcity. If an asset is desired and also scarce at the mean time, then that asset will be of higher exchange value (Baumol and Blinder 1998, p.96). Several perspectives on value serve as the foundation for the variety of valuation models available.
1.2 VALUATION
Valuation can be defined as a process that links risk and return to determine the worth of an asset(Gitman 2009, p. 299). Companies or analysts value assets for various reasons or needs. Some of the most common purposes for valuation are; mergers and acquisitions (M&A), financial reporting, Initial Public Offering (IPO), litigation and ownership disputes, allocation of purchase price, goodwill impairment, buy/sell agreements, reorganization and bankruptcies, recapitalizations, privatization (Hitchner 2006, p. 2).
In finance literature, discounted cash flow-based valuation is the most widely used technique. In this respect, Gitman states that there are three key inputs to the valuation process (Gitman 2009, p. 299):
I. Cash flows, II. Timing,
2
In addition to key inputs which are mentioned above, there are some general factors affecting the valuation; these are general situation of the industry and economy in which the company operates, size and growing capability of the company, liquidity, capital structure, financial position, dividend distribution policy, technology, product pricing and marketing, planned capital investments and economic life of these investments. Besides these factors and fundamental valuation techniques, knowledge and professional judgment of the analyst will also have a considerable effect on valuation(Chambers 2005, p. 24).
1.2.1 Valuation Process
Pinto and Others (2010, pp. 7-8) determined the valuation process that consists of five steps in general that must be followed by the analysts:
i. Understanding the business
ii. Forecasting company performance
iii. Selecting the appropriate valuation model iv. Converting forecasts to a valuation
3
2. STOCK VALUATION METHODS
Definition of valuation is that it is the estimation of an asset’s value based on variables perceived to be related to future investment returns, on comparisons with similar assets, or, when relevant, on estimates of immediate liquidation proceeds.1
Analysts use a wide range of models to value assets in practice, ranging from the simple to the sophisticated, in general terms; we can separate the valuation to the three different approaches (Damodaran 2002, p.14):
The first, discounted cash flow valuation (Income based valuation model), relates the value of an asset to the present value of expected future cash flows on that asset.
The second, relative valuation, estimates the value of an asset by looking at the pricing of 'comparable' assets relative to a common variable such as earnings, cash flows, book value or sales.
The third, asset based valuation, the principle of which is that the value of ownership of an enterprise is equivalent to the fair value of its assets less the fair value of its liabilities.
2.1 ALTERNATIVE DISCOUNTED CASH FLOW VALUATION MODELS (INCOME BASED VALUATION MODELS)
A discounted cash flow valuation model is a model that specifies an asset’s intrinsic value. Although discounted cash flow valuation is one of the three ways of approaching valuation and most valuations done in the real world are relative valuations, it is the foundation on which all other valuation approaches are built.
The structure and the names of the models might differ, but the underlying idea is always the same. They are all rooted in the present value framework for equity valuation pioneered by Merton Miller and Franco Modigliani (1961) in the early 1960s.
4
A lot of “different” discounted cash flow approaches exists today, each with its own acronym: dividend discount models (DDM), free cash flow to the firm (FCFF), free cash flow to equity (FCFE), Residual Income Model, Adjusted Present Value Model and Economic Value Added (EVA), to name just the most popular models discussed in academic literature. DDM, FCFF and FCFE models which constitute the main subject of the study will not be explained in this section.
This approach has its foundation in the present value rule, where the value of any asset is the present value of expected future cash flows that the asset generates.
Value CF
1 r
Where,
n = Life of the asset
CFt = Cash flow in period t
r = Discount rate reflecting the riskiness of the estimated cash flows
The cash flows will vary from asset to asset -- dividends for stocks, coupons (interest) and the face value for bonds and after-tax cash flows for a real project. The discount rate will be a function of the riskiness of the estimated cash flows, with higher rates for riskier assets and lower rates for safer projects (Damodaran 2002, p.15).
2.1.1 Economic Value Added (EVA)
EVA is trademarked by Stern Stewart & Company. Joel Stern (1998, xi) and G. Bennett Stewart (1991, p. 742) state that EVA is the residual income that remains after operating profits cover the cost of capital. Stern explains that for debt and equity investors to earn an adequate rate of return, the return must be large enough to compensate them for risk. If the residual income (i.e., EVA) is zero, a firm’s operating return is just equal to the return that investors require for the risk they are taking. Thus, EVA is defined by Stewart (1991) and Ehrbar (1998) as:
5
EVA = NOPAT – C% (TC) Where;
NOPAT = net operating profit after taxes C% = cost of capital
TC = total capital
Based on the EVA model, the value of a firm is equal to the value of its total capital plus the sum of the present value of its projected EVA. Thus, there are three inputs into the EVA model: total capital, net operating profit after taxes, and cost of capital.2
2.1.2 Residual Income
As an economic concept, residual income has a long history, dating back to Alfred Marshall (1890) in the late 1800s.3 As far back as the 1920s, General Motors used the concept in evaluating business segments.4
Residual income is defined as the accounting earnings above normal earnings. Normal earnings are the earnings that would be earned given the cost of capital and beginning of the period book value of equity; and the number is calculated by multiplying the book value of equity at the beginning of the period (Bt-1) by the firm’s cost of equity capital
(Ce). The residual income for the period t is (FEPSt – Ce Bt-1), where FEPSt is the
forecasted earnings for the period t.
The mathematical relationship between the price of a share of stock, forecasted earnings and book (Rawley and Benton 2010, pp.174-175):5
Vo = Bo + ∑ [(1+Ce)-t (FEPSt – Ce Bt-1)]
Where;
Vo = current intrinsic value of a share of stock
2For more information about EVA look at; Joel Stern (1998), G. Bennett Stewart (1991, p. 742), Rawley
and Benton (2010, p.173)
3Alfred Marshall, Book Two: Some Fundamental Notions, Chapter 4 , “ Income, Capital, ” İn Principles Of Economics (London; Macmillan And Co., Ltd., 1890).
4See, For Example, Young (1999) And Lo And Lys (2000).
6
Bo = book value of a share of stock
Ce = cost of equity capital
FEPS = forecasted earnings per share
2.2 RELATIVE VALUATION (MARKET BASED VALUATION APPROACH)
The idea behind the market approach is that the value of a business can be determined by reference to sales of reasonably comparable guideline companies (also referred to here as “comparables” or “comps”) that have taken place in either the public or the private marketplace. The value may be known either because the companies are publicly traded or because they were recently sold and the terms of the transactions were disclosed(Hitchner 2010, p.259).
Despite the differences between two valuation methods, one of Arzac’s studies which aimed to test the success of relative valuation method and DCF valuation method for finding the firm value, Arzac states that although these two methods provide very useful estimates in individually, the methods give better estimates while they were used together(Arzac 2008, p.66).
2.2.1Matching Price to Parameter
Conventionally, “price” is matched to the appropriate parameter based on which providers of capital in the numerator will be paid with the monies given in the denominator.
For example, in price/EBIT, price is Enterprise Value, since the earnings before interest payments and taxes will be paid to both the debt and equity holders. In price/net income, price is the market value of equity only, since net income is after interest payments to debt holders and represents amounts potentially available to shareholders. Any denominators that exclude interest (e.g., EBIT or EBITDA) should usually be matched with its corresponding numerator (e.g., Enterprise Value). Enterprise Value is usually the numerator for (Hitchner 2010, pp.296-297):
7
• Revenues • EBITDA • EBIT
• Debt-free net income • Debt-free cash flows • Assets
• Tangible book value of invested capital Equity Value is usually paired with:
• Pretax income • Net income • Cash flow
• Book value of equity
2.2.2Commonly Used Market Multiples
Although a variety of market multiples appear in financial literature, only a few receive wide recognition and application. While there may be variation in the application of those listed next, these are the multiples that are most commonly used (Mellen and Evans 2010, p.183);
2.2.2.1 Price to earning (P/E)
In the scope of fundamental analysis, P/E ratio is one of the relative valuation techniques that are used for company valuation. For the first time, Malkiel claimed that the value of company can be found by P/E ratio. Markiel indicated that P/E ratios represent the normalized stock prices and he developed a valuation model with using P/E ratios. In company valuation based on P/E ratio the analyst firstly should determine the earning per share, and then find the actual stock value by multiplying pre-determined EPS value with realized P/E ratio in the market (Malkiel 1963, pp. 1004-1031). Price/earnings is certainly the best known, if not the most popular, multiple. The price of common stock is the numerator, and income after taxes is the denominator. This multiple is appropriate for most profitable companies with a stable capital structure
8
that is consistent with the capital structure of the selected guideline companies. This equity multiple will produce an equity value directly.
2.2.2.2 Enterprise value /Revenue
Enterprise value /revenues, another popular multiple, assumes a homogenous industry where the revenues can reasonably be expected to produce a consistent quantity of earnings or cash flow. It may also be useful in certain industries, such as the restaurant industry, to eliminate any discrepancies in the definition of earnings between the subject and among the guideline companies, which may arise in using earnings multiples. Although revenue multiples often reflect price in the numerator, it is more appropriate to reflect Enterprise Value in the numerator. Reflecting price in the numerator produces confusing results because price is a measure of equity and the denominator is a return to debt and equity. Revenue is a measure of operating results that comes before interest expense in the income statement.
2.2.2.3 Enterprise Value /EBIT or Enterprise Value /EBITDA
Coyle states that some analysts accept that cash profit is more important than traditional earnings or accounting profits and EBITDA (Earnings before Interest, Taxes, Depreciation, and Amortization) is a good measure for cash operating profit (Coyle 2002, p.47). In addition to this assertion, Damodaran indicates that some companies may have negative earnings per share or negative income, for this reason using P/E ratio becomes meaningless. In the case of net loss, P/E ratio cannot be calculated; therefore, using EBITDA rather than net income or loss figure is suitable. Enterprise Value /EBIT (earnings before interest and taxes) and EBITDA (earnings before interest, taxes, depreciation, and amortization) are widely used in the M&A community. These returns include the interest expense return to the debt holder, so the numerator must be the aggregate market price of the equity and debt. When developed correctly, these multiples can provide substantial insight into both investment value and fair market value. The key is to ensure that they are supported by proper calculations of transactions that are appropriate for comparison.
9
2.2.2.4 Price to Book Value and Tobin’s Q
Multiples which are based on historical book value depending on accounting records and replacement cost of assets can be used as another technique in valuation. In this respect, the most widely used multiples are Market to Book Value (Price/BV) and Replacement (Tobin’s Q) Ratios.
Price / BV ratio is calculated as follows:
Price / BV = Market Value of Equity / Book Value of Equity.
This multiple is often used to value banks. This ratio becomes meaningless for the companies having negative equities.Other industries that use P/BV or its derivatives are the paper and pulp industry, real estate and insurance (Fernandez 2001, p. 4).
Usage of the book value is not a good measure to determine the fair value of financial assets, replacement cost of assets (Tobin’s Q) is used as an alternative method for valuation. When other things equal, Tobin’s Q is expected to be high when the productivity of a company’s assets is high. Tobin’s Q ratio is calculated as follows (Gürbüz and Ergincan 2008, p.177):
Tobin’s Q = Market Value of Assets / Replacement Cost of Total Assets
2.3 ASSET-BASED APPROACH TO COMPANY VALUATION
The principle underlying the asset-based approach is that the value of ownership of an enterprise is equivalent to the fair value of its assets less the fair value of its liabilities. Of the three approaches to valuation, the asset-based approach (also referred to as the cost approach by many in the valuation profession) is generally considered to be the weakest from a conceptual standpoint for valuing an ongoing business enterprise.
10
The asset-based approach may be appropriate for the valuation of holding (investment) companies, such as real estate investment trusts (REITs) and closed-end investment companies (CEICs). For these entities, the underlying assets typically consist of real estate or securities that were valued using the market and/or income approaches. An asset-based approach may also be appropriate for very small businesses with limited intangible value or early stage companies.6
6
11
3. PRIMARY INPUTS OF CASH FLOW ANALYSIS
3.1 FUNDAMENTAL ANALYSIS
One of the most important components for stock evaluation is fundamental analysis. Fundamental analysis may be divided into 3 sections as economical analysis, industry analysis and company analysis.
In the method mentioned above, it is aimed to reach real value of stock by evaluating the company in consideration of basic indicators which determines the share price such as profitability, liquidity, capital structure, production, technological situation, market structure, management quality, competitive power and macro-economic developments (Berk 2010, p. 62).
It is possible to recognize all methods analyzed in the study within the concept of fundamental analysis. Global and national economical developments and expectations are the variables which have a direct effect on the future performance of a company. The other important issue which should to be examined after an economical analysis is the general condition of industry the company operates in. General operating structure of the industry, leading companies, the reaction of industry data to macro-economical data, industryal competition structure, profit margins are the subjects a stock analyst should have knowledge of. The last field of study in the fundamental analysis is company analysis. In this part, the analyst should strike into thesubjects such as general operating structure of the company, institutionalization level, position in the industry, market domination and market share, exportation competency and potential. In addition, the analyst should have detailed knowledge about past and current financial performance of a company through financial statements analysis.
In this section, every part will be examined separately. In addition, basic financial statements analysis shall be described during company analysis.
12
3.1.1 Economıc Analysıs
A top-down analysis of a firm’s prospects must start with the global economy. The international economy might affect a firm’s export prospects, the price competition it faces from competitors, or the profits it makes on investments abroad. Nevertheless, despite the fact that the economies of most countries are linked in a global macroeconomy, there is considerable variation in the economic performance across countries at any time(Bodie and others 2009, p. 554).
Even if there is great discrepancy between economical performances of countries, the effect of some countries’ economy on global economy is stronger. Especially, the effects of these countries on global economy have increased upon globalization of money and capital markets. Movements affecting money and capital markets generally emerge from economical data of developed countries such as USA, China, Japan, and European Union. Data announced periodically by these countries and positive or negative developments in these countries are analyzed closely and reacted (Berk 2010, p. 64).While performing macro-economical analysis, an analyst can not ignore changes in these countries and their effects on global economy. These data are not only important for it may alter macro-economical condition, but also reacted by capital markets and investors consider risk/rate of return in light of these data. For example, the position of local currency of the country in which evaluated company operates over against other currencies may affect both country economy and company business.
One obvious factor that affects the international competitiveness of a country’s industries is the exchange rate between that country’s currency and other currencies. The Exchange rateis the rate at which domestic currency can be converted into foreign currency (Bodie and others 2009, p. 555).
Variations on exchange rate have an effect on competition environment through pricing and local currency depreciation may increase input cost which is provided from abroad such as petroleum and may create an inflationary environment. In the contrary case, the decrease exchange rate causes, in income of countries which generate income from petroleum may result in decreased national income. Sudden variations in exchange rates
13
may also result in sharp increase in country and company debts abruptly (in current rate).
Apart from global economical condition, the other most important matter which has effect on company operations is economical aspect. National economical aspect and expectations have potential to be more or less influenced by global economy. While the degree of exposure potential is changed by global economical mobility according to country’s indebtness, natural sources, balance of trade, political condition, company’s exposure potential is changed according to companies’ specific structure. All macro-economical data have more or less potential to influence the company according to its field of activity and financial structure. Some of the basic macro-economical indicators may be followed as; Gross national product, unemployment, inflation, interest rates, budget deficits. Besides these data, consumer confidence, consumer spending, investment spending, government incentives, money supply may also be beneficial for obtaining an opinion about macro-economical aspect. While some of these data are important for indicating current condition, others are in the characteristic of initial indicators.
While macro-economical data influence industrys, industrys influence company activities.The industry’s sales and profits typically reflec macroeconomic conditions. Obviously, the extent to which an industry’s performance reflects macroeconomic conditions depends on the industry. Some industries, such as food, health care and other consumer staples are less affected by changes in economicconditions. Sales of other industries, such as airlanes or luxury consumption goods, critically depend on macroconditioons: They rise when the economic conditions improve and decline when economic conditions deteriorate (Benninga and Sarig 1997, p. 140).
Besides, as banking industry is highly influenced by interest decisions of central banks and market interests, automobile industry is influenced by gross national product data. Variations in interests have influence directly on banking industry profitability and also indirectly on automobile industry. While automobile selling rates is increased in low-interest environments due to increased credit opportunities and inexpensive credits, an adverse effect is observed on high-interest environments. While variations in exchange
14
rates directly affect the profitability of importing or exporting companies, it also has affect on industrys such as tourism. Alternations on raw material prices have a negative effect on companies which have high dependence on raw materials, but have a positive effect on raw material producers.
While performing predictions for a company, an analyst should take consideration in macro-economical data. An analyst may make analysis of this data and make future predictions on their own, or benefit from public and private institutions’ studies, market expectations and various surveys of data providers. Together with macro-economical data, an analyst may make predictions by developing new models specific to industry or company. This subject is a totally different specialty and excluded in this study.
3.1.2 Industry Analysis
In general conversation, industries are described by the product they produce or the service they provide. Hospital chains or physician health groups are medical service industries. News papers firms, magazine publishers, and book companies fall in the publishing category. Sporting goods manufacturers, recorded music distributors, and toy producers are lumped into the recreation industry(Hooke 2010, p. 73).
By far the most popular segmentation tool is the industrial life cycle, which reflects the vitality of an industry over time. A staple of business school text books and management consulting firms, the life cycle theory outlines four phases;Start-up or Pioneer Stage, The Growth Phase, Maturity Stage, Decline Stage.
In addition to this classification, industrys may be classified according to their reaction to economical activities. In his book, James Hooke(2010) classified industries by dividing into three as follows;
Growth;Above-normal expansion in sales and profits occurs independently of the
business cycle.Defensive;Stable performance continues during both ups and downs of business cycle.Cyclical;Profitability tracks the business cycle, often in an exaggerated manner.
15
Bodie, Kane, Marcus (2009) approached this as “Sensitivity to the Business Cycle” and classified industrys according to reactions of sell and profit rates to macro-economical alternations. In these foregoing books this classification is dividedin to three: sales sensitivity, operational leverage sensitivity and financial leverage sensitivity.
The maturation of an industry involves regular changes in the firm’s competitive environment. Michael Porter (1985) has highlighted these five determinants of competition: threat of entry from new competitors, rivalry between existing competitors, price pressure from substitute products, bargaining power of buyers, and bargaining power of suppliers.
There are external effects which would make industrys knowledge of their future and are required to be examined after examining industry structure. These effects are generally technological development, social structure, change, demographic situation, government policies and international effects. Industry analysis is a matter that should be taken into consideration on stock evaluation. Operational and financial assumptions about a company are directly related to its industry. Selling and profitability data, growth rates, reaction to macro-economical development of the industry together with analysis of previous data have an important role on expectations of the company, because companies act towards to industry averages. To know weaknesses and strengths of the industry, cost structure, profitability ratios and growth data are crutial to create company’s general structure. For sure, not all companies act towards to industryal averages. There may be companies with higher growth rate and profitability than its industry. Sometimes companies may have characteristics different from its industry. In such cases, industryal analysis should be performed well and weakness and strength of the company should be described in detail.
16
3.1.3 Company Analysis
After having examined global economical condition and national economical aspect in main analysis section, environment of a company becomes analyzed performing industryal analysis. Thus, limits of evaluation to be performed are determined. Finally, it is possible to have knowledge of a company’s capacity for future by analyzing the company. This section is examined with two sub-topics. Firstly, weakness and strength of a company are determined with a general examination and limits of the field to be placed by determining market share and competition environment. Secondly, financial statements analysis is performed in which an analyst shall utilize in cash flows analysis. In this analysis, financial condition of a company is determined. Cash flows of a company may be predicted according to more objective and consistent criteria.
Performing SWOT analysis for a company shall be beneficial for checking cash flows predictions and objectivity of the analyst. Stacey (1993) describes SWOT analysis as a list of an organization's strengths and weaknesses as indicated by an analysis of its resources and capabilities, plus a list of the threats and opportunities that an analysis of its environment identifies.
A SWOT analysis should enable you to make strategic decisions by considering: “internal strengths and weaknesses” and “external opportunities and threats”; First step analyst analysis firms organisation internally, writes down its strengths and weaknesses in terms of the following factors:
Culture and structure - flexibility, customer driven, team oriented, etc. Products and services - brand, reputation.
People and their skills - human resources, knowledge, learning. Finance - debt structure, budgets, cash flow, source of income.
17
Resources - land, buildings, systems, processes.
Second step analist analyse firm externally, write down its opportunities and threats in terms of:
The industry and marketplace in which it operates.
Trends in the macro environment, analysis to highlight important political, economic, social, technological, legislative and environmental trends that are affecting your organisation now and will affect it in the future.7
3.1.4 Financial Statement Analysis
Financial statements analysis is examination of relationships between items in financial statement and their tendency to evaluate activity results and financial development, determined development aspects and make perspective predictions about the company Akgüç 2008, p.1)
Financial statements analysis has an important role with regards to have knowledge of the company’s structure and to make financial expectations be on a steady ground. In this section of the study, financial statements analysis methods will be described. As this is main subject of the study important subjects were emphasized.
Financial statements may be described as balance sheet, income statement, profit distribution statement, statement of changes in equity, cash flow statement. Although mentioned statements are different, the most important statements are balance sheet and income statement. Besides cash flow statement is a indicator worth to be utilized by the analyst.
18
It is possible to classify financial statements analysis in many different ways. Suppose that financial statements are examined as to form and substance, it is possible to classify analysis according to the material or method.
Based on the material used, financial statement analysis may be classified into two major types such as External analysis and internal analysis.
When external analysis is very much useful to understand the financial and operational position of the business concernsuch as investors, creditors, government organizations and other credit agenciesand mainly depends on the published financial statement of the concern, TheCompany itself does disclose some of the valuable informations to the business concern in this internal analysis. This analysis is used to understand the operational performances of each and every department and unit of the business concern.
Based on the methods of operation, financial statement analysis may be classified into two major types such as horizontal analysis and vertical analysis.
Horizontal Analysis; Under the horizontal analysis, financial statements are compared
with several years and based on that, a firm may take decisions. Normally, the current year’s figures are compared with the base year (base year is consider as 100) and how the financial information are changed from one year to another. This analysis is also called as dynamic analysis.
Vertical Analysis; Under the vertical analysis, financial statements measure the
quantities relationship of the various items in the financial statement on a particular period. It is also called as static analysis, because, this analysis helps to determine the relationship with various items appeared in the financial statement. For example, a sale is assumed as 100 and other items are converted into sales figures.
19
In general aspect, financial statements analysis methods can be divided to 4 classifications. These are Ratio Analysis, Comparative Statement Analysis, Trend Analysis and Common Size Analysis.
3.1.4.1 Comparative analysis of financial statements
Comparative statement analysis is an analysis of financial statement at different period of time. This statement helps to understand the comparative position of financial and operational performance at different period of time. Comparative financial statements again classified into two major parts such as comparative balance sheet analysis and comparative profit and loss account analysis.
3.1.4.2 Trend analysis
The financial statements may be analysed by computing trends of series of information. It may be upward or downward directions which involve the percentage relationship of each and every item of the statement with the common value of 100% (Paramasivan and Subramanian 2009, p. 17).
3.1.4.3 Common size analysis
Another important financial statement analysis techniqueis common size analysis in which figures reported are converted into percentage to some common base. In the balance sheet the total assets figures is assumed to be 100 and all figures are expressed as a percentage of this total (Paramasivan and Subramanian 2009, p. 17).
3.1.4.4 Ratio analysis
Ratios are classified in different aspects according to various criteria.Ratio analyses by themselves may not make a sense. These ratios can make sense by means of comparison with ratios efficaciously approved and obtained through experiences. Compared to other analyses financial statement and ratio analyses will be mentioned more. Classifications
20
of standard ratios, not a general classification form, were found acceptable as follows (Akgüç 2008, p. 406);
i. Ratios used in liquidity analysis
Liquidity reflects the ability of a company to meet its short-term obligations using those
assets that are most readily converted into cash. We can describe a company’s ability to meet its current obligations in several ways. We can form the current ratio, which is one of the most commonly used measures of liquidity:
Current ratio = Current assets / Current liabilities
Other mesaure is Quick Ratio;
Quick ratio = Current assets – Inventory / Current liabilities
A company’s receivables are less liquid than its holdings of cash and marketable securities. Therefore, in addition to the quick ratio, analysts also compute a firm’s cash ratio, defined as
Cash Ratio =Cash and Bank Balance + Current Investments (marketable securities) / Current Liabilities
ii. Ratios used to evaluate cash generating capacity
Today, measuring cash generating capacity of companies is important for them to fulfill their liabilities. The following ratios issue an opinion about sufficiency rather than the absolute amount of this source;
=Resources Created As a Result of Operations / Net Sales
= Resources Created As a Result of Operations / Total Average Asset = Resources Created As a Result of Operations / Current Liabilities
21
= Resources Created As a Result of Activity / Interests Paid in The Period
Increase in these rates on examined period refers to increase in resource creating capacity of company.
iii. Ratios giving clues about financial structure
These ratios measure the ability of the firm to service contractual financial commitments like debt. Theymake use of balance sheet and/or income statement numbers to estimate the cushion available (in earnings) to the firm before it defaults on contractual payments (Vishwanath 2007, p. 116).
A ratio that indicates the proportion of assets financed with debt is the debt to- assets
ratio, which compares total liabilities (Short-term debt + Longterm debt) with total
assets:
Debt to assets = Debt / Total assets
Another way to look at the financial risk is in terms of the use of debt relative to the use of equity. The debt-to-equity ratio, or simply the debtequity ratio, is a measure how the company finances its operations with debt relative to the book value of its shareholders’ equity:
Debt to equity =Debt / Shareholders’ equity
Examining capital structure of a company, many ratios may be derived from balance sheet items. Understanding the source structure of a company through these ratios helps analyst during evaluation process. Upon analyzing current data together with previous data, it will be easier to predict capital structure of a company in future.
The ratios that compare debt to equity or debt to assets indicate the amount of financial leverage, which enables an investor to assess the financial condition of a company.
22
Another way of looking at the financial condition and the amount of financial leverage used by the company is to see how well it can handle the financial burdens associated with its debt or other fixed commitments. One measure of a company’s ability to handle financial burdens is the interest coverage ratio, also referred to as the times
interest-covered ratio. This ratio tells us how well the company can cover or meet the interest
payments associated with debt. The ratio compares the funds available to pay interest (that is, earnings before interest and taxes) with the interest expense (Drake and Fabozzi 2010, p. 260):
Interest coverage ratio =EBIT / Interest expense
The greater the interest coverage ratio, the better able the company is to pay its interest expense.
iv. Ratios about assets/sources usage
It is also called as turnover ratio. This ratio measures the efficiency of the current assets and liabilities in the business concern during a particular period. This ratio is helpful to understand the performance of the business concern.
In analysis of this section, how a company utilizes working capital items is examined. Some of the activity ratios are given below:
The inventory turnover ratio is a measure of how quickly a company has used inventory to generate the goods and services that are sold. The inventory turnover is the ratio of the cost of goods sold to inventory:
Inventory turnover =Cost of goods sold / Inventory
The accounts receivable turnover ratio is a measure of how effectively a company is using credit extended to customers.
23
Accounts receivable turnover =Credit sales / Accounts receivable
The accounts payable turnover ratio is a measure of how effectively a company is using credit extended to supplier.
Accounts payable turnover = purchase on credit / Accounts payable
Or;
Accounts payable turnover =Cost of Good Sold / Accounts payable
v. Ratios used to evaluate profitability
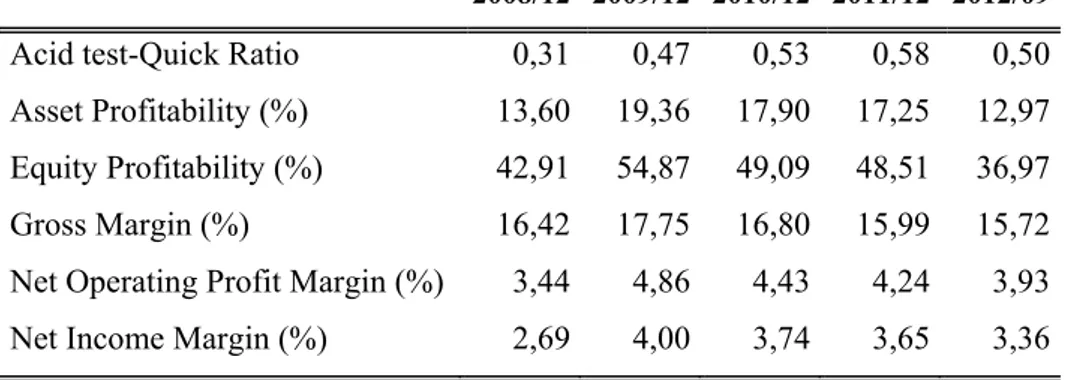
For investors, one of the most important indicators in a company is profitability data. Investor who lends to company and inject equity prefers to consider company profitability from their aspect. While creditors desire to evaluate solvency of a company by examining its business profitability ratios, investors focus on their dividend share by examining items such as net profitability or return on equity.
Profit margin ratios show the relationship between profit and sales (Hiriyappa B. 2008, p.159). On general, they give profitability ratios reached from an unit sale.
Gross Profit Margin = Gross Profit / Net Sales
Operating Profit Margin = Operating Profit / Net Sales
Net Income Margin = Net Income / Net Sales
These ratios may be derived or calculated depending on which specificityof the companydesired be seen. Besides, asset profitability ratio or return on equity which are used observe how a company efficiently uses its investments and assets, and important for investors may be mentioned.
24
Asset profitability; Net Income / Averabe Total Asset
Equity profitability;Net Income / Average Equity
3.2 DETERMINATION THE DISCOUNT RATE FOR CASH FLOWS
This part of the chapter is dwelling on the discount rate which is used to discounting cash flow. Cost of capital, used in discounting cash flow, takes an important place in terms of firm and project/investment assessment. As focused on common stocks assessment in this study, discounting rate will be handed just for this aspect.
When company’s capital structure generally consists of liability (Loan) and equity capital, these sources indicates the ways of gaining firm’s assets. Company may gain the fortune by equity capital or loaning. Optimum dividing between this two source structures play a critic role for company’s future. The important point which is faced by decision maker in source structure is the cost of sources. The cost of this source is the minimum rate of return which firms are planned to gain by these sources.
The essence of the cost of capital is that it is the percentage return that equates expected economic income with present value. The expected rate of return in this context is called a discount rate(Shannon 2002, p. 6).
Discount rate is the important part of valuing firm/Equity with cash flow model. Errors in estimating the discount rate or mismatching cashflows and discount rates can lead to serious errors in valuation. At an intuitive level, the discount rate used should be consistent with both the riskiness and the type of cashflow being discounted;
a. Equity versus Firm: If the cash flows being discounted are cash flows to equity, the appropriate discount rate is a cost of equity. If the cash flows are cash flows to the firm, the appropriate discount rate is the cost of capital.
b. Currency: The currency in which the cash flows are estimated should also be the currency in which the discount rate is estimated.
25
c. Nominal versus Real: If the cash flows being discounted are nominal cash flows (i.e., reflect expected inflation), the discount rate should be nominal (Damodaran 1994)8.
3.2.1Cost of equity
Equity is a stock representing an ownership interest. Equity includes both the paid in capital and the profits accumulated through the company’s operations. The equity of a company is the difference between total assets and total liabilities (Akgüç 2008, p. 209). Ministry of Finance explains the equity capital in annual financial statement as:“it includes the paid-in-capital which indicates the amount of capital investments made to the firm at the date of annual financial statement by owners or partners of enterprise and capital reserves, retained earnings, profits and deficits of prior years and the net profit and deficit of the period.”
Any commercial enterprise cannot show activities without equity which consist of paid in capital and company funds that gained previous year. Equity capital shows not only finance function but also the rights of partners in enterprise (Berk 2010, pp. 194-195) The company uses the equity to finance all or part of its operations. The lowest profitability rate expected from the invested equity can be defined as cost of equity. We estimate the cost of equity by looking at the beta (or betas) of the company in question, the cost of debt from a measure of default risk (an actual or synthetic rating) and apply the market value weights for debt and equity to come up with the cost of capital (Damodaran 2009, p 32). Some approaches of cost of equity are: Gordon Dividend Model, Arbitrage Pricing Model and Capital Asset Pricing Model. Even if the three of the models emerged as an alternative of another in different times, Capital Asset Pricing Model is the most applied model to calculating the cost of equity capital by shareholder analysts.
8
26
3.2.1.1 Capital asset pricing model (CAPM)
For more than 30 years financial theorists generally have favored the notion that using CAPM is the preferred method to estimate the cost of equity capital. In spite of many criticisms, it is still one of the most widely used models for estimating the cost of equity capital, especially for larger companies (Shannon 2002, p. 70). CAMP is mainly used for getting the best profit in return of risk and the time. The greater the risk the greater the profit shall be. All interest is taken on the maturity date when investing on a treasury bond, when investing in riskier options such as stocks, the expected return and the risk premium is much higher than treasury bonds due to risk incurred(Brealey and others 2003, p. 275).
CAPM is an equation for required return that should hold in equilibrium (the condition in which supply equals demand) if model’s assumptions are met; among the key assumptions are that investors are risk averse and that they make investment decisions based on the mean return and variance of returns of their portfolio (Pinto and others 2010, p. 57).
Some other assumptions of CAMP’s stand by:
i. Investors makes plan for just one and equal gaining time,
ii. Investors have the possibility of borrow and take loan at every rate over the standing risk free rate,
iii. Investors do not pay tax and commission, iv. Investors act rationally,
v. Investors which are assumed as having homogenate expectations, have the equal information about the possible distribution of return in future. (Öztürk 2009, p. 43)
Consider the standard approach to estimating cost of equity (Damodaran)9:
Cost of Equity = Rf + Equity Beta * (E (Rm) - Rf)
9
27
Where,
Rf = Riskfree rate
E (Rm) = Expected Return on the Market Index (Diversified Portfolio)
Explaining the formula briefly, the return risk free rate means a return gained by an investment out of risk. The equity beta measures equity’s market or systematic risk, which shows the tendency to move with market or sensitivity to market. Risk premium [E (Rm)-Rf] is the minimum amount of money by which the expected return on a risky
asset must exceed the known return on a risk-free asset, or the expected return on a less risky asset, in order to induce an individual to hold the risky asset rather than the risk-free asset. Thus it is the minimum willingness to accept compensation for the risk.
3.2.1.2 Beta
A share’s beta measures the incrementel risk added by a share to a given portfolio. This risk, called market risk, is that cannot be eleminated by creating a diversified portfolio. The market risk exists because in the economy as a whole, in addition to the specific risk of a company or business, there are other factors that threaten all businesses. A share’s beta is calculated as the covariance between the stock and market returns, divided by the variance of the market returns, multiplied by the share’s volatility and divided by the market volatility (Fernandez 2002, p. 203). In other words:
28
Table 3.1: Example of one common method forthe calculation beta
Weekly End, t Return on Security A Return on S&P Index Calculated Covariance Calculated variance Jan-89 0.041 0.069 0.00211 0.0035 Feb-89 (0.007) (0.029) 0.00045 0.00168 Mar-89 0.052 0.021 0.00043 0.00008 * * Oct-98 0.113 0.077 0.00709 0.00423 Nov-98 0.033 0.057 0.00131 0.00203 Dec-98 (0.016) 0.055 (0.00086) 0.00185 Sum 0.500 1488 0.21060 0.26240 Average 0.004 0.012 0.00176^f 0.00219^g
a.120 month or 10 Year
b. Return based on end of week prices and dividend payments( Versus quarterly or annually) c. Return based on end of week S&P Index d.Values in this column are calculated as: (Observed return on Security A - Average return on Security A)*(Observer return on S&P Index - Average return on S&P Index)
e.Values in this column are calculated as: (Observed return on S&P Index - Average return on S&P Index)^2 f.The Average of this column is the covariance between Security A and S&P g.The Average of this column is the variance of return on the S&P Index
Source: Shannon 2002, p. 81
, & &
0.00176
0.00219 0.80
In time, Beta has a tendency to 1. The comment of Beta in the terms of value:
When Beta > 1,00 ; when market rates of return move up or down, the rates of return fort he subject tend to move in the same direction and with greater magnitude.
When Beta = 1, 00; fluctuations in rates of return fort he subject tend to equal fluctuations in rates of return fort he market.
29
When Beta < 1,00 ; When market rates of return move up or down, rates of return fort he subject tend to move up or down, but to a lesser extent.
Technological developments made easier to calculate the betas of shares or indexes which consequently helped analysts. All they need to do is choosing the right time frame for the needed stock. Some programes also provide an option for the indexes as well. The definition and the calculation of the beta will be evaluated in this chapter even though the mathematical calculation is no more needed due to preset programs. And the estimation methods of beta will be evaluated. Finally, the interpretation of the beta and its effect on value will be appraised.
Various estimations and the databases might lead to different beta results as it can be seen above. Generally databases use regression analysis for estimation of beta. For calculating the beta for a given period, stock and market returns are subjected to regression for that period.
Differences in the beta measurement derive from choices within 3 variables(Shannon 2002, p. 82);
Length of the measurement period;time interval chosen by the anayst has a direct
impact on the value. The most commonly used period is 2 to 5 years in general. The most important factorto be consideredwhenselectingthe period is the changes in company operational of financial structure. For instance if a firm of 10 years has changed it operational or financial structure 3 years ago, using the last 3 years’ data would be recommended when calculating its beta.
The periodicity of measurement within that time period; Data may be measured daily,
weekly, monthly, quarterly or annually. Analysts use short intervals such as daily and weekly, in order to get more precise results. On the other hand, another opiion suggest that monthly datas give more accurate results in terms of long term investment advices.
The choice of an index to use as a market proxy;Another important point when
30
as by how much index is reflecting the total market. For precise analysis the index should indicate the market well.
The Table 3.2 below is given to indicate the important of the points mentioned above.
Table 3.2 : Differences in the beta measurement
FROTO's Beta FROTO-XU100 Daily Weekly Monthly 05.11.2002 For 10 years 0,78 0,87 0,87
05.11.2007 For 5 years 0,75 0,92 0,86
05.11.2009 For 3 years 0,68 0,72 0,69
05.11.2011 For 1 years 0,41 0,35 -
Average 0,65 0,72 0,81
FROTO's Beta FROTO-XU30 Daily Weekly Monthly 05.11.2002 For 10 years 0,71 0,81 0,81
05.11.2007 For 5 years 0,66 0,86 0,79
05.11.2009 For 3 years 0,60 0,64 0,62
05.11.2011 For 1 years 0,35 0,31 -
Average 0,58 0,65 0,74
Source: Finnet Data
3.2.1.2.1 Determinants of betas
The beta of a firm is determined by three variables -(1) the type of business(es) the firm is in, (2) the degree of operating leverage in the firm and (3) the firm's financial leverage (Aswath Damadoran 2007);
Type of BusinessSince betas measure the risk of a firm relative to a market index, the more sensitive a business is to market conditions, the higher is its beta. Thus, other things remaining equal, cyclical firms can be expected to have higher betas than non-cyclical firms.
Degree of Operating LeverageThe degree of operating leverage is a function of the cost structure of a firm, and is usually defined in terms of the relationship between fixed
31
costs and total costs. A firm that has high operating leverage (i.e., high fixed costs relative to total costs), will also have higher variability in earnings before interest and taxes (EBIT) than would a firm producing a similar product with low operating leverage. Other things remaining equal, the higher variance in operating income will lead to a higher beta for the firm with high operating leverage.
Degree of Financial Leverage Financial leverage is the measure of the financial risk and emerges from the financial expenditures. The companies’ have more debt to equity ratio in other words have higher financial leverage, have higher beta. Financial leverage is calculated as follow;
Financial Leverage= Total Debt / Equity or = Total Debt / Total Assets
Betas which are calculated by regression analysis are the leverage betas because these betas are calculated by the stock prices which reflect financial leverage. When determining the market price of a stock, company’s financial leverage is assumed to be taken into account by the market. But the problem here is that the beta reflects the regression periods’ average financial leverage not the current leverage. On the other hand, as valuation methods take future cash flows into consideration, the current debt to equity ratio is not enough for finding the right beta. In order to find company’s future beta, company’s future capital structure and the public companies’ debt to equity ratio which are in similar industry should be evaluated. The capital structure of companies operating at the same industry suggest about the optimal capital structure will be formed by company at next period. Because of that, firstly the leveraged beta which emerged from the regression analysis shall be rendered unleveraged and then emerged number shall be rendered leveraged again according to the determined optimal capital structure. Leveraged Beta is formulized as a function of capital structure and unleveraged Beta(Öztürk 2009, p. 47):
32
ßL = ßu (1 + (1-t) (D/E))
Where;
ßL = Levered Beta for equity in the firm
ßU = Unlevered beta of the firm (i.e., the beta of the firm without any debt)
t = Corporate tax rate D/E = Debt/Equity Ratio
The reason of using the rate of tax is that the financial liabilities from which the company is responsible are providing tax advantage to the company.
For the D/E ratio, market value should be utilized instead of book value. Very common mistake is using current book value that the current market value should be used for equity value.
3.2.1.2.2 Alternatives to regression betas
3 methods will be mentioned as an alternative regression analysis to calculate beta. Even if different methods are mentioned in different sources the most emphasized methods are modified regression betas, relative risk measures (relative volatiliy-accounting betas) and market drived beta. The most practical one of these methods is the beta estimation without regression, and that method can be used for both public and private companies.
1-Modified Regression Betas
Once a regression beta has been estimated it can be modified to reflect our need to estimate a beta for future time periods. We talked about one such adjustment that many services make, where they shrink all betas towards one after the estimation is done. There are, however, some estimation services that adopt far more sophisticated adjustments to make the regression betas reflect the current fundamentals of the firm. Income statement and balance sheet variables are important predictors of beta - high