Commun.Fac.Sci.Univ.Ank.Series A2-A3 Volume 60, Number 1, Pages 31-40 (2018) DOI: 10.1501/commua1-2_0000000109 ISSN 1303-6009 E-ISSN 2618-6462
http://communications.science.ankara.edu.tr/index.php?series=A2A3
Received by the editors: April 06, 2018; Accepted: May 21, 2018.
Key word and phrases: Cell outage detection, neural networks, 5G, self-organizing networks.
© 2018 Ankara University Communications Faculty of Sciences University of Ankara Series A2-A3: Physical Sciences and Engineering CELL OUTAGE DETECTION IN LTE-A CELLULAR SYSTEMS USING
NEURAL NETWORKS
HASAN TAHSİN OĞUZ AND AYKUT KALAYCIOĞLU
Abstract.Self-organizing networks (SONs) are considered as one of the key features for automation of network management in new generation of mobile communications. The upcoming fifth generation (5G) mobile networks are likely to offer new challenges for SON solutions. In SON structure, self-healing is an outstanding task which comes along with Cell Outage Detection (COD) and Cell Outage Compensation (COC). This study investigates the detection of cell outages by means of the metrics generated in the User Equipment (UE) with the help of pattern recognition methods such as Neural Networks, Logistic Regression and k-Means algorithms. Based on the metrics like Signal to Interference Noise Ratio (SINR), Reference Signal Received Quality (RSRQ), and Channel Quality Indicator (CQI), large amount of data is processed with supervised and unsupervised algorithms for the purpose of classifying outages and possible degradations. Our results suggest that in 79.74% of the simulation cases, Neural Network structure was able to identify the correct state of the cells whether it is outage or not with a true positive rate of 87.61% and a true negative rate of 71.87% whereas Logistic Regression gave a success rate of 78.73%, true positive rate of 88.15%, and true negative rate of 69.3%. As a future work, more sophisticated state-of-the-art deep learning mechanisms can lead us to much more successful results in cell outage detection.
1. Introduction
Next generation 5G systems is supposed to bring in ultra-dense deployments for the purpose of attaining more capacity, higher rates, ultra-low latency, massive connectivity and lower energy consumption. For better network maintenance, Third-Generation Partnership Project (3GPP) has already set forth the concept of Self Organizing Networks (SON) which involves Self-Configuration, Self-Optimization and Self-Healing. Cell Outage Detection is the first primary step for Self-Healing feature of the future 5G Self Organizing Networks. Hardware or software failures or external failures such as power supply or network connectivity are the main causes for outages. Cell outage is defined as a state of the eNodeB where all or most of the User Equipment (UEs) in the cell are unable to establish or keep its radio
connectivity with the result of reduction in capacity and coverage gaps. Especially in the existence of dense deployments, outages may not be detected for hours or even days. Traditionally, detection outages may require site visits, drive tests and manual analysis of the alarms generated on the Operations and Support Systems (OSS) which makes outage detection costly [1].
Cell Outage Detection (COD) is basically a binary classification problem to detect the degraded cell among healthy ones by making use of some UE statistics reported to the eNodeB. Future 5G mobile networks are supposed to handle COD autonomously. Therefore, detection algorithms employed on the Operations and Support System (OSS) should online monitor the UE statistics continuously and process the data measured on the UEs as suggested by 3GPP releases [2].
In previous studies, algorithms based on the spatial correlations among users have been used in cell outage detection [3]. Handover statistics were also employed on COD analysis [4]. In [5] COD has been handled via employing neighbor cell list reports and detecting outage cells by looking at the changes in the topology generated by visibility graphs. In [6], Channel Quality Indicator (CQI) based composite hypothesis has been utilized for outage detection. Machine learning has also been popular in outage detection. In [7] and [8], clustering algorithms and Bayesian Networks have been conducted for COD respectively. Hidden Markov Models (HMM), as another well-known classifier, was also studied in COD by training the data regarding healthy cells and outage cells for predicting the outage status of the eNodeBs [9]. K-Nearest Neighbors method has been conducted in [10] for COD in multi-tier networks. In [11], alternative to machine learning procedures, an anomaly detection method based on processing of big data emerged from Key Performance Indicators (KPI) has been introduced.
In this study, feed forward Multilayer Perceptron (MLP) type artificial Neural Networks are used for detection of cell outages in a network of eNodeBs. Neural Networks (NN) is one of the novel pattern recognition tools that have been used on many areas so far. Thereby, we employed supervised NN for the investigation of outage patterns based on the metrics measured on UEs placed in the cell. In this study we have used the metrics SINR, CQI and RSRQ as the input for the NN structure by training the system at the beginning and then applying the test data. The rest of the paper is organized as follows. In Section 2 the metrics and parameters for outage detection are briefly discussed. In Section 3, the details of the artificial Neural Network application and training scheme are introduced. Section 4 presents the results in a comparative manner along with other classification methods like
Logistic Regression and k-Means algorithms. Finally, we conclude the paper in Section 5.
2. Algorithm Description
The eNodeBs in the cellular wireless systems in this study are considered to be in two states as healthy and outage. Outage cells and healthy cells are assumed to radiate with a power of 0 dBm and 46 dBm respectively. Due to some reasons such as hardware or software failures, external power supply problems or even misconfiguration, and etc., when the output power of the eNodeB degrades, the cell goes into outage state. However service providers generally cannot realize these types of state changes very quickly and efficiently. Making use of the measured UE data related to received signal strength, which are also reported to eNodeBs, the outage state might be detected by use of artificial neural networks which have been employed in many fields so far. Therefore, feed forward artificial neural networks are preferred in this study for COD.
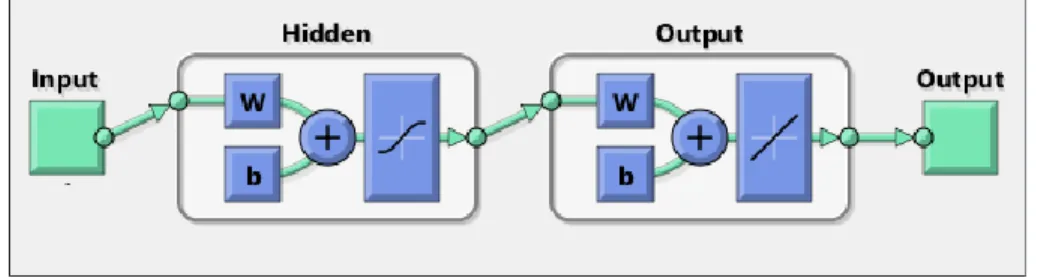
Feed forward neural networks are used in this study. Feed forward networks consist of series of neuron layers. The first layer has a connection from the network input. Each subsequent layer of neurons has a connection from the previous layer. The output layer is the last layer of the structure and the layers other than the output layer are hidden layers. Feed forward networks are suitable for mapping any finite-input finite-output problems. In our case some KPIs (Key Performance Indicator) are chosen as the input to the network and the output is the Boolean data regarding the outage.
Figure 1. Structure of a feed-forward network
In feed forward neural networks data is fed into the network from input layer. The output is computed according to the equation (1). In equation (1),
X
,W
,Y
, andT
are the input, weight, output and threshold matrices, respectively. Besides, denoted both in equation (1) and (2),f
is the activation function.𝑌 = 𝑓(𝑊 × 𝑋 − 𝑇) (1) 𝑓(𝑋) = 1
1+𝑒𝑋 (2) In this scheme, a weight adjustment process takes place in such a way that the weights are updated in every iteration until the desired output is achieved with an error of less than a threshold with the error fed back layer by layer. The adjustment of the weights is the training process for the neural network to accomplish the learning goal.
2.1. Detection Parameters
For the purpose of Cell Outage Detection we made use of some KPIs within Artificial Neural Networks (ANNs). The KPIs are collected from several sources like User Equipment, eNodeBs and Operation Support Systems. The combination of KPIs may provide critical information for accurate detection of a possible degradation on the cellular system. We have selected SINR, CQI and RSRQ as the parameters to work on. SINR is basically the signal to interference plus noise ratio of a UE. CQI is the channel quality indicator carrying information about the channel quality of the communication link. Third metric reference signal received quality (RSRQ), as the name implies, indicates the received quality of the reference signal. RSRQ is used for handover decisions and cell re-selection. In this study we made use of these three metrics measured on the UEs. With these parameters from the UEs being the inputs for the Neural Network, we trained the network and then tested the network for healthy and outage cases.
2.2. Training and Detection Procedure
Prior to detecting the outages, Neural Network structure should be trained so as to learn the patterns on healthy and outage states. For every UE on the site, the three parameters (SINR, CQI, and RSRQ) are collected for healthy and outage cases so that an input data of three features are provided. The input data matrix is fed into a feed-forward back propagation Neural Network. After training the net, test data regarding the outage and healthy cases are fed into the Neural Network structure as inputs and the resulting success is measured accordingly. The data structure input to the Neural Network is shown in Figure 2. Assuming
M
number of UEs on the site there is an input data matrix of dimensionMx3
and there is also a state matrix which have binary values either 1 or 0 indicating an outage or not, respectively.Figure 2. The structure of the input data
3. Simulation Environment
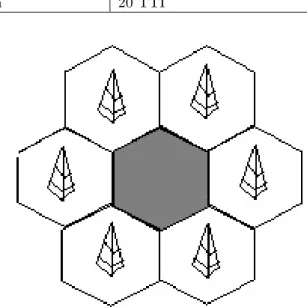
The KPI parameters in the input matrix are generated via Vienna LTE-A Simulator on MATLAB, which is a well-known downlink system level simulator for LTE/LTE-A networks [12]. In the simulations we employed eNodeBs with hexagonal geometry using 7 cells with one ring around the one in the middle, shown in Figure 3. We have assigned a total of 700 UEs with 100 UEs for each eNodeB and we used only the parameters of UEs belonging to the cell in the middle for the purpose of attaining more realistic KPIs with thorough interference effects. The radiating power of the healthy and outage cells were determined as 46 dBm and 0 dBm, respectively. According to the simulation scenario, the power of the healthy cell degrades from 46 dBm to 0 dBm. To generate the training data, the three KPI parameters are recorded for both healthy and outage states. For testing procedure, the same simulations with UEs on different random locations but the eNodeBs in their original places are operated so that the KPI parameters are generated. The resulting KPI parameters are tested with the formerly trained Neural Network. The parameters of the simulations are given in Table 1. In the simulation environment, we planned an urban type environment with an inter-cellular distance of 500 meters. 20 transmission time
interval (TTI) of simulation time was considered as suitable because it is sufficient for the radio access network parameters to settle down to their stable values.
Table 1. Simulation Parameters
Parameters Values
Cellular Layout 7 eNodeBs
BS Tx Power for healthy cells 46 dBm
BS Tx Power for outage cell 0 dBm
Path Loss Model TS36942 urban
Number of UEs per cell 100
UEs’ mobility Uniformly random distributed, random
walk model with constant speed
Channel Bandwidth 5 MHz
Inter eNodeB Distance 500 m
Simulation Duration 20 TTI
Figure 3. Hexagonal Cellular Structure with one ring around the center cell
4. RESULTS
Training process of the Neural Network starts with random initializations of the weights. For this reason the iterations may converge to local optima and may end with slight differences in terms of adjusted weights. Therefore the procedure of
training the net, testing the data and computing the success rate is repeated 50 times so that an overall average success rate is reached. At the end of simulations the success rate of detecting an outage has come out to be 79.74%. Classification Performance of Neural Networks is also given in Table 2. In the Neural Network structure 10 neurons are employed and 10-fold cross validation is applied on the classification process. For comparison purposes, Logistic Regression and K-Means Algorithms were also applied. Binary Logistic Regression (LR) is one of the well-known pattern recognition methods used in binary classification problems. It is basically a regression process where the regression coefficients are computed by employing multi-dimensional training data within a least squares error approach and the output is generated by using the exponential operation on computed coefficients along with the data to be tested. The overall success rate for Logistic Regression was 78.73% and contingency table is given in Table 3. (True Positive (TP) Rate = 88.15%, True Negative (TN) Rate = 69.3%, False Positive (FP) Rate = 28.13% and False Negative (FN) Rate = 13.39%). On the other hand, K-Means algorithm which is an unsupervised clustering method, was also applied on the test data. Due to unsupervised nature of K-Means Algorithm, the overall success rate was limited to 66.8%.
Table 2. Classification Analysis of Neural Networks (Contingency Table)
Real Outage Cases Real Healthy Cases
Classified as outage TP Rate = 87.61% FP Rate = 28.13%
Classified as healthy FN Rate = 13.39% TN Rate = 71.87%
Table 3. Classification Analysis of Logistic Regression (Contingency Table)
Real Outage Cases Real Healthy Cases
Classified as outage TP Rate = 88.15% FP Rate = 30.7%
Classified as healthy FN Rate = 11.85% TN Rate = 69.3%
In cellular systems with dense deployment, the detection rates of the outages may further be improved by employing larger training data because as training sets increase there may be more information available to the classification algorithm [13]. Moreover employing more powerful machine learning mechanisms such as state-of-the-art deep learning architectures may also improve the detection performance.
5. CONCLUSION
In this study we have classified the eNodeBs into two categories as healthy and outage. We have applied artificial Neural Networks, a novel method for pattern recognition purposes, on the three KPI parameters (SINR, CQI and RSRQ) of the UEs reported periodically to the eNodeBs. Our proposed classification method has an outage prediction accuracy of 79.74% and success rate with Logistic Regression was computed as 78.73%. Having larger training datasets and employing more efficient methods like state-of-the-art deep learning architectures can further increase accuracy. Our study conducted Neural Network approaches on outage detection with cellular structures having eNodeBs. Therefore this study should be enhanced by employing other pattern recognition/classification methods such as Support Vector Machines, Hidden Markov Models and Deep Learning Structures along with ultra-dense multi-tier network structures (femto, micro, pico cells) that are likely to take place in future 5G systems.
References
[1] Amirijoo, M & Jorguseski, Ljupco & Kürner, Thomas & Litjens, Remco & Eden, Michaela & Schmelz, Lars & Turke, U, Cell Outage Management in LTE Networks.
Proceedings of the 2009 6th International Symposium on Wireless
Communication Systems
, ISWCS'09. (2009), 600-604. 10.1109/ ISWCS.2009.5285232.
[2] 3rd Generation Partnership Project; Technical Specification Group Services and System Aspects; Telecommunications Management; Self-Organizing Networks (SON); Self-Healing Concepts and Requirements (Release 11), 3GPP TS 32.541, 2012-09, v11.0.0, 2012.
[3] Wang, W., Liao, Q. and Zhang, Q., COD: A cooperative cell outage detection architecture for self-organizing femtocell networks,
IEEE Trans. Wireless
Commun.
, vol. 13, no. 11, , (Nov. 2014), pp. 6007–6014.[4] De la Bandera, I., Barco, R., Munoz, P. and Serrano, I., Cell outage detection based on handover statistics,
IEEE Commun. Lett.,
vol. 19, no. 7, (Jul. 2015), pp. 1189–1192.[5] Mueller, C., Kaschub, M., Blankenhorn, C. and Wanke, S., A cell outage detection algorithm using neighbor cell list reports,
Proc. Int. Workshop
Self-Organizing Syst.
, (2008), pp. 218–229.[6] Liao, Q., Wiczanowski, M. and Stanczak, S., Toward cell outage detection with composite hypothesis testing,
Proc. IEEE ICC
, Jun. 2012, pp. 4883–4887.[7] Ma, Y., Peng, M., Xue, W. and Ji, X., A dynamic affinity propagation clustering algorithm for cell outage detection in self-healing networks,
Proc. IEEE WCNC
, (Apr. 2013), pp. 2266–2270.[8] Khanafer, R. et al., Automated diagnosis for UMTS networks using Bayesian network approach,
IEEE Trans. Veh. Technol.,
vol. 57, no. 4, (Jul. 2008), pp. 2451–2461.[9] Alias, M., Saxena, N. and Roy, A., Efficient Cell Outage Detection in 5G HetNets Using Hidden Markov Model,
IEEE Communications Letters
, vol. 20, no. 3, (March 2016), pp. 562-565.[10] Onireti, O.
et al
., A Cell Outage Management Framework for Dense Heterogeneous Networks,IEEE Transactions on Vehicular Technology
, vol. 65, no. 4, (April 2016), pp. 2097-2113.[11] Bodrog, L., Kajo, M., Kocsis S. and Schultz, B., A robust algorithm for anomaly detection in mobile networks,
2016 IEEE 27th Annual International Symposium
on Personal, Indoor, and Mobile Radio Communications (PIMRC)
, Valencia, (2016), pp. 1-6.[12] Ikuno, J. C., Wrulich, M. and Rupp, M., System Level Simulation of LTE Networks,
2010 IEEE 71st Vehicular Technology Conference
, Taipei, (2010), pp. 1-5.[13] Cortes, C., Jackel, L. D., Solla, S. A., Vapnik, V., and Denker, J. S., Learning curves: Asymptotic values and rate of convergence, In Cowan, J. D., Tesauro, G., and Alspector, J., editors, Morgan Kaufmann Publishers Inc.,
NIPS
volume 6, (1994), 327–334.Current Address:
HASAN TAHSİN OĞUZ: Ankara University Electrical andElectronics Engineering Department Gölbaşı ANKARA TURKEY E-mail : [email protected]
ORCID: https://orcid.org/0000-0002-8970-5511
Current Address:
AYKUT KALAYCIOĞLU: Ankara University Electrical andElectronics Engineering Department Gölbaşı ANKARA TURKEY E-mail :