This is the accepted manuscript made available via CHORUS. The article has been
published as:
Evidence of Two Resonant Structures in
e^{+}e^{-}→π^{+}π^{-}h_{c}
M. Ablikim et al. (BESIII Collaboration)
Phys. Rev. Lett. 118, 092002 — Published 1 March 2017
DOI:
10.1103/PhysRevLett.118.092002
M. Ablikim1, M. N. Achasov9,e, S. Ahmed14, X. C. Ai1, O. Albayrak5, M. Albrecht4, D. J. Ambrose44, A. Amoroso49A,49C, F. F. An1, Q. An46,a, J. Z. Bai1, O. Bakina23, R. Baldini Ferroli20A, Y. Ban31, D. W. Bennett19, J. V. Bennett5, N. Berger22, M. Bertani20A, D. Bettoni21A, J. M. Bian43, F. Bianchi49A,49C, E. Boger23,c, I. Boyko23, R. A. Briere5, H. Cai51, X. Cai1,a, O. Cakir40A, A. Calcaterra20A, G. F. Cao1, S. A. Cetin40B, J. Chai49C, J. F. Chang1,a, G. Chelkov23,c,d, G. Chen1, H. S. Chen1,
J. C. Chen1, M. L. Chen1,a, S. Chen41, S. J. Chen29, X. Chen1,a, X. R. Chen26, Y. B. Chen1,a, X. K. Chu31, G. Cibinetto21A, H. L. Dai1,a, J. P. Dai34, A. Dbeyssi14, D. Dedovich23, Z. Y. Deng1, A. Denig22, I. Denysenko23, M. Destefanis49A,49C, F. De Mori49A,49C, Y. Ding27, C. Dong30, J. Dong1,a, L. Y. Dong1, M. Y. Dong1,a, Z. L. Dou29, S. X. Du53, P. F. Duan1, J. Z. Fan39, J. Fang1,a, S. S. Fang1, X. Fang46,a, Y. Fang1, R. Farinelli21A,21B, L. Fava49B,49C, F. Feldbauer22, G. Felici20A,
C. Q. Feng46,a, E. Fioravanti21A, M. Fritsch14,22, C. D. Fu1, Q. Gao1, X. L. Gao46,a, Y. Gao39, Z. Gao46,a, I. Garzia21A, K. Goetzen10, L. Gong30, W. X. Gong1,a, W. Gradl22, M. Greco49A,49C, M. H. Gu1,a, Y. T. Gu12, Y. H. Guan1, A. Q. Guo1, L. B. Guo28, R. P. Guo1, Y. Guo1, Y. P. Guo22, Z. Haddadi25, A. Hafner22, S. Han51, X. Q. Hao15, F. A. Harris42, K. L. He1, F. H. Heinsius4, T. Held4, Y. K. Heng1,a, T. Holtmann4, Z. L. Hou1, C. Hu28, H. M. Hu1, J. F. Hu49A,49C, T. Hu1,a, Y. Hu1, G. S. Huang46,a, J. S. Huang15, X. T. Huang33, X. Z. Huang29, Z. L. Huang27, T. Hussain48, W. Ikegami Andersson50, Q. Ji1,
Q. P. Ji15, X. B. Ji1, X. L. Ji1,a, L. W. Jiang51, X. S. Jiang1,a, X. Y. Jiang30, J. B. Jiao33, Z. Jiao17, D. P. Jin1,a, S. Jin1, T. Johansson50, A. Julin43, N. Kalantar-Nayestanaki25, X. L. Kang1, X. S. Kang30, M. Kavatsyuk25, B. C. Ke5, P. Kiese22,
R. Kliemt10, B. Kloss22, O. B. Kolcu40B,h, B. Kopf4, M. Kornicer42, A. Kupsc50, W. K¨uhn24, J. S. Lange24, M. Lara19, P. Larin14, L. Lavezzi49C,1, H. Leithoff22, C. Leng49C, C. Li50, Cheng Li46,a, D. M. Li53, F. Li1,a, F. Y. Li31, G. Li1, H. B. Li1,
H. J. Li1, J. C. Li1, Jin Li32, K. Li13, K. Li33, Lei Li3, P. R. Li7,41, Q. Y. Li33, T. Li33, W. D. Li1, W. G. Li1, X. L. Li33, X. N. Li1,a, X. Q. Li30, Y. B. Li2, Z. B. Li38, H. Liang46,a, Y. F. Liang36, Y. T. Liang24, G. R. Liao11, D. X. Lin14, B. Liu34, B. J. Liu1, C. X. Liu1, D. Liu46,a, F. H. Liu35, Fang Liu1, Feng Liu6, H. B. Liu12, H. H. Liu1, H. H. Liu16, H. M. Liu1, J. Liu1,
J. B. Liu46,a, J. P. Liu51, J. Y. Liu1, K. Liu39, K. Y. Liu27, L. D. Liu31, P. L. Liu1,a, Q. Liu41, S. B. Liu46,a, X. Liu26, Y. B. Liu30, Y. Y. Liu30, Z. A. Liu1,a, Zhiqing Liu22, H. Loehner25, X. C. Lou1,a,g, H. J. Lu17, J. G. Lu1,a, Y. Lu1, Y. P. Lu1,a,
C. L. Luo28, M. X. Luo52, T. Luo42, X. L. Luo1,a, X. R. Lyu41, F. C. Ma27, H. L. Ma1, L. L. Ma33, M. M. Ma1, Q. M. Ma1, T. Ma1, X. N. Ma30, X. Y. Ma1,a, Y. M. Ma33, F. E. Maas14, M. Maggiora49A,49C, Q. A. Malik48, Y. J. Mao31, Z. P. Mao1, S. Marcello49A,49C, J. G. Messchendorp25, G. Mezzadri21B, J. Min1,a, T. J. Min1, R. E. Mitchell19, X. H. Mo1,a, Y. J. Mo6,
C. Morales Morales14, N. Yu. Muchnoi9,e, H. Muramatsu43, P. Musiol4, Y. Nefedov23, F. Nerling10, I. B. Nikolaev9,e, Z. Ning1,a, S. Nisar8, S. L. Niu1,a, X. Y. Niu1, S. L. Olsen32, Q. Ouyang1,a, S. Pacetti20B, Y. Pan46,a, P. Patteri20A, M. Pelizaeus4, H. P. Peng46,a, K. Peters10,i, J. Pettersson50, J. L. Ping28, R. G. Ping1, R. Poling43, V. Prasad1, H. R. Qi2, M. Qi29, S. Qian1,a, C. F. Qiao41, L. Q. Qin33, N. Qin51, X. S. Qin1, Z. H. Qin1,a, J. F. Qiu1, K. H. Rashid48, C. F. Redmer22,
M. Ripka22, G. Rong1, Ch. Rosner14, X. D. Ruan12, A. Sarantsev23,f, M. Savri´e21B, C. Schnier4, K. Schoenning50, W. Shan31, M. Shao46,a, C. P. Shen2, P. X. Shen30, X. Y. Shen1, H. Y. Sheng1, W. M. Song1, X. Y. Song1, S. Sosio49A,49C,
S. Spataro49A,49C, G. X. Sun1, J. F. Sun15, S. S. Sun1, X. H. Sun1, Y. J. Sun46,a, Y. Z. Sun1, Z. J. Sun1,a, Z. T. Sun19, C. J. Tang36, X. Tang1, I. Tapan40C, E. H. Thorndike44, M. Tiemens25, I. Uman40D, G. S. Varner42, B. Wang30, B. L. Wang41,
D. Wang31, D. Y. Wang31, K. Wang1,a, L. L. Wang1, L. S. Wang1, M. Wang33, P. Wang1, P. L. Wang1, W. Wang1,a,
W. P. Wang46,a, X. F. Wang39, Y. Wang37, Y. D. Wang14, Y. F. Wang1,a, Y. Q. Wang22, Z. Wang1,a, Z. G. Wang1,a, Z. H. Wang46,a, Z. Y. Wang1, Z. Y. Wang1, T. Weber22, D. H. Wei11, P. Weidenkaff22, S. P. Wen1, U. Wiedner4, M. Wolke50,
L. H. Wu1, L. J. Wu1, Z. Wu1,a, L. Xia46,a, L. G. Xia39, Y. Xia18, D. Xiao1, H. Xiao47, Z. J. Xiao28, Y. G. Xie1,a, Yuehong Xie6, Q. L. Xiu1,a, G. F. Xu1, J. J. Xu1, L. Xu1, Q. J. Xu13, Q. N. Xu41, X. P. Xu37, L. Yan49A,49C, W. B. Yan46,a, W. C. Yan46,a, Y. H. Yan18, H. J. Yang34,j, H. X. Yang1, L. Yang51, Y. X. Yang11, M. Ye1,a, M. H. Ye7, J. H. Yin1, Z. Y. You38, B. X. Yu1,a, C. X. Yu30, J. S. Yu26, C. Z. Yuan1, Y. Yuan1, A. Yuncu40B,b, A. A. Zafar48, Y. Zeng18, Z. Zeng46,a, B. X. Zhang1,
B. Y. Zhang1,a, C. C. Zhang1, D. H. Zhang1, H. H. Zhang38, H. Y. Zhang1,a, J. Zhang1, J. J. Zhang1, J. L. Zhang1, J. Q. Zhang1, J. W. Zhang1,a, J. Y. Zhang1, J. Z. Zhang1, K. Zhang1, L. Zhang1, S. Q. Zhang30, X. Y. Zhang33, Y. Zhang1, Y. Zhang1, Y. H. Zhang1,a, Y. N. Zhang41, Y. T. Zhang46,a, Yu Zhang41, Z. H. Zhang6, Z. P. Zhang46, Z. Y. Zhang51, G. Zhao1,
J. W. Zhao1,a, J. Y. Zhao1, J. Z. Zhao1,a, Lei Zhao46,a, Ling Zhao1, M. G. Zhao30, Q. Zhao1, Q. W. Zhao1, S. J. Zhao53, T. C. Zhao1, Y. B. Zhao1,a, Z. G. Zhao46,a, A. Zhemchugov23,c, B. Zheng47, J. P. Zheng1,a, W. J. Zheng33, Y. H. Zheng41,
B. Zhong28, L. Zhou1,a, X. Zhou51, X. K. Zhou46,a, X. R. Zhou46,a, X. Y. Zhou1, K. Zhu1, K. J. Zhu1,a, S. Zhu1, S. H. Zhu45, X. L. Zhu39, Y. C. Zhu46,a, Y. S. Zhu1, Z. A. Zhu1, J. Zhuang1,a, L. Zotti49A,49C, B. S. Zou1, J. H. Zou1
(BESIII Collaboration)
2
2 Beihang University, Beijing 100191, People’s Republic of China
3Beijing Institute of Petrochemical Technology, Beijing 102617, People’s Republic of China 4 Bochum Ruhr-University, D-44780 Bochum, Germany
5 Carnegie Mellon University, Pittsburgh, Pennsylvania 15213, USA 6 Central China Normal University, Wuhan 430079, People’s Republic of China
7China Center of Advanced Science and Technology, Beijing 100190, People’s Republic of China
8COMSATS Institute of Information Technology, Lahore, Defence Road, Off Raiwind Road, 54000 Lahore, Pakistan 9G.I. Budker Institute of Nuclear Physics SB RAS (BINP), Novosibirsk 630090, Russia
10 GSI Helmholtzcentre for Heavy Ion Research GmbH, D-64291 Darmstadt, Germany 11 Guangxi Normal University, Guilin 541004, People’s Republic of China
12 Guangxi University, Nanning 530004, People’s Republic of China 13Hangzhou Normal University, Hangzhou 310036, People’s Republic of China 14Helmholtz Institute Mainz, Johann-Joachim-Becher-Weg 45, D-55099 Mainz, Germany
15 Henan Normal University, Xinxiang 453007, People’s Republic of China
16Henan University of Science and Technology, Luoyang 471003, People’s Republic of China 17 Huangshan College, Huangshan 245000, People’s Republic of China
18 Hunan University, Changsha 410082, People’s Republic of China 19 Indiana University, Bloomington, Indiana 47405, USA 20 (A)INFN Laboratori Nazionali di Frascati, I-00044, Frascati,
Italy; (B)INFN and University of Perugia, I-06100, Perugia, Italy
21(A)INFN Sezione di Ferrara, I-44122, Ferrara, Italy; (B)University of Ferrara, I-44122, Ferrara, Italy 22Johannes Gutenberg University of Mainz, Johann-Joachim-Becher-Weg 45, D-55099 Mainz, Germany
23 Joint Institute for Nuclear Research, 141980 Dubna, Moscow region, Russia
24Justus-Liebig-Universitaet Giessen, II. Physikalisches Institut, Heinrich-Buff-Ring 16, D-35392 Giessen, Germany 25KVI-CART, University of Groningen, NL-9747 AA Groningen, The Netherlands
26 Lanzhou University, Lanzhou 730000, People’s Republic of China 27 Liaoning University, Shenyang 110036, People’s Republic of China 28 Nanjing Normal University, Nanjing 210023, People’s Republic of China
29 Nanjing University, Nanjing 210093, People’s Republic of China 30 Nankai University, Tianjin 300071, People’s Republic of China 31 Peking University, Beijing 100871, People’s Republic of China
32 Seoul National University, Seoul, 151-747 Korea 33 Shandong University, Jinan 250100, People’s Republic of China 34 Shanghai Jiao Tong University, Shanghai 200240, People’s Republic of China
35 Shanxi University, Taiyuan 030006, People’s Republic of China 36 Sichuan University, Chengdu 610064, People’s Republic of China
37 Soochow University, Suzhou 215006, People’s Republic of China 38 Sun Yat-Sen University, Guangzhou 510275, People’s Republic of China
39 Tsinghua University, Beijing 100084, People’s Republic of China
40(A)Ankara University, 06100 Tandogan, Ankara, Turkey; (B)Istanbul Bilgi University, 34060 Eyup, Istanbul, Turkey;
(C)Uludag University, 16059 Bursa, Turkey; (D)Near East University, Nicosia, North Cyprus, Mersin 10, Turkey
41University of Chinese Academy of Sciences, Beijing 100049, People’s Republic of China 42 University of Hawaii, Honolulu, Hawaii 96822, USA
43 University of Minnesota, Minneapolis, Minnesota 55455, USA 44 University of Rochester, Rochester, New York 14627, USA
45University of Science and Technology Liaoning, Anshan 114051, People’s Republic of China 46University of Science and Technology of China, Hefei 230026, People’s Republic of China
47 University of South China, Hengyang 421001, People’s Republic of China 48 University of the Punjab, Lahore-54590, Pakistan
49 (A)University of Turin, I-10125, Turin, Italy; (B)University of Eastern
50 Uppsala University, Box 516, SE-75120 Uppsala, Sweden 51 Wuhan University, Wuhan 430072, People’s Republic of China 52 Zhejiang University, Hangzhou 310027, People’s Republic of China 53 Zhengzhou University, Zhengzhou 450001, People’s Republic of China
aAlso at State Key Laboratory of Particle Detection and Electronics, Beijing 100049, Hefei 230026, People’s Republic of China b Also at Bogazici University, 34342 Istanbul, Turkey
c Also at the Moscow Institute of Physics and Technology, Moscow 141700, Russia d Also at the Functional Electronics Laboratory, Tomsk State University, Tomsk, 634050, Russia
eAlso at the Novosibirsk State University, Novosibirsk, 630090, Russia f Also at the NRC ”Kurchatov Institute, PNPI, 188300, Gatchina, Russia
g Also at University of Texas at Dallas, Richardson, Texas 75083, USA h Also at Istanbul Arel University, 34295 Istanbul, Turkey
i Also at Goethe University Frankfurt, 60323 Frankfurt am Main, Germany j Also at Institute of Nuclear and Particle Physics, Shanghai Key Laboratory for
Particle Physics and Cosmology, Shanghai 200240, People’s Republic of China
The cross sections ofe+e− → π+π−h
c at center-of-mass energies from 3.896 to 4.600 GeV are
mea-sured using data samples collected with the BESIII detector operating at the Beijing Electron Positron Col-lider. The cross sections are found to be of the same order of magnitude as those ofe+e−→π+π−J/ψ and
e+e− →π+π−ψ(2S), but the line shape is inconsistent with the Y states observed in the latter two modes.
Two structures are observed in thee+e−→π+π−h
ccross sections around 4.22 and 4.39 GeV/c2, which we
callY (4220) and Y (4390), respectively. A fit with a coherent sum of two Breit-Wigner functions results in a mass of(4218.4+5.5
−4.5
±0.9) MeV/c2and a width of(66.0+12.3
−8.3
±0.4) MeV for the Y (4220), and a mass of (4391.5+6.3
−6.8
±1.0) MeV/c2and a width of(139.5+16.2 −20.6
±0.6) MeV for the Y (4390), where the first uncer-tainties are statistical and the second ones systematic. The statistical significance ofY (4220) and Y (4390) is 10σ over one structure assumption.
PACS numbers: 14.40.Rt, 14.40.Pq, 13.66.Bc, 13.25.Gv
In the last decade, a series of charmonium-like states have been observed at e+e− colliders. These states
chal-lenge the understanding of charmonium spectroscopy as well as QCD calculations [1, 2]. According to potential mod-els, there are five vector charmonium states between the 1D state ψ(3770) and 4.7 GeV/c2, namely the 3S, 2D, 4S,
3D, and 5S states [1]. From experimental studies, besides the three well established structures observed in the inclu-sive hadronic cross section [3],i.e., ψ(4040), ψ(4160), and ψ(4415), five Y states, i.e., Y (4008), Y (4230), Y (4260), Y (4360), and Y (4660) have been reported in initial state ra-diation (ISR) processese+e−→ γ
ISRπ+π−J/ψ or e+e− →
γISRπ+π−ψ(2S) at the B-factories [4–11] or in the
di-rect production processes at the CLEO and BESIII experi-ments [12, 13] The overpopulation of structures in this re-gion and the mismatch of the properties between the poten-tial model prediction and experimental measurements make them good candidates for exotic states. Various scenarios have been proposed, which interpret one or some of them as hybrid states, tetraquark states, or molecular states [14].
The study of charmonium-like states in different produc-tion processes supplies useful informaproduc-tion on their proper-ties. The process e+e− → π+π−h
c was first studied by
CLEO [15] at center-of-mass (CM) energies√s from 4.000 to 4.260 GeV. A10σ signal at 4.170 GeV and a hint of a rising cross section at 4.260 GeV were observed. Using data
sam-ples taken at 13 CM energies from 3.900 to 4.420 GeV [16], BESIII reported the measurement of the cross section of e+e− → π+π−h
c [17]. Unlike the line shape of the
pro-cesse+e− → π+π−J/ψ, there is a broad structure in the
high energy region with a possible local maximum at around 4.23 GeV ine+e− → π+π−h
c. Based on the CLEO
mea-surement at√s = 4.170 GeV and the BESIII measurement, two assumptions were made to describe the cross section in Ref. [18]. In both assumptions, a narrow structure exists at around 4.23 GeV, while the situation in the high energy re-gion is unclear due to the lack of experimental data.
In this Letter, we present a follow-up study ofe+e− →
π+π−h
cat CM energies from 3.896 to 4.600 GeV using data
samples taken at 79 energy points [19] with the BESIII de-tector [20]. Two resonant structures are observed at √s = 4.22 and 4.39 GeV (hereafter referred to as Y (4220) and Y (4390)). The integrated luminosity at each energy point is measured with an uncertainty of 1.0% using large-angle Bhabha events [21, 22]. There are 17 energy points where the integrated luminosities are larger than 40 pb−1 (referred
to as ‘XY Z data sample’ hereafter), while the integrated lu-minosities for the other energy points are smaller than 20 pb−1 (referred to as ‘R-scan data sample’ hereafter). The CM en-ergies for theXY Z data sample are measured with e+e− →
γISR/FSRµ+µ−events with an uncertainty of±0.8 MeV [23],
4
method is used for the R-scan data sample with multi-hadron final states [24].
In this study, the hc is reconstructed via its
electric-dipole transition hc → γηc with ηc → Xi, where
Xi is one of 16 exclusive hadronic final states: p¯p,
2(π+π−), 2(K+K−), π+π−K+K−, π+π−p¯p, 3(π+π−), 2(π+π−)K+K−,K0 SK±π∓,KS0K±π∓π+π−, K+K−π0, p¯pπ0, K+K−η, π+π−η, 2(π+π−)η, π+π−π0π0 , and 2(π+π−π0). Here, the K0
S is reconstructed using its decay
toπ+π−, and theπ0andη from the γγ final state.
Monte Carlo (MC) simulated events are used to optimize the selection criteria, determine the detection efficiency, and estimate the possible backgrounds. The simulation of the BESIII detector is based on GEANT4 [25] and includes the geometric description of the BESIII detector and the detec-tor response. For the signal process, we use an MC sample fore+e− → π+π−h
c process generated according to phase
space. ISR is simulated withKKMC[26] with a maximum en-ergy for the ISR photon corresponding to theπ+π−h
c mass
threshold.
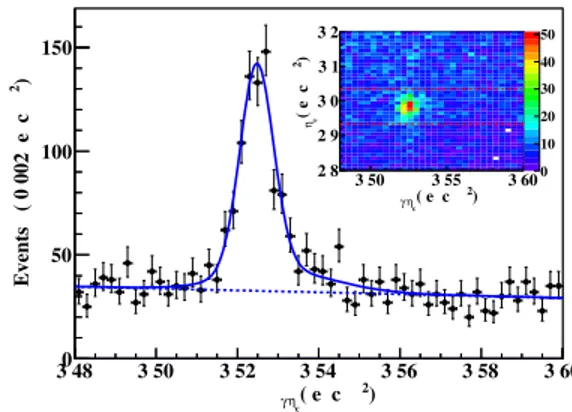
We select signal candidates with the same method as that described in Ref. [17]. Figure 1 shows the scatter plot of the invariant mass of the ηc candidate versus the one of the hc
candidate and the invariant mass distribution of γηc in the
ηc signal region for the data sample at√s = 4.416 GeV.
A clear hc → γηc signal is observed. The ηc signal
re-gion is defined by a mass window around the nominal ηc
mass [3], which is within±50 MeV/c2with efficiency about
84% (±45 MeV/c2with efficiency about 80%) from MC
sim-ulation for final states with only charged orK0
Sparticles (for
those includingπ0orη).
We determine the number ofπ+π−h
csignal events (nobshc ) from theγηc invariant mass distribution. For theXY Z data
sample, theγηc mass spectrum is fitted with the MC
simu-lated signal shape convolved with a Gaussian function to re-flect the mass resolution difference between the data and MC simulation, together with a linear background. The fit to the data sample at√s = 4.416 GeV is shown in Fig. 1. The tail on the high mass side is due to events with ISR (ISR pho-ton undetected); this is simulated withKKMCin MC, and its fraction is fixed in the fit. For the data samples with large statistics (√s = 4.226, 4.258, 4.358, and 4.416 GeV), the fit is applied to the 16ηc decay modes simultaneously with
the number of signal events in each decay mode constrained by the corresponding branching fraction [27]. For the data samples at the other energy points, we fit the mass spectrum summed over allηcdecay modes. For the R-scan data sample,
the number of signal events is calculated by counting the en-tries in thehcsignal region [3.515, 3.535] GeV/c2(nsig) and
the entries in thehcsideband regions [3.475, 3.495] GeV/c2
and [3.555, 3.575] GeV/c2(nside) using the formulanobs hc = nsig−f ·nside. Here, the scale factorf = 0.5 is the ratio of the
size of the signal region and the background region, and the background is assumed to be distributed linearly in the region
of interest. ) 2 (GeV/c c η γ M 3.48 3.50 3.52 3.54 3.56 3.58 3.60 ) 2 Events / ( 0.002 GeV/c 0 50 100 150 ) 2 (GeV/c c η γ M 3.50 3.55 3.60 ) 2 (GeV/cηc M 2.8 2.9 3.0 3.1 3.2 0 10 20 30 40 50
FIG. 1. TheMγηcdistribution in theηcsignal region of4.416 GeV
data. Points with error bars are the data and the curves are the best fit described in the text. The inset is the scatter plot of the mass of the
ηccandidateMηcversus the mass of thehccandidateMγηcfor the
same data sample.
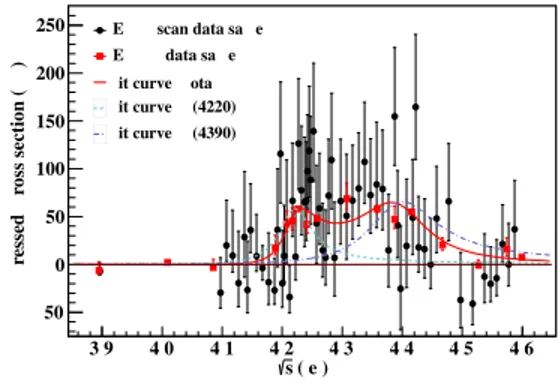
The Born cross section is calculated from
σB= n obs hc L(1 + δ)|1 + Π|2B 1P16i=1ǫiB2(i) , wherenobs
hc is the number of observed signal events, L is the integrated luminosity,(1 + δ) is the ISR correction factor, |1 + Π|2is the correction factor for vacuum polarization [28],
B1is the branching fraction ofhc→ γηc[3],ǫiandB2(i) are
the detection efficiency and branching fraction for thei-th ηc
decay mode [27], respectively. The ISR correction factor is obtained using the QED calculation as described in Ref. [29] and taking the formula used to fit the cross section measured in this analysis after two iterations as input. The Born cross sections are summarised in the supplemental material [19] to-gether with all numbers used in the calculation of the Born cross sections. The dressed cross sections (including vac-uum polarization effects) are shown in Fig. 2 with dots and squares for R-scan andXY Z data sample, respectively. The cross sections are of the same order of magnitude as those of thee+e− → π+π−J/ψ and e+e− → π+π−ψ(2S) [4–
12], but follow a different line shape. The cross section drops in the high energy region, but more slowly than for the e+e−→ π+π−J/ψ process.
Systematic uncertainties in the cross section measurement mainly come from the luminosity measurement, the branching fraction ofhc → γηc, andηc → Xi, the detection efficiency,
the ISR correction factor, and the fit. The uncertainty due to the vacuum polarization is negligible. The uncertainty in the integrated luminosity is 1% at each energy point. The uncer-tainty sources for the detection efficiency include systematic uncertainties in tracking efficiency (1% per track), photon re-construction (1% per photon), andK0
S reconstruction (1.2%
perK0
win-dow requirement (1% perπ0/η), the χ2
4C requirement,ηc
pa-rameters and line shape, possible intermediate states in the π±h
c andπ+π− mass spectra, intermediate states inηc
de-cays (included in the uncertainty from the branching fraction ofηc→ Xi), and the limited statistics of the MC simulation.
The uncertainty due to the χ2
4C requirement is estimated
by correcting the helix parameters of the simulated charged tracks to match the resolution found in data, and repeating the analysis [30]. Uncertainties due to theηcparameters and line
shape are estimated by varying them in the MC simulation. When producing MC events for thee+e− → π+π−h
c
pro-cess through the intermediate states Zc(3900) or Zc(4020),
the parameters of theZc(3900) and Zc(4020) are fixed to the
average values from the published measurements [11, 17, 31– 33]. The quantum numbers of bothZc(3900) and Zc(4020)
are assumed to beJP = 1+. The differences in the efficiency
obtained from phase space MC samples and those with inter-mediateZcstates are taken as the uncertainties from possible
intermediate states in theπ±h
csystem. The uncertainty from
intermediate states in the π+π− system is estimated by
re-weighting theπ+π−mass distribution in the phase space MC
sample according to the data, and the resulting difference in the efficiency is considered as uncertainty. The uncertainties due to data/MC differences in the detection efficiency are de-termined to be between 5.5% and 10.8%, depending on theηc
decay modes and the CM energy. Combining the uncertainties for the branching fractions ofηcdecays [27], the uncertainties
for the average efficiencyP16
i=1ǫiB2(i) are between 6.4% and
9.1% depending on the CM energy.
The uncertainty in the ISR correction is estimated as de-scribed in Ref. [31]. Uncertainties due to the choice of the signal shape, the background shape, the mass resolution, and fit range are estimated by changing the hc and ηc resonant
parameters and line shapes in the MC simulation, changing the background function from a linear to a second-order poly-nomial, changing the mass resolution difference between the data and the MC simulation by one standard deviation, and by extending or shrinking the fit range.
Assuming all of the sources are independent, the total sys-tematic uncertainty in theπ+π−h
ccross section measurement
is determined to be 9.4%–13.6% depending on the CM en-ergy. The uncertainty inB1 is 11.8% [3], common to all
en-ergy points, and quoted separately in the cross section mea-surement. Altogether, the quadratic sum of the common sys-tematic errors at each energy point accounts for about 95% of the total systematic error.
A maximum likelihood method is used to fit the dressed cross sections to determine the parameters of the resonant structures. The likelihood is constructed taking the fluctua-tions of the number of signal and background events into ac-count (the definition is described in the supplemental mate-rial [19]). Assuming that theπ+π−h
csignal comes from two
resonances, the cross section is parameterized as the coherent sum of two constant width relativistic Breit-Wigner functions,
i.e., σ(m) = |B1(m) · s P (m) P (M1) + eiφB 2(m) · s P (m) P (M2)| 2, whereBj(m) = √ 12π(ΓeeB)jΓj m2−M2
j+iMjΓj withj = 1 or 2 is the Breit-Wigner function, andP (m) is the 3-body phase space factor. The masses Mj, the total widths Γj, the products
of the electronic partial width and the branching fraction to π+π−h
c (ΓeeB)j, and the relative phaseφ between the two
Breit-Wigner functions are free parameters in the fit. Only the statistical uncertainty is considered in the fit. There are two solutions from the fit, one of them is shown in Fig. 2. The second solution is very close to the one shown here. This can been proved analytically using Eq.(9) in Ref. [34], which relates the two solutions from the fit when a sum of two co-herent Breit-Wigner functions is used. The parameters deter-mined from the fit areM1 = (4218.4+5.5−4.5) MeV/c2, Γ1 =
(66.0+12.3−8.3 ) MeV, and (ΓeeB)1= (4.6+2.9−1.4) eV for Y (4220),
M2 = (4391.5+6.3−6.8) MeV/c2,Γ2 = (139.5+16.2−20.6) MeV, and
(ΓeeB)2 = (11.6+5.0−4.4) eV for Y (4390). The relative phase
φ is (3.1+0.7−0.9) rad. The correlation matrix of the fit parame-ters shows large correlation between the(ΓeeB)j andφ (see
supplemental material [19]). (GeV) s 3.9 4.0 4.1 4.2 4.3 4.4 4.5 4.6 D re ss e d C ro ss s e c ti o n ( p b ) -50 0 50 100 150 200
250 BESIII: R-scan data sample
BESIII: XYZ data sample F it curve: T otal F it curve: Y (4220) F it curve: Y (4390)
FIG. 2. Fit to the dressed cross section ofe+e− →π+π−h
cwith
the coherent sum of two Breit-Wigner functions (solid curve). The dash (dash-dot) curve shows the contribution from the two structures Y (4220) (Y (4390)). The dots with error bars are the cross sections for R-scan data sample, the squares with error bars are the cross
sec-tions forXY Z data sample. Here the error bars are statistical
uncer-tainty only.
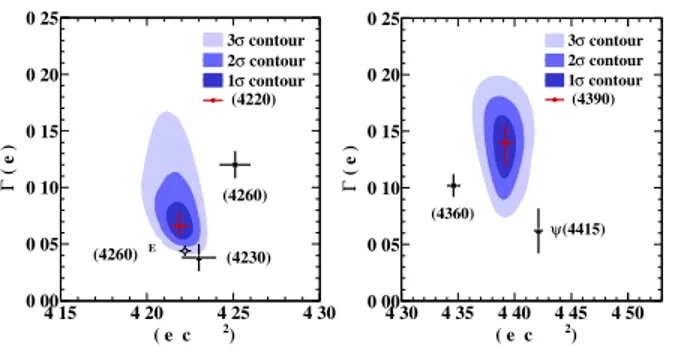
The likelihood contours in the mass and width planes for Y (4220) and Y (4390) are shown in Fig. 3, together with the positions ofY (4230), Y (4260), Y (4360), and ψ(4415) with the parameters taken from the latest PDG average [3]. The low-lying resonance from the study ofe+e− → π+π−J/ψ
at BESIII [35], marked asY (4260)BESIIIin the plot, is also
out-6
side the3σ contours, while Y (4230) and Y (4260)BESIIIare
overlapped with the3σ contour of Y (4220).
) 2 M (GeV/c 4.15 4.20 4.25 4.30 (GeV) Γ 0.00 0.05 0.10 0.15 0.20 0.25 contour σ 3 contour σ 2 contour σ 1 Y(4220) PDG Y(4260) Y(4230) BESIII Y(4260) ) 2 M (GeV/c 4.30 4.35 4.40 4.45 4.50 (GeV) Γ 0.00 0.05 0.10 0.15 0.20 0.25 contour σ 3 contour σ 2 contour σ 1 Y(4390) Y(4360) (4415) ψ
FIG. 3. The likelihood contours in the mass and width planes for Y (4220) (left panel) and Y (4390) (right panel). The filled areas
are up to3σ likelihood contours and the dots with error bars are the
locations ofY or ψ states. The parameters of Y (4260)PDGare taken
from the PDG average [3] andY (4260)BESIIIfrom the measurement
ofe+e−→π+π−J/ψ at BESIII [35].
Fitting the dressed cross section with only one resonance yields a worse result, the change of the likelihood value from two resonances to one resonance is [∆(−2lnL) = 113.5]. Taking the change in the number of degrees of freedom (4) into account, the significance for the assumption of two reso-nant structures over the assumption of one resoreso-nant structure is10σ. The fit with the coherent sum of one Breit-Wigner function and a phase space term gives a worse result as well, the change of the likelihood value is[∆(−2lnL) = 66.8]. We also fit the cross section with the coherent sum of three Breit-Wigner functions, or the coherent sum of two Breit-Breit-Wigner functions and a phase space term. Both assumptions improve the fit quality, but the significances of the third resonance and the phase space term are only2.6σ and 2.9σ, respectively.
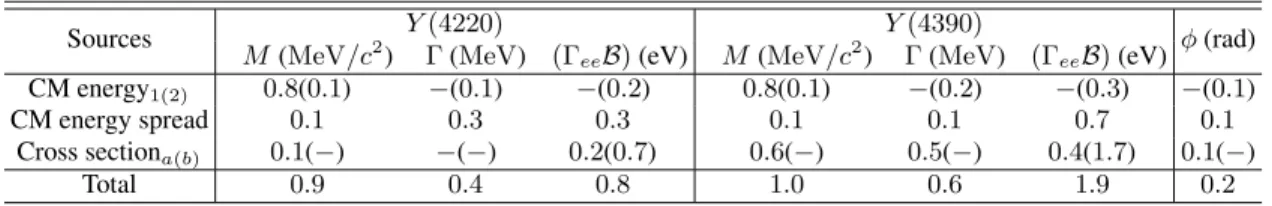
The systematic uncertainties in the resonance parameters mainly come from the absolute CM energy measurement, the CM energy spread, and the systematic uncertainty on the cross section measurement. The uncertainty from the CM energy measurement includes the uncertainty of the CM energy and the assumption made in the measurement for R-scan data sam-ple. Due to the low statistics at each energy point in the R-scan data sample, we approximate the difference between the requested and the actual CM energy by a common constant. To assess the systematic uncertainty connected with this as-sumption, we replace the constant by a CM energy-dependent second-order polynomial. The systematic uncertainty of the CM energy is common for all the energy points in the two data samples and will propagate to the mass measurement (0.8 MeV). The changes on the parameters are taken as un-certainty. The uncertainty from CM energy spread is esti-mated by convoluting the fit formula with a Gaussian function with a width of 1.6 MeV, which is beam spread, measured by the Beam Energy Measurement System [36]. The uncertainty from the cross section measurement is divided into two parts.
The first one is uncorrelated among the different CM energy points and comes mainly from the fit to theγηcinvariant mass
spectrum to determine the signal yields. The corresponding uncertainty is estimated by including the uncertainty in the fit to the cross section, and taking the differences on the param-eters as uncertainties. The second part includes all the other sources, is common for all data points (14.8%), and only af-fects theΓeeB measurement. Table I summarizes the
system-atic uncertainty in the resonance parameters. In summary, we measure thee+e−→ π+π−h
cBorn cross
section using data at 79 CM energy points from 3.896 to 4.600 GeV. Assuming theπ+π−h
c events come from two
resonances, we obtainM = (4218.4+5.5−4.5 ± 0.9) MeV/c2,
Γ = (66.0+12.3−8.3 ±0.4) MeV, and (ΓeeB) = (4.6+2.9−1.4±0.8) eV
forY (4220), and M = (4391.5+6.3−6.8 ± 1.0) MeV/c2, Γ =
(139.5+16.2−20.6± 0.6) MeV, and (ΓeeB) = (11.6+5.0−4.4± 1.9) eV
forY (4390), with a relative phase of φ = (3.1+0.7−0.9± 0.2) rad.
The first errors are statistical and the second are systematic. The parameters of these structures are different from those of Y (4260), Y (4360), and ψ(4415) [3]. The resonance param-eters ofY (4220) are consistent with those of the resonance observed ine+e−→ ωχ
c0[13].
The two resonances observed ine+e−→ π+π−h
cprocess
are located in the mass region between 4.2 and 4.4 GeV/c2,
where the vector charmonium hybrid states are predicted from various QCD calculations [37–39]. The mass of Y (4220) is lower than that of Y (4260) observed in the e+e− →
π+π−J/ψ process. The smaller mass is consistent with some
of the theoretical calculations for the mass ofY (4260) when explaining it as aD1D molecule [40, 41].¯
The BESIII collaboration thanks the staff of BEPCII and the IHEP computing center for their strong support. This work is supported in part by National Key Basic Research Program of China under Contract No. 2015CB856700; Na-tional Natural Science Foundation of China (NSFC) under Contracts Nos. 11235011, 11322544, 11335008, 11425524; the Chinese Academy of Sciences (CAS) Large-Scale Sci-entific Facility Program; the CAS Center for Excellence in Particle Physics (CCEPP); the Collaborative Innovation Cen-ter for Particles and InCen-teractions (CICPI); Joint Large-Scale Scientific Facility Funds of the NSFC and CAS under Con-tracts Nos. U1232201, U1332201; CAS under ConCon-tracts Nos. KJCX2-YW-N29, KJCX2-YW-N45; 100 Talents Program of CAS; National 1000 Talents Program of China; INPAC and Shanghai Key Laboratory for Particle Physics and Cosmol-ogy; German Research Foundation DFG under Contracts Nos. Collaborative Research Center CRC 1044, FOR 2359; Istituto Nazionale di Fisica Nucleare, Italy; Joint Large-Scale Sci-entific Facility Funds of the NSFC and CAS under Contract No. U1532257; Joint Large-Scale Scientific Facility Funds of the NSFC and CAS under Contract No. U1532258; Konin-klijke Nederlandse Akademie van Wetenschappen (KNAW) under Contract No. 530-4CDP03; Ministry of Develop-ment of Turkey under Contract No. DPT2006K-120470;
TABLE I. The systematic uncertainty in the measurement of the resonance parameters. CM energy1,2 represent the uncertainty from the systematic uncertainty of CM energy measurement and the assumption made in the CM energy measurement for R-scan data sample,
respec-tively. Cross sectiona(b)represents the uncertainty from the systematic uncertainties of the cross section measurement which are un-correlated
(common) in each energy point.
Sources Y (4220) Y (4390) φ (rad)
M (MeV/c2) Γ (MeV) (Γ
eeB) (eV) M (MeV/c2) Γ (MeV) (ΓeeB) (eV)
CM energy1(2) 0.8(0.1) −(0.1) −(0.2) 0.8(0.1) −(0.2) −(0.3) −(0.1)
CM energy spread 0.1 0.3 0.3 0.1 0.1 0.7 0.1
Cross sectiona(b) 0.1(−) −(−) 0.2(0.7) 0.6(−) 0.5(−) 0.4(1.7) 0.1(−)
Total 0.9 0.4 0.8 1.0 0.6 1.9 0.2
NSFC under Contract No. 11275266; The Swedish Re-sarch Council; U. S. Department of Energy under Con-tracts Nos. FG02-05ER41374, SC-0010504, DE-SC0012069, DESC0010118; U.S. National Science Founda-tion; University of Groningen (RuG) and the Helmholtzzen-trum fuer Schwerionenforschung GmbH (GSI), Darmstadt; WCU Program of National Research Foundation of Korea un-der Contract No. R32-2008-000-10155-0.
[1]For a recent review, see N. Brambilla et al., Eur. Phys. J. C 71, 1534 (2011).
[2]R. A. Briceno et al., Chin. Phys. C 40(4), 042001 (2016).
[3]K. A. Olive et al. (Particle Data Group), Chin. Phys. C 38(9), 090001 (2014); C. Patrignani et al. (Particle Data Group), Chin. Phys. C 40(10), 100001 (2016).
[4]B. Aubert et al. (BaBar Collaboration), Phys. Rev. Lett. 95, 142001 (2005).
[5]C. Z. Yuan et al. (Belle Collaboration), Phys. Rev. Lett. 99, 182004 (2007).
[6]B. Aubert et al. (BaBar Collaboration), Phys. Rev. Lett. 98, 212001 (2007).
[7]X. L. Wang et al. (Belle Collaboration), Phys. Rev. Lett. 99, 142002 (2007).
[8]J. P. Lees et al. (BaBar Collaboration), Phys. Rev. D 89, 111103 (2014).
[9]X. L. Wang et al. (Belle Collaboration), Phys. Rev. D 91, 112007 (2015).
[10] J. P. Lees et al. (BaBar Collaboration), Phys. Rev. D 86, 051102(R) (2012).
[11] Z. Q. Liu et al. (Belle Collaboration), Phys. Rev. Lett. 110, 252002 (2013).
[12] T. E. Coan et al. (CLEO Collaboration), Phys. Rev. Lett. 96, 162003 (2006).
[13] M. Ablikim et al. (BESIII Collaboration), Phys. Rev. Lett. 114, 092003 (2015).
[14] H. X. Chen, W. Chen, X. Liu, and S. L. Zhu, Phys. Rep. 639, 1 (2016).
[15] T. K. Pedlar et al. (CLEO Collaboration), Phys. Rev. Lett. 107, 041803 (2011).
[16] The data samples are the same as those used in this study except at 4.420 GeV. At 4.420 GeV, more data has been collected and analysed. Besides, the CM energies at all energy points have been remeasured usinge+e− →γ
ISR/FSRµ+µ−events, and
found to be a few MeV smaller.
[17] M. Ablikim et al. (BESIII Collaboration), Phys. Rev. Lett. 111, 242001 (2013).
[18] C. Z. Yuan, Chin. Phys. C 38(4), 043001 (2014).
[19] See supplemental material at [URL will be inserted by pub-lisher] for a summary of number of signal events, luminosity, and Born cross section at each energy point, the definition of the likelihood used in the fit to the dressed cross section, and the correlation matrix of the fit parameters from the fit.
[20] M. Ablikim et al. (BESIII Collaboration), Nucl. Instrum. Meth. A 614, 345 (2010).
[21] M. Ablikim et al. (BESIII Collaboration), Chin. Phys. C 39(9), 093001 (2015).
[22] M. Ablikim et al. (BESIII Collaboration), “Measurement of the integrated luminosities for R scan experiment at BESIII”, paper in preparation.
[23] M. Ablikim et al. (BESIII Collaboration), Chin. Phys. C 40(6), 063001 (2016).
[24] M. Ablikim et al. (BESIII Collaboration), “Measurement of the center-of-mass energies for R scan experiment”, paper in prepa-ration.
[25] S. Agostinelli et al. (GEANT4 Collaboration), Nucl. Instrum. Meth. A 506, 250 (2003).
[26] S. Jadach, B. F. L. Ward and Z. Was, Comp. Phys. Commu. 130, 260 (2000); Phys. Rev. D 63, 113009 (2001).
[27] M. Ablikim et al., (BESIII Collaboration), Phys. Rev. D 86, 092009 (2012).
[28] S. Actis et al., Eur. Phys. J. C 66, 585 (2010).
[29] E. A. Kuraev and V. S. Fadin, Sov. J. Nucl. Phys. 41, 466 (1985) [Yad. Fiz. 41, 733 (1985).]
[30] M. Ablikim et al. (BESIII Collaboration), Phys. Rev. D 87, 012002 (2013).
[31] M. Ablikim et al. (BESIII Collaboration), Phys. Rev. Lett. 110, 252001 (2013).
[32] T. Xiao, S. Dobbs, A. Tomaradze and K. K. Seth, Phys. Lett. B 727, 366 (2013).
[33] M. Ablikim et al. (BESIII Collaboration), Phys. Rev. Lett. 112, 022001 (2014).
[34] K. Zhu, X. H. Mo, C. Z. Yuan and P. Wang, Int. J. Mod. Phys. A 26, 4511 (2011).
[35] M. Ablikim et al. BESIII Collaboration, arXiv:1611.01317[hep-ex].
[36] E. V. Abakumova et al., Nucl. Instrum. Meth. A 659, 21 (2011).
[37] L. Liu et al. (Hadron Spectrum Collaboration), J. High Energy Phys. 07, 126 (2012).
[38] T. Barnes, F. E. Close, and E. S. Swanson, Phys. Rev. D 52, 5242 (1995); P. Guo, A. P. Szczepaniak, G. Galata, A. Vas-sallo and E. Santopinto, Phys. Rev. D 78, 056003 (2008); Yu. S. Kalashnikova and A. V. Nefediev, Phys. Rev. D 77,
8
054025 (2008).
[39] Y. Chen, W. F. Chiu, M. Gong, L. C. Gui, and Z. F. Liu, Chin. Phys. C 40(8), 081002 (2016).
[40] M. Cleven, Q. Wang, F. K. Guo, C. Hanhart, U. G. Meißner, and Q. Zhao, Phys. Rev. D 90, 074039 (2014).
[41] T. W. Chiu and T. H. Hsieh (TWQCD Collaboration), Phys. Rev. D 73, 094510 (2006).