www.ijcer.net
A Longitudinal Study of the Relationship
between Mathematics and Science: The
Case of Texas
Sevket Ceyhun Cetin 1, M. Sencer Corlu 2, Mary M. Capraro3, Robert M. Capraro3
1Texas Tech University 2Bilkent University 3Texas A&M University
To cite this article:
Cetin, S.C., Corlu M.S., Capraro M.M., & Capraro R.M. (2015). A longitudinal study of the
relationship between mathematics and science: the case of Texas. International Journal of
Contemporary Educational Research, 2(1), 13-21.
This article may be used for research, teaching, and private study purposes.
Any substantial or systematic reproduction, redistribution, reselling, loan, sub-licensing,
systematic supply, or distribution in any form to anyone is expressly forbidden.
Authors alone are responsible for the contents of their articles. The journal owns the
copyright of the articles.
The publisher shall not be liable for any loss, actions, claims, proceedings, demand, or
costs or damages whatsoever or howsoever caused arising directly or indirectly in
connection with or arising out of the use of the research material.
International Journal of Contemporary Educational Research
Volume 2, Number 1, 2015 January, Page 13-21
ISSN: 2148-3868
A Longitudinal Study of the Relationship between Mathematics and
Science: The Case of Texas
*Sevket Ceyhun Cetin1†, M. Sencer Corlu2, Mary M. Capraro2, Robert M. Capraro2
1Texas Tech University 2
Bilkent University 3Texas A&M University
Abstract
This study aims to investigate the relationship between mathematics and science scores acquired from the Texas Assessment of Knowledge and Skills (TAKS) examination, and how this relationship changed over the years. The participants were from an independent school district in a northern Texas town. Criterion sampling was used in this study to assure that students who were selected had four TAKS mathematics scores from 2006 through 2010 and two TAKS science scores for 2006 and 2010: 116 students met the criteria. The relationship between two subjectswas investigated by analyzing the correlation between students’ mathematics and science scores of 2006 and 2010. Growth curve models were used to reveal whether there was growth on students’ mathematics and science scores over the years. A strong correlation was found between mean mathematics and mean science scores in the whole sample, and a greater growth was found in mathematics than it did for science.
Key words: Integration, Interdisciplinary, Mathematics, Science
Introduction
Several researchers and organizations have called for reformist changes both in the mathematics and science content covered in U.S. K-12 education (American Association for the Advancement of Science [AAAS], 1993; National Council of Teachers of Mathematics [NCTM], 2000; National Research Council [NRC], 1996, 2001). The rationale behind these calls can be assumed to be affected by the poor international performance of American students in mathematics and science (Schmidt, McKnight, Cogan, Jakwerth, & Houang, 1999) or the ineffective results acquired from efforts such as the No Child Left behind Act (NCLB), International studies such as Trends in International Mathematics and Science Study (TIMSS), and Program for International Student Assessment (PISA) verified the validity of the worries expressed by American education circles.
A large number of studies on mathematics and science achievement were composed of research that focused on student learning in each subject separately. Yet, it was validated by several researchers that student achievement in mathematics and science were positively correlated (Offer & Mireles, 2009). However, a limited number of research studies have investigated the correlation of particular mathematics and science objectives in a comprehensive way (Cosentino, 2008). Therefore, it was aimed to explore the relationship between science and mathematics achievement of students longitudinally and examine how students’ success changed over the course of the years in state-wide standardized tests. The following research questions were addressed in this study,
1) Is there a statistically significant difference in mathematics and science mean scores in terms of gender and ethnicity?
2) Is there a statistically significant relationship between mathematics and science mean scores of African-American and Hispanic students?
3) Are the growths of students’ achievement over time in mathematics and science statistically significant?
*
The preliminary results of this study was presented as a poster at the 35th Psychology of Mathematics Education conference.
†
Relevant Literature
Several researchers (e.g., Berlin, 1992; Czerniak, Weber, Sandman, & Ahern, 1999) concentrated their efforts on investigating the science and mathematics relationships as an integrated subject. Earlier pioneers of mathematics and science integration (MSI) focused on developing curriculum models, which set the foundations of integrated curriculum research. In a meta-analytical study that reviewed the literature on MSI, it was found that the lack of an operational definition of integration and the low number of empirical studies on integrated mathematics and science curricula were two of the most important concerns that need to be addressed (Hurley, 2001).
When researchers started to interpret the notion of curriculum integration differently, the definition of integration of mathematics and science, in particular, emerged as an important topic of debate among researchers. Words used to define mathematics and science relationship included, “… interdisciplinary, multidisciplinary, transdisciplinary, thematic, integrated, connected, nested, sequenced, shared, webbed, threaded, immersed, networked, blended, unified, coordinated, and fused” (Czerniak et al., 1999, p. 422). On the one hand, it was agreed on the use of the terms integration and interdisciplinary to describe the relationship (Berlin & White, 1995). On the other hand, the main objection for curriculum integration was that a superficial combination of mathematics and science might cause “… people to lose important philosophical, methodological, and historical differences between the two subjects” (Berlin, 1992, p. 341). The term ‘integration’ was defined as a mixture of science and mathematics seamlessly. It was simply because there was no clear boundary between mathematics and science, and both subjects are intertwined. However, some researchers noted that the boundaries of each subject should be preserved for interdisciplinary teaching while the main content (either science or mathematics) was explored (Frykholm & Glasson, 2005). Therefore, teachers should be trained to have competence to teach both domains effectively (Barnett & Hodson, 2001).
There has been a sharp increase in the number of research studies on MSI during the last decade. The increase was so dramatic that the number of published articles in the last ten years of the twentieth century was equal to the number of articles during the first ninety years of the twentieth century (Berlin & Lee, 2005). Researchers approached the MSI concept from different perspectives, only a few of which were empirical studies to corroborate an integrated curriculum (Czerniak et al., 1999).
NCTM standards (2000) emphasized the significance of connections between mathematics and other disciplines, especially with science. There were links between mathematics and science in content and process. NCTM (2000) stated, “The processes and content of science can inspire an approach to solving problems that applies to the study of mathematics” (p. 66). Moreover, NRC also reported a similar position in their 1996 report: “The science program should be coordinated with the mathematics program to enhance student use and understanding of mathematics in the study of science and to improve student understanding of mathematics” (p. 214). These two councils supported MSI to create meaningful learning environments.
Some studies have demonstrated that students understand mathematics and science better when the subjects are taught in an integrated way. Several proponents (e.g., George, 1996; Mason, 1996) claimed that MSI helped students form a deeper understanding of the concepts in both subject areas. The holistic learning experience offered by MSI has been shown to increase student motivation (Stinson, Harkness, Meyer, & Stallworth, 2009) and to have a positive effect on students’ critical thinking levels (Czerniak et al., 1999). Czerniak et al.’s tomato soup metaphor, in which the ingredients are inseparable, symbolized the similarly inseparable nature of mathematics and science as an interdisciplinary epistemological method.
In integrated mathematics and science activities, the role of science was said to have provided concrete examples while mathematics creates an opportunity for a deeper understanding of the science concepts (McBride & Silverman, 1991). For example, researchers designed an integrated curriculum of mathematics, science, and technology for seventh and eighth grade students in the U.S. The pilot study results showed that students who were in the integrated program performed statistically better than students who were in a traditional science and mathematics program (Meier, Nicol, & Cobbs, 1998). Besides, among the different instructional methods, multiple representations emerged as the best practice that resulted in a higher conceptual understanding (Park Rogers, Volkmann, & Abell, 2007). In another research study on the implementation of an integrated statistics and science unit, eighth grade students in the experimental group were found to perform better in statistics than students in the control group who learned statistics without a science context (Judson & Sawada, 2000).
Student achievement in MSI curricula needs further research. For example, one of the few empirical studies in the literature with ninth grade students in the U.S. studied the differences between traditional and integrated
14 Cetin, Corlu, Capraro, & Capraro
curriculum outcomes in terms of students’ conceptual understanding of the concepts (Cosentino, 2008). There were no differences between the two student groups in their mathematics achievement, when researchers used multiple choice mathematics tests. However, when the students were tested with another instrument that contained more open-ended mathematics questions, researchers found that students who were taught in an integrated mathematics and science curriculum performed better. The results from the multiple choice science tests showed no statistical significance, but the open-ended version of the same science test showed a significantly higher mean score for MSI students. Curriculum integration has been shown to be a better way to provide instruction than traditional methods by a few empirical studies (Cosentino, 2008; Czerniak et al., 1999).
Method
Data for the longitudinal study came from the Texas Assessment of Knowledge and Skills (TAKS) examination. TAKS was the statewide-standardized multiple-choice test used to assess mathematics, science, reading, writing, and social studies achievement of students in Texas primary and secondary schools. Each test domain is composed of various numbers of multiple-choice questions with five options to select from. Raw scores are calculated by adding the number of questions that a student responded correctly minus one-fourth of the student’s incorrect answers (Texas student assessment program, 2007; 2008). The raw score is generally converted to a scaled score to compare student achievement over the years. A scaled score of 2100 is determined by the Texas Education Agency (TEA) to meet the state standard, whereas a scaled score of 2400 signals an exceptional student performance. Students are not obliged to take every subject test every year; however, the TAKS mathematics test is an exception. TAKS mathematics is mandatory in every grade level starting from grade 3 until the grade 11 exit level. TAKS science, on the other hand, is scheduled to be taken by students in grades 5, 8, and 11.
Participants
The participants were selected from an independent school district (ISD) in a northern Texas town with a population over 100,000 people. The population demographics of the school district in 2011 indicated a relatively diverse composition of ethnicities, with approximately 55% Hispanics, 35% African-American, and 9% White, and 1% others. The sample of the school district was composed of students from grades 3-12 (NT = 2973; 48% female, 52% male; 49%). Criterion sampling technique (Creswell, 2007) was used in this study to assure that students who were selected had four TAKS mathematics scores from 2006 through 2010 and two TAKS science scores for 2006 and 2010. A total of 116 students met the inclusion criteria. The high mobilization rate of students in the school district was one of the reasons that caused to have only 116 students from the school district. The subset of 116 students was followed from 2006 onwards to assess their growth in TAKS mathematics and science achievement and measure the relationship between their 2006 and 2010 mathematics and science scores. Aligned with the low percentage of White students in the district (9% of the student population), only very small number of White students, 3 students, met the inclusion criteria. Thus, White students were excluded from the study. The final sample consisted of 72 Hispanic and 41 African-American students (NTotal = 113).
Instrument
TAKS tests two different sets of objectives, with six objectives at the elementary and middle school level (grades 3-8) and ten objectives for the high school (grades 9-11) level. In both groups, mathematics content is covered by a different set of objectives, which corresponds to different numbers of questions asked in the test. With regard the purpose of the study, only the objectives tested by TAKS for 8th through 11th grade levels for mathematics were given below (see Table 1).
Table 1. TAKS mathematics objectives for grades 8-11
Number of items per grade level
Objectives 8th 9th 10th 11th
1. Functional relationship 5 5 5
2. Properties and attributes of functions 5 5 5
3. Linear functions 5 5 5
5. Quadratic and other nonlinear functions 4 5 5 6. Geometric relationships and spatial reasoning 7 4 5 7
7. 2D and 3D representations 4 5 7
8. Measurement 5 6 7 7
9. Percent, proportions, probability, and tools 8 5 5 5
10. Mathematical processes and tools 10 9 9 9
11. Numbers, operations, and quantitative reasoning 10 12. Patterns, relationships, and algebraic reasoning 10
Total number of items 50 52 56 60
Science subject tests were given at grades 5, 8, and 11. Because of the focus of the present study, only objectives of the grades 8 and 11 were given below (see Table 2).
Table 2. TAKS science objectives for grades 8 and 11
Number of items per grade level
Objectives 8th 11th
1. Nature of science 14 17
2. Life science 3. Physical science 4. Earth science
5. Living systems and the environment 12
6. Structures and properties of matter 6 11
7. Motion, forces, and energy 6 11
8. Earth and space systems 12
9. Organization of living systems 8
10. Interdependence of organisms 8
Total number of items 50 55
Internal reliability estimates as they were computed with Cronbach’s alpha were reported to be in the range of .83-.93 for 2006 TAKS and .87-.90 for 2007 TAKS. Reliability estimates for 2009 and 2010 TAKS were not reported (Texas student assessment program, 2007; 2008).
Data Analysis
The data were analyzed descriptively by using frequency tables to provide a general description of the sample used in this study. Demographic information (age, gender, ethnicity, second-language, special education classification, etc.) was presented through a table (see Table 3). A two-factor (ethnicity [African American, Hispanic]; and gender [male, female]) ANOVA model was estimated to clarify whether the effects of those variables on mathematics and science scores were statistically significantly different or not. Additionally, the relationship between mathematics and science was investigated by analyzing the correlation between students’ mathematics and science scale scores of 2006 and 2010. Lastly, growth curve models were used to reveal whether there was growth on students’ mathematics and science scores over the years.
Results
The descriptive analysis of the data included means and standard deviations of student scale scores in TAKS for each grade level (grades 8-11 in mathematics and grade 8 and 11 in science). It is clear in Table 3 that African American students’ average scores in mathematics and science indicated a slight decrease in each grade level over the four years in high school, while there was an increase in their dispersion. Hispanic student scores in our sample showed a similar trend, with the exception of the increase in grade 11 for exam mathematics scale scores. To answer the first and second research questions, the mean of mathematics scores 2006 through 2010 and science scores 2006 and 2010 were calculated and used in the two-factor ANOVA and all bivariate correlation analysis.
16 Cetin, Corlu, Capraro, & Capraro
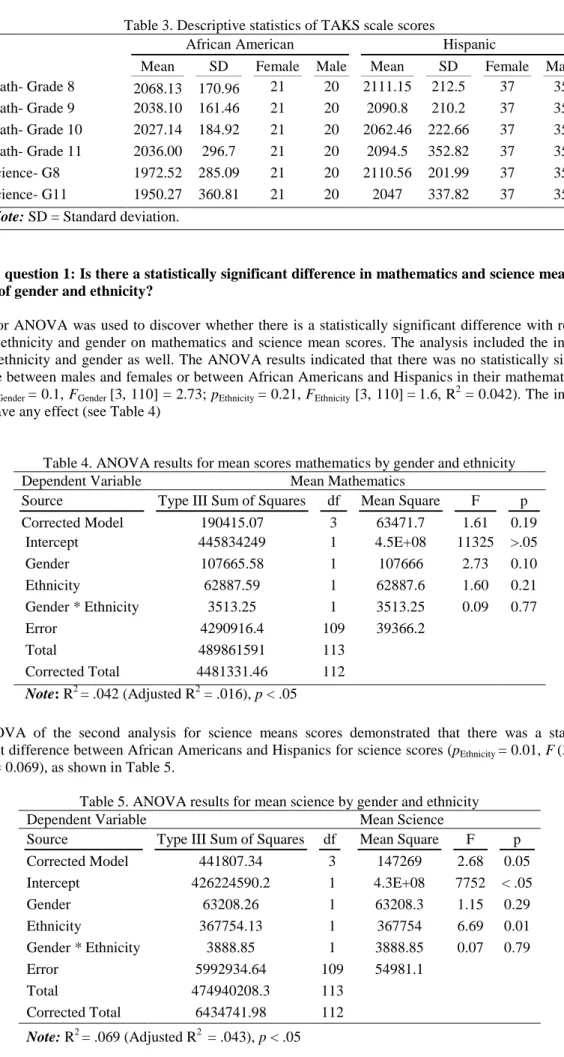
Table 3. Descriptive statistics of TAKS scale scores
African American Hispanic
Mean SD Female Male Mean SD Female Male
Math- Grade 8 2068.13 170.96 21 20 2111.15 212.5 37 35 Math- Grade 9 2038.10 161.46 21 20 2090.8 210.2 37 35 Math- Grade 10 2027.14 184.92 21 20 2062.46 222.66 37 35 Math- Grade 11 2036.00 296.7 21 20 2094.5 352.82 37 35 Science- G8 1972.52 285.09 21 20 2110.56 201.99 37 35 Science- G11 1950.27 360.81 21 20 2047 337.82 37 35
Note: SD = Standard deviation.
Research question 1: Is there a statistically significant difference in mathematics and science mean scores in terms of gender and ethnicity?
Two-factor ANOVA was used to discover whether there is a statistically significant difference with respect to students’ ethnicity and gender on mathematics and science mean scores. The analysis included the interaction effect of ethnicity and gender as well. The ANOVA results indicated that there was no statistically significant difference between males and females or between African Americans and Hispanics in their mathematics mean scores (pGender = 0.1, FGender [3, 110] = 2.73; pEthnicity = 0.21, FEthnicity [3, 110] = 1.6, R2 = 0.042). The interaction did not have any effect (see Table 4)
Table 4. ANOVA results for mean scores mathematics by gender and ethnicity
Dependent Variable Mean Mathematics
Source Type III Sum of Squares df Mean Square F p
Corrected Model 190415.07 3 63471.7 1.61 0.19 Intercept 445834249 1 4.5E+08 11325 >.05 Gender 107665.58 1 107666 2.73 0.10 Ethnicity 62887.59 1 62887.6 1.60 0.21 Gender * Ethnicity 3513.25 1 3513.25 0.09 0.77 Error 4290916.4 109 39366.2 Total 489861591 113 Corrected Total 4481331.46 112 Note: R2 = .042 (Adjusted R2 = .016), p < .05
The ANOVA of the second analysis for science means scores demonstrated that there was a statistically significant difference between African Americans and Hispanics for science scores (pEthnicity = 0.01, F(3, 110) = 6.69, R2 = 0.069), as shown in Table 5.
Table 5. ANOVA results for mean science by gender and ethnicity
Dependent Variable Mean Science
Source Type III Sum of Squares df Mean Square F p
Corrected Model 441807.34 3 147269 2.68 0.05 Intercept 426224590.2 1 4.3E+08 7752 < .05 Gender 63208.26 1 63208.3 1.15 0.29 Ethnicity 367754.13 1 367754 6.69 0.01 Gender * Ethnicity 3888.85 1 3888.85 0.07 0.79 Error 5992934.64 109 54981.1 Total 474940208.3 113 Corrected Total 6434741.98 112 Note: R2 = .069 (Adjusted R2 = .043), p < .05
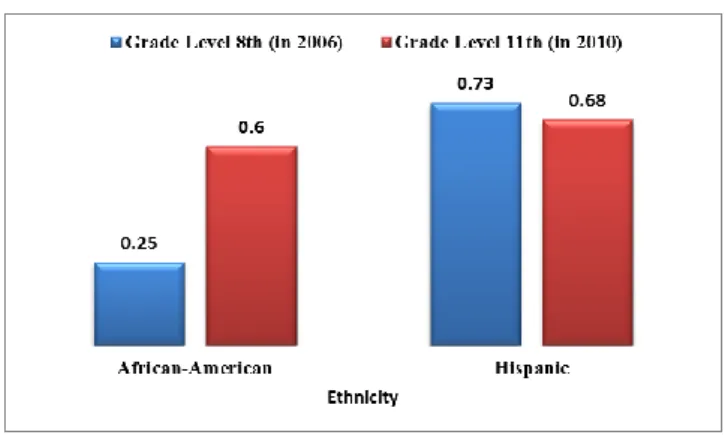
Research question 2: Is there a statistically significant relationship between mathematics and science mean scores of African-American and Hispanic students?
Bivariate statistical analysis was conducted to better understand the relationships between mathematics and science mean scores of students in 2006 and 2010. A correlational analysis investigated science and mathematics mean scores over the high school years. All bivariate correlations of African American and Hispanic grade levels 8 and 11 science and mathematics mean scores were calculated. The analysis indicated a significant and strong correlation (rwhole sample = .72) between mean mathematics and mean science scores in the whole sample. There was also a strong correlation between mean mathematics and mean science scores for African American (r = .68) and Hispanic (r = .73) students. The mathematics and science correlation was found to be stronger at the exit level in grade 11 (r = .60) than it was in grade 8 (r = .25) for African American students. The science and mathematics correlation stayed almost the same for Hispanic students (see Figure 1).
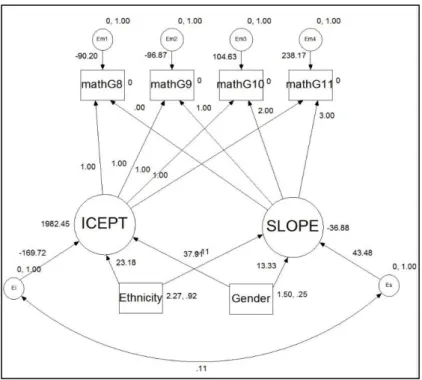
Research Question 3: Are the growths of students’ achievement over time in mathematics and science statistically significant?
To address the third research question, linear and quadratic growth models were drawn. The growth-curve analyses were only performed for mathematics because the science tests were administered only at the exit levels of middle school (8th grade) and high school (11th grade). The data from two years were not sufficient to have a growth model analysis for science. Therefore, growth in science was estimated through the gains between scores in grade 8 and grade 11, and two-way ANOVA results indicated that the growth from the 8th grade to 11th grade was not statistically significant while the effect size was close to zero (R2 = .006), either (see Table 6).
Table 6. Science subject effects
Dependent Variable Slope Science
Source Type III Sum of Squares df Mean Square F p
Corrected Model 5844.541a 3 1948.180 .233 .873 Intercept 12202.205 1 12202.205 1.461 .229 Gender 2541.224 1 2541.224 0.304 .582 Ethnicity 2652.628 1 2652.628 .318 .574 Gender * Ethnicity 1275.465 1 1275.465 .153 .697 Error 910525.074 109 8353.441 Total 933032.360 113 Corrected Total 916369.614 112 Note: p < .05
A major benefit of growth curve modeling is that it provides opportunities to follow the outcome variables over a number of years. The rate of growth (slope), or the effects of gender and ethnicity in our model was not statistically significantly different from zero (p > .05). The slope shows that there is a statistically non-significant decrease of 36 points on the average over the four years of high school (see Figure 2). The fit indices were given as Chi-square = 19.46, df = 10, p = .035, indicating a statistically significant value for lack of fit
18 Cetin, Corlu, Capraro, & Capraro
(Barrett, 2007). Comparative Fit Index (CFI) = 0.96 was particularly a good evaluator of model fit, as the sample size was not large and given that threshold value of CFI for a good model fit should be above .95, however, a maximum value of .06 was exceeded for the Root Mean Square Error of Approximation (RMSEA = .09) (Hu & Bentler, 1999).
When the linear and the quadratic components were considered together in model 2 (see Figure 3), growth model shows that there is a statistically non-significant decrease of 13.8 points and 11.76 points on the average over the four years of high school with respective to linear and quadratic components. This second model fit data better than the first model: Chi square = 2.93, df = 4, p = .57, not providing a statistically significant value (p > .05) for lack of fit, while both CFI = 1.00 and RMSEA < .06 indicated a good fit to data.
Figure 2. Linear growth model for mathematics scores
Figure 3. Quadratic growth model for mathematics scores
Conclusion
Results indicate a strong relationship between students’ mathematics and science achievement over the high school years. The findings of this longitudinal study confirm previous research, which proposed a high correlation between mathematics and science (Offer & Mireles, 2009). Even though the study shows a weak decrease in students’ mathematics and science scale means scores for African American and Hispanic students during the first three years, their mathematics and science scale mean scores increased in grade 11. So, there is still a strong and significant correlation between science and mathematics scale means scores in 2006 and 2010. This situation might have occurred because of the reciprocal relationships between the two domains. Since mathematics is defined as “an intrinsic component of science, part of its fabric, its universal language, and indispensable source of intellectual tools” (Wright & Chorin, 1999, p. 3). On the other hand, science is the field that inspires mathematics by posing new questions and provides implications for mathematics by providing contexts and real-life connections. The importance of science for mathematics was also noted in the following quote,
The opportunity for students to experience mathematics in a context is important. Mathematics is used in science, the social sciences, medicine, and commerce. The link between mathematics and science is not only through content but also through process. The processes and content of science can inspire an approach to solving problems that applies to the study of mathematics. (National Council of Teachers of Mathematics, 2000, p. 66)
As Czerniak et al. (1999) had said, mathematics and science are like the essential ingredients of a tomato soup and only meaningful together. This longitudinal study found evidence that the inseparable nature of the subjects also reflected on student achievement. It can be speculated that high correlation makes the two domains understandable, and students learn better. Otherwise, if students have lack of mathematics knowledge it affects science achievement of students and vice versa. Therefore, considering the strong correlation can be an effective way to cope with students’ difficulties with learning mathematics and science because it helps students to have a deeper understanding of content in two domains (McBride & Silverman, 1991).
There is no effect of gender or ethnicity on students’ mathematics achievement, but their science achievement does have an effect. Low effect sizes and correlations show that African American and Hispanic males and females do not differ on their mathematics scale mean scores, whereas several studies have found that gender differences exist on students’ mathematics achievement (Hyde, Fennema, & Lamon, 1990). However, African American and Hispanic students have statistical differences on their science scale mean scores. External effects may have occurred in the statistical differences. It might be considered due to being English Language Learner (ELL) such as Hispanic students in this case. Science performance of students is affected by science content knowledge and vocabulary, the use of cognitive strategies, and cultural backgrounds of students (Akatugba & Wallace, 1999; Lee & Fradd, 1998; Lee, Fradd, & Sutman, 1995). The ELL learners bring into classrooms their home culture and language that may be used frameworks for constructing novel knowledge in science. However, the some experiences of students are discontinues with science disciplines. Thus, ELL students have lack of science knowledge and vocabulary in English (Westby & Velasquez, 2000) that influence their science achievement. Another challenge was reported that science teachers are not competent to teach science to ELL learners (Yates & Ortiz, 1998).
In conclusion, although the study has a limitation in that science TAKS are not taken each year, the present study shows that science and mathematics have a strong and significant relationship. In the light of the strong correlation, educators should place more integration of mathematics and science in K-12 educational settings to support teaching mathematics and science (Corlu & Corlu, 2012). Recommendations for future research include experimental study and qualitative methods to examine students’ mathematics and science learning and their effects to each other more deeply.
References
Akatugba, A. H., & Wallace, J. (1999). Sociocultural influences on physics students’ use of proportional reasoning in a non-western country. Journal of Research in Science Teaching, 3, 305-320.
American Association for the Advancement of Science. (1993). Benchmarks for science literacy. New York, NY: Oxford University Press.
20 Cetin, Corlu, Capraro, & Capraro
Barnett, J., & Hodson, D. (2001). Pedagogical context knowledge: Toward a fuller understanding of what good science teachers know. Science Education, 85, 426-453.
Barrett, P. (2007). Structural equation modelling: Adjudging model fit. Personality and Individual
differences, 42(5), 815-824.
Berlin, D. F. (1992). A network for integrated science and mathematics teaching and learning. School and Science Mathematics, 92, 340-342.
Berlin D. F., & Lee, H. (2005). Integrating science and mathematics: Historical analysis. School Science and Mathematics, 105(1), 15-24.
Berlin, D. F., & White, A. L. (1995). Connecting school science and mathematics. In P. A. House, & A. F. Coxford (Eds.), Connecting mathematics across the curriculum: 1995 yearbook of the National Council of Teachers of Mathematics (pp. 22-33). Reston, VA: National Council of Teachers of Mathematics.
Corlu, M. A., & Corlu, M. S. (2012). Scientific inquiry based professional development models in teacher education. Educational Sciences: Theory & Practice, 12(1), 514–521.
Cosentino, C. (2008). The impact of integrated programming on student attitude and achievement in grade 9 academic mathematics and science (Master’s thesis, Brock University, Ontario, Canada). Retrieved from http://dr.library.brocku.ca/handle/10464/2829
Creswell, J. W. (2007). Qualitative inquiry and research design: Choosing among five approaches (2nd ed.). Thousand Oaks, CA: Sage.
Czerniak, M. C., Weber, B. W., Sandman, A., Jr., & Ahern, J. (1999). A literature review of science and mathematics integration. School Science and Mathematics, 99, 421-430.
Frykholm, J., & Glasson, G. (2005). Connecting science and mathematics instruction: Pedagogical context knowledge for teachers. School Science and Mathematics, 105, 127-141.
George, P. S. (1996). The integrated curriculum: A reality check. Middle School Journal, 28, 12-19.
Hu, L., & Bentler, P. M. (1999). Cutoff criteria for fit indexes in covariance structure analysis: Conventional criteria versus new alternatives. Structural Equation Modeling, 6, 1-55.
Hurley, M. M. (2001). Reviewing integrated science and mathematics: The search for evidence and definitions from new perspectives. School Science and Mathematics, 101, 259-268.
Hyde, J. S., Fennema, E., & Lamon, S. J. (1990). Gender differences in mathematics performance: A meta-analysis. Psychological Bulletin, 107(2), 139.
Judson, E., & Sawada, D. (2000). Examining the effects of a reformed junior high school science class on students’ mathematics achievement. School Science and Mathematics, 100, 419-425.
Lee, O., & Fradd, S. H. (1998). Science for all: Including students from non-English language backgrounds. Educational Researcher, 27, 12-21.
Lee, O., Fradd, S. H., & Sutman, F. X. (1995). Science knowledge and cognitive strategy use among culturally and linguistically diverse students. Journal of Research in Science Teaching, 32, 797-816.
Mason, T. C. (1996). Integrated curricula: Potential and problems. Journal of Teacher Education. 47, 263-270. McBride, J. W., & Silverman, F. L. (1991). Integrating elementary/middle school science and mathematics.
School Science and Mathematics, 91, 285-292.
Meier, S. L., Nicol, M., & Cobbs, G. (1998). Potential benefits and barriers to integration. School Science and Mathematics, 98, 438-447.
National Council of Teachers of Mathematics. (2000). Principles and standards for school mathematics. Reston, VA: Author.
National Research Council. (1996). National science education standards. Washington, DC: National Academy Press.
National Research Council. (2001). National science education standards. Washington, DC: National Academy Press.
Offer, J., & Mireles, S. V. (2009). Mix it up: Teachers’ beliefs on mixing mathematics and science. School Science and Mathematics, 10, 146-152.
Park Rogers, M. A., Volkmann, M. J., & Abell, S. K. (2007). Perspectives: Science and mathematics: A natural connection. Science and Children, 45(2), 60-61.
Schmidt, W. H., McKnight, C. C., Cogan L. S., Jakwerth, P. M., & Houang, R. T. (1999). Facing the consequences: Using TIMSS for a closer look at U.S. mathematics and science education. Dordrecht, Netherlands: Kluwer Academic Publishers.
Stinson, K., Harkness, S. S., Meyer, H., & Stallworth, J. (2009). Mathematics and science integration models and characterizations. School Science and Mathematics, 109, 153-161.
Texas student assessment program (Technical digest for the academic year 2006-2007). (2007). Retrieved from Texas Education Agency: http://www.tea.state.tx.us/
Texas student assessment program (Technical digest for the academic year 2007-2008). (2008). Retrieved from Texas Education Agency: http://www.tea.state.tx.us/
Westby, C. E., & Velasquez, D. (2000). Developing scientific literacy: A sociocultural approach. Remedial and Special Education, 21, 101-110.
Wright, M., & Chorin, A. (1999). Mathematics and science. Arlington, VA: National Science Foundation. Yates, J. R., & Ortiz, A. A. (1998). Developing individualized education programs for exceptional language
minority students. In L. M. Baca & H. T. Cervantes (Eds.), The bilingual special education interface (3rd ed., pp. 188-212). Upper Saddle River, NJ: Merrill.