IDENTIFICATION OF
PUTATIVE PROTEIN KINASE INHIBITORS
ACTING ON LIVER CANCER CELLS
A THESIS SUBMITTED TO
THE DEPARTMENT OF MOLECULAR BIOLOGY AND GENETICS AND THE GRADUATE SCHOOL OF ENGINEERING AND SCIENCE
OF BILKENT UNIVERSITY
IN PARTIAL FULFILLMENT OF THE REQUIREMENTS FOR THE DEGREE OF DOCTOR OF PHILOSOPHY
BY
EBRU BİLGET GÜVEN AUGUST 2012
ii
I certify that I have read this thesis and that in my opinion it is fully adequate, in scope and in quality, as a thesis for the degree of Doctor of Philosophy.
Assoc. Prof. Dr. Rengül Çetin-Atalay I certify that I have read this thesis and that in my opinion it is fully adequate, in scope and in quality, as a thesis for the degree of Doctor of Philosophy.
Prof. Dr. Mehmet Öztürk I certify that I have read this thesis and that in my opinion it is fully adequate, in scope and in quality, as a thesis for the degree of Doctor of Philosophy.
Prof. Dr. Birsen Tozkoparan I certify that I have read this thesis and that in my opinion it is fully adequate, in scope and in quality, as a thesis for the degree of Doctor of Philosophy.
Prof. Dr. Meral Tunçbilek I certify that I have read this thesis and that in my opinion it is fully adequate, in scope and in quality, as a thesis for the degree of Doctor of Philosophy.
Assist. Prof. Dr. Kamil Can Akçalı
Approved for the Graduate School of Engineering and Science
Director of Graduate School of Engineering and Science Prof. Dr. Levent Onural
iii
ABSTRACT
IDENTIFICATION OF
PUTATIVE PROTEIN KINASE INHIBITORS
ACTING ON LIVER CANCER CELLS
Ebru Bilget Güven
PhD. in Molecular Biology and Genetics Supervisor: Assoc. Prof. Dr. Rengül Çetin-Atalay
August 2012, 204 Pages
Hepatocellular carcinoma (HCC) as a, heterogeneous, multi-step, slow-progressing disease, has very limited treatment options due to its chemoresistant nature and late diagnosis. According to World Health Organization (WHO) reports HCC is a major public health problem. Each year, 748,000 new cases appear and 696,000 people lose their lives, all due to liver cancer alone. Sorafenib, the multi-tyrosine kinase inhibitor, is still the only (Food and Drug Administration) FDA-approved drug available for treatment. Therefore, there is an urgent need for novel, target-specific drugs based on the underlying molecular mechanisms of liver carcinogenesis.
In this Ph.D. dissertation, synthetic purine, purine nucleoside analogs, aminotriazole and thiadiazine derivatives were evaluated for their cytotoxic activities and mechanisms of action against liver cancer. These novel molecules were selected because of their potential kinase inhibitory activity. Protein kinases, involved in signaling pathways, are the main enzymes of target-specific drug discovery; therefore, discovery of novel, putative protein kinase inhibitors as drug candidates can be promising for the treatment of primary liver cancer.
Initially, sulforhodamine B (SRB) assay was used to screen the novel small-molecules for their cytotoxic activities against breast, colon and liver cancer cell lines. Active molecules, then, were further exploited on a panel of HCC cell lines. The differential IC50 (half-maximal inhibitory concentration) values obtained, might indicate that these small-molecules interfere with cell signaling; since, these
iv
cell lines have individual characteristics of cell signaling activities. Further investigations are envisaged for the identification of the molecular mechanisms that these putative kinase inhibitors are involved in.
Among the 228 newly synthesized putative kinase inhibitors, 3 small-molecules were identified as promising anti-cancer agents against liver cancer with druggable cytotoxic activities and remarkable kinase inhibition potentials. The purine analogue, AUM32, and the purine nucleoside analogue, AUM42, were revealed as pro-senescence therapeutic agents in liver cancer. Both drug candidates were shown to initiate senescence-induced cell death and the underlying mechanism was confirmed for AUM42 as the induction of p15(INK4b) and the correlated decrease in Rb phosphorylation.
Synthetic 1,2,4-triazolo[3,4-b]-1,3,4-thiadiazine derivative, ClAT-TM, is the other effective small-molecule with kinase inhibition potential. Upon ClAT-TM treatment, liver cancer cells experience a growth inhibition accompanying with dramatic morphological changes. Rounded, swollen and eventually detached cells were shown to be arrested in the G2/M stage of the cell cycle and eventually undergo apoptosis. Moreover, ROS (reactive oxygen species) accumulation and the activation of JNK signaling pathway were found as associated with the mechanism of action ClAT-TM cytotoxicity.
v
ÖZET
POTANSİYEL PROTEİN KİNAZ İNHİBİTÖRLERİNİN
KARACİĞER KANSERİNE KARŞI
İLAÇ ADAYI OLARAK TANIMLANMASI
Ebru Bilget GüvenMoleküler Biyoloji ve Genetik Doktorası Tez Yöneticisi: Doç. Dr. Rengül Çetin-Atalay
Ağustos 2012, 204 Sayfa
Hepatosellüler karsinom (HSK), heterojen, çok aşamalı, yavaş gelişen bir hastalık olup, kemoterapiye dirençli yapısı ve sıklıkla geç teşhis edilmesi nedeniyle tedavi seçenekleri sınırlıdır. Dünya Sağlık Örgütü’nün raporlarına göre HSK önemli bir toplum sağlığı sorunudur. Her yıl, dünya genelinde 748,000 yeni kanser vakası ve 696,000 ölüm sadece karaciğer kanserine bağlı olarak gelişmektedir. Çoklu-tirozin kinaz inhibitörü olan Sorafenib, ileri seviyede HSK için hala FDA onayı olan tek ilaçtır. Bu nedenlerle, karaciğer kanser gelişiminin altında yatan moleküler mekanizmaları hedef alan, yeni ilaç adaylarının tespit edilmesine acil olarak gereksinim vardır.
Bu doktora tez çalışmasında, sentetik pürin ve pürin nükleozid analogları ile aminomerkaptotriazol ve triazolotiyadiazin türevleri, karaciğer kanseri üzerindeki sitotoksik etkileri ve hareket mekanizmaları açısından değerlendirilmiştir. Bu yeni moleküller, potansiyel kinaz inhibisyon aktiviteleri nedeniyle seçilmişlerdir. Hücre sinyal yolaklarında yer alan protein kinazlar, hedef-odaklı ilaç keşfinde temel enzimler olup, yeni keşfedilecek potansiyel kinaz inhibitörleri, HSK tedavisinde umut veren ilaç adaylarıdır.
Öncelikle, yeni sentezlenen küçük-moleküllerin sitotoksik etkileri, sülforadamin B (SRB) yöntemi kullanılarak meme, kolon ve karaciğer kanseri hücrelerinde incelenmiştir. Aktif olduğu tespit edilen moleküller, daha sonra HSK hücre hatlarına karşı değerlendirilmiştir. Farklı kanser hücre hatlarında, farklı IC50 değerlerine ulaşılması ve kanser hücrelerinde sinyalizasyonun hücre hattına
vi
özgü, ayırt edici özelikler taşıdığının bilinmesi, bu küçük-moleküllerin sinyal yolaklarına müdahale ettiklerini düşündürmüştür. Potansiyel protein kinaz inhibitörlerinin moleküler mekanizmalarını tanımlayacak ileri analizler öngörülmüştür.
Bu doktora tez çalışması kapsamında, yeni sentezlenen 228 adet potansiyel protein kinaz inhibitöründen 3 küçük-molekül, düşük dozlarda gösterdikleri sitotoksik etki ve dikkate değer kinaz inhibisyon potansiyelleri ile kuvvetli ilaç adayları olarak saptanmıştır. Nükleozid analoglarından AUM32 ve AUM42, karaciğer kanserinde erken-yaşlanmaya yol açan terapötik ajan olarak gösterilmişlerdir. Her iki ilaç adayının da yaşlanmanın tetiklediği hücre ölümüne yol açtığı, hatta AUM42 molekülünün, p15(INK4b) artışına bağlı olarak düşen fosforile-Rb üzerinden etki ettiği ortaya konmuştur
Sentetik 1,2,4-triazol[3,4-b]-1,3,4-tiyadiazin türevi, ClAT-TM, bir diğer etkin, potansiyel protein kinaz inhibitörüdür. Karaciğer kanser hücreleri, ClAT-TM varlığında, yapısal bozulmaların yanında büyümede de gerileme göstermiştir. Yuvarlaklaşarak şişen ve nihayetinde kültür ortamından kopan hücreler, apoptoza girmeden önce hücre döngüsünün G2/M aşamasında tutulma yaşamaktadırlar. Üstelik ROS (reaktif oksijen türleri) birikmesi ve JNK sinyal yolağının aktif hale geçmesi, ClAT-TM molekülünün etki mekanizmasıyla ilişkilendirilmiştir.
vii
viii
ACKNOWLEDGEMENTS
Completing PhD is not an easy task without the support of people in your life. I feel as one of the few lucky ones who have met with the right people and been supported strongly.
First of all, my special gratitude to my supervisor Assoc. Prof. Dr. Rengül Çetin-Atalay not only for guiding me in all aspects of this PhD dissertation closely and constructively, but also for supporting me in all circumstances.
I also would like to thank to Prof. Dr. Mehmet Öztürk, for believing in and encouraging me to start.
I am grateful to each and every PI of the MBG faculty, Prof. Dr. Tayfun Özçelik, Assoc. Prof. Dr. Işık Yuluğ, Assoc. Prof. Dr. İhsan Gürsel, Assist. Prof. Dr. Kamil Can Akçalı, Assist. Prof. Dr. Uygar Tazebay, Assist. Prof. Dr. Özlen Konu, Assist. Prof. Dr. Ali Osman Güre, Assist. Prof. Dr. Ebru Erbay, for all their contributions.
I would like to thank to RCA group members, Tulin Erşahin, İrem Durmaz and Deniz Cansen Yıldırım, for their co-operation, friendship and personality.
I also would like to thank to all the grad students of MBG faculty for their individual practical and positive supports.
I emphasize my special thanks to Bilge Kılıç, Füsun Elvan, Sevim Baran, Emre Buğdaycı, Turan Daştandır, and Abdullah Ünnü, for their continuous efforts. I am thankful to Prof. Dr. Birsen Tozkoparan and Prof. Dr. Meral Tunçbilek for providing the molecules I have researched during my PhD studies.
Finally, I am deeply appreciated to my family, significantly to my daughter, Kayra, and dedicate this thesis to her.
This work was supported by grants from TUBITAK (109T987), TUBITAK (112S030), and the KANİLTEK project from State Planning Office. The MRIs were taken at UMRAM, Bilkent University, with the help of Prof. Dr. Ergin Atalar.
ix TABLE OF CONTENT SIGNATURE PAGE ii ABSTRACT iii ÖZET v ACKNOWLEDGEMENTS viii TABLE OF CONTENTS ix
LIST OF FIGURES xiv
LIST OF TABLES xviii
ABBREVIATIONS xx CHAPTER 1. INTRODUCTION 1 1.1 Protein phosphorylation 1 1.1.1 Protein kinases 2
1.1.2 Protein kinase inhibitors 5
1.1.3 Protein kinase drug discovery 7
1.2 Cell death 9
1.2.1 Senescence 13
1.2.1.1 Replicative senescence 14
1.2.1.2 Oncogene-induced senescence 14
1.2.1.3 DNA damage-induced senescence 15
1.2.1.4 ROS-induced cellular senescence 15
1.2.1.5 PTEN loss-induced cellular senescence 17
1.2.1.6 Drug-induced cellular senescence 18
1.2.1.7 Senescence pathways 19
1.2.1.8 The cell cycle and its regulation 20
1.2.1.9 Cyclin-dependent kinases (CDKs) 21
1.2.1.10 Cyclin-dependent kinase inhibitors (CKIs) 22
1.3 Hepatocellular carcinoma (HCC) 22
1.3.1 Hepatocarcinogenesis 23
x 1.3.2.1 EGF/EGFR pathway 24 1.3.2.2 Ras/Raf/MEK/ERK pathway 25 1.3.2.3 PI3K/PTEN/Akt/mTOR pathway 25 1.3.2.4 IGF/IGFR pathway 26 1.3.2.5 TGF- β pathway 26 1.3.2.6 Wnt/β-catenin pathway 27
1.4 c-Jun-N-terminal kinases and liver 28
1.4.1 JNK pathway 28
1.4.2 ROS mediates crosstalk between JNK and NF-Κb 30 1.5 Targeted therapy of hepatocellular carcinoma 30
CHAPTER 2. MATERIALS AND METHODS 35
2.1 REAGENTS 35
2.1.1 Cell lines 35
2.1.2 Cell culture reagents 35
2.1.3 Drug screening reagents 36
2.1.4 Nuclear staining reagents 36
2.1.5 Cell lysis reagents 36
2.1.6 Kinase assay reagents 36
2.1.7 Western-blot reagents 37
2.1.8 Antibodies 37
2.1.9 Senescence Associated-β-gal (SA-β-gal) assay and BrdU proliferation co-staining reagents
38
2.1.10 Cell Cycle Analysis with Fluorescence-Activated Cell Sorting (FACS) – Propidium Iodide (PI) reagents
39
2.1.11 ER Endoplasmic Reticulum) stress detection reagents 39 2.1.12 Reactive Oxygen Species (ROS) detection assay reagents 40 2.1.13 in vivo drug treatment assay reagents 40
2.2 MATERIALS 40
2.3 SOLUTIONS 41
2.3.1 Cell culture solutions 41
2.3.2 Drug screening solutions 41
xi
2.3.4 Cell lysis solutions 42
2.3.5 Kinase assay solutions 42
2.3.6 Western blot solutions 42
2.3.7 Senescence Associated-β-gal (SA-β-gal) assay and BrdU proliferation co-staining solutions
42
2.3.8 ER (Endoplasmic Reticulum) stress detection solutions 43 2.3.9 Reactive Oxygen Species (ROS) detection assay solutions 43 2.3.10 Cell Cycle Analysis with Fluorescence-Activated Cell Sorting
(FACS) – PI assay solutions
43
2.3.11 in vivo drug treatment assay solutions 43
2.4 METHODS 43
2.4.1 Cell culture protocols 43
2.4.1.1 Maintenance of cell lines 43
2.4.1.2 Freezing of cell lines 44
2.4.1.3 Thawing of cell lines 44
2.4.2 Drug Screening Protocols 45
2.4.2.1 NCI-60 Sulphorhodamine B (SRB) assay 45 2.4.2.2 Real-Time Cell Electronic Sensing (RT-CES) method for
cytotoxicity profiling (xCELLigence)
45
2.4.3 Nuclear staining with Hoechst 33258 protocol 46 2.4.4 Cell lysis protocol and Bradford assay 46
2.4.5 Kinase assay 48
2.4.6 Western blotting 48
2.4.7 Senescence Associated-β-gal (SAβ-gal) assay and BrdU proliferation co-staining
49
2.4.8 Cell Cycle Analysis with Fluorescence-Activated Cell Sorting (FACS) – PI assay
50
2.4.9 ER (Endoplacmic Reticulum) stress detection assay 51 2.4.10 Reactive Oxygen Species (ROS) detection assay 51
2.4.11 in vivo drug treatment assay 52
xii
CHAPTER 4. RESULTS 56
PART 1
564.1 Nucleobase and nucleoside analogues 56
Part 1a 57
4.1.1 Anti-cancer drug screening of novel, substituted purine analogues
57
4.1.2 AUM18, AUM23, and AUM32 trigger nuclear condensation and DNA fragmentation but do not induce apoptosis
63
4.1.3 Kinase inhibitory potential of AUM18, AUM23 and AUM32 64 4.1.4 Time dependent cytotoxicity and the real time cell growth
analysisin the presence of AUM32
67
4.1.5 The novel, purine analogue AUM32 induces cellular senescence 69
Part 1b 73
4.1.6 Anti-cancer drug screening of novel purine ribonucleoside analogues
73
4.1.7 Real-time cellular response of liver cancer cells in the presence of AUM42
76
4.1.8 Kinase inhibitory potential of AUM42 76
4.1.9 The cytotoxic activity of AUM42 is neither apoptosis nor necrosis but it induces cellular senescence
78
Part 1c 83
4.1.10 Anti-cancer drug screening of novel, substituted purine and purine nucleoside analogues
83
4.1.11 Kinase inhibitory potential of AUM52, AUM53, AUM54, AUM56 and AUM57
86
PART 2
874.2 Novel aminotriazole and thiadiazine derivatives 87 4.2.1 Anti-cancer drug screening of novel
4-amino-3-substituted-1,2,4-triazole-5-thiones and 3,6-disubstituted-1,2,4-triazolo[3,4-b]-1,3,4-thiadiazines
87
4.2.2 Kinase inhibitory potential of ClAT-TM 90 4.2.3 Real-time cell growth analysis in the presence of ClAT-TM 92 4.2.4 ClAT-TM induces G2/M cell-cycle arrest 94
xiii
4.2.5 ClAT-TM induces apoptosis 104
4.2.6 Not the endoplasmic reticulum (ER), but the oxidative stress is the underlying mechanism of ClAT-TM induced cell death
105
4.2.7 ClAT-TM induces the phosphorylation of c-Jun N-terminal kinase
107
4.2.8 The upstream components of JNK signaling pathway in the presence of ClAT-TM
108
4.2.9 KINOMEscanTM Profiling of ClAT-TM 110 4.2.10 in vivo anti-tumor activity of ClAT-TM in Mahlavu xenografts 111
CHAPTER 5. DISCUSSION 114
CHAPTER 6. FUTURE PERSPECTIVES 122
SUPPLEMENTARY 124
xiv
LIST OF FIGURES
Figure 1.1: The transfer of -phosphate of ATP to the hydroxyl group
of an amino acid residue 2
Figure 1.2: The human kinome tree 3
Figure 1.3: Structure of the conserved protein kinase core 4
Figure 1.4: The binding modes of protein kinase inhibitors 6
Figure 1.5: Non-oncogenic and oncogenic drug resistance 8
Figure 1.6: Morphological features of cells confronting apoptotic and
non-apoptotic cell deaths 9
Figure 1.7: ROS (reactive oxygen species) generation 16
Figure 1.8: Mitochondrial ROS levels and the cell’s fate 17
Figure 1.9: Senescence pathways 20
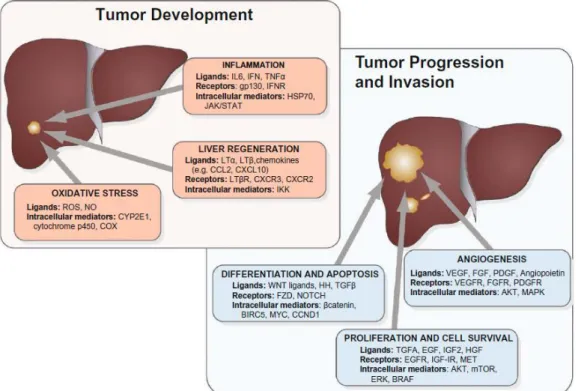
Figure 1.10: Dysregulated signaling pathways in HCC 24
Figure 1.11: c-Jun-N-terminal kinases (JNKs) 28
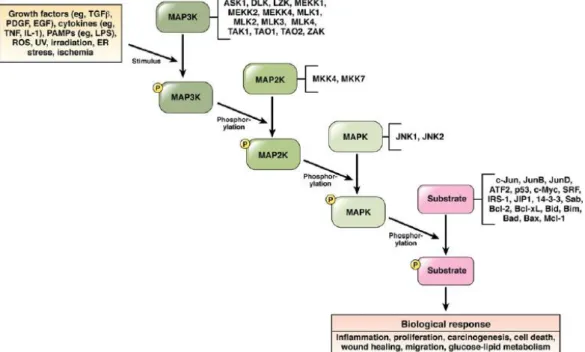
Figure 1.12: JNK signaling pathway 29
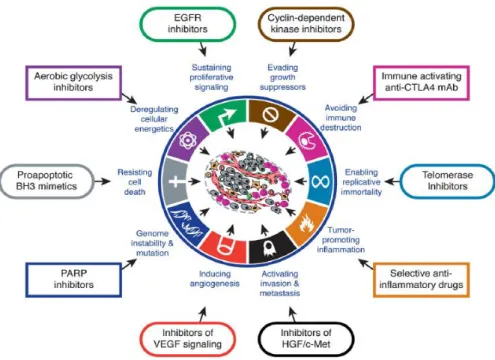
Figure 1.13: Therapeutic targets for drug candidates 32
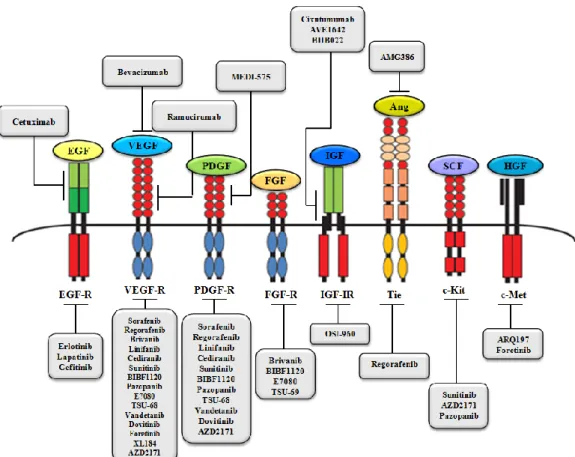
Figure 1.14: The molecular targeted agents currently tested in preclinical and clinical HCC trials 33
Figure 1.15: PI3K/PTEN/Akt/mTOR and Ras/Raf/MEK/ERK
signaling pathways and the molecular targeted agents involved
34
Figure 4.1: Percent cytotoxicity in the presence of AUM18 (A), AUM23 (B) and AUM32 (C) purine analogues 62 Figure 4.2: Hoechst 33258 nuclear staining of purine analogues
treated FOCUS (A) and Huh7 (B) cells 64 Figure 4.3: (A) Bcl-2 and Cyt-c protein expression levels of FOCUS
cells treated with purine analogues . PARP cleavage analysis via western blot for AUM18, AUM23, and AUM32 treated Mahlavu cells (B) and only AUM32 treated Huh7, HepG2, FOCUS and Mahlavu cells (C).
65
Figure 4.4: Schematic kinase assay principle 66
Figure 4.5: Kinase inhibitory potential of AUM18, AUM23 and
xv
Figure 4.6: Time- and dose- dependent percent cytotoxicity in the
presence of AUM32 70
Figure 4.7: Monitored real-time cell growth of Huh7, HepG2 and Mahlavu cells in the presence of AUM32 71 Figure 4.8: SA-β-gal and BrdU incorporation assays in the presence
of AUM32 72
Figure 4.9: Monitored real-time cell growth of Huh7, HepG2, Mahlavu and FOCUS cells in the presence of AUM42 77
Figure 4.10: Kinase inhibitory potential of AUM42 78
Figure 4.11: PARP cleavage analysis via western blot 79
Figure 4.12: SA-β-gal and BrdU incorporation assays in the presence
of AUM42 81
Figure 4.13: Senescence-associated proteins p15(INK4b) and Rb in
the presence of AUM42 82
Figure 4.14: p21 and phospho-H2AX (P*-H2AX) expression levels in
the presence of AUM42 83
Figure 4.15: Kinase inhibitory potntial of AUM52, AUM53, AUM54,
AUM56 and AUM57 86
Figure 4.16: The time- and dose- dependent cytotoxicity of ClAT-TM on Huh7, HepG2, Mahlavu, FOCUS, Snu475 and Snu387 89 Figure 4.17: Kinase inhibitory potential of ClAT-TM against HCC cell
lines 91
Figure 4.18: Dynamic monitoring of ClAT-TM treated liver cancer
cells 94
Figure 4.19: Cell-cycle analysis of ClAT-TM treated HCC cells 101
Figure 4.20: Morphological effect of ClAT-TM on liver cancer cell
lines 103
Figure 4.21: Western blot analysis of ClAT-TM treated HCC cells for
cleaved PARP 104
Figure 4.22: Endoplasmic reticulum (ER) stress detection assay with
ClAT-TM treated Huh7 cells 105
xvi
Figure 4.24: Effect of ClAT-TM on the expression and activation of
c-Jun N-terminal kinase 107
Figure 4.25: The phosphorylated-c-Jun protein levels upon ClAT-TM
treatment 108
Figure 4.26: The protein levels of phosphorylated-MKK7,
phosphorylated MKK4and phosphorylated-ASK1(S83)
upon ClAT-TM treatment 109
Figure 4.27: The phosphorylated-Akt (P-Akt) (Ser473) protein levels
upon ClAT-TM treatment 110
Figure 4.28: TREEspotTM Kinase Interaction Mapping for ClAT-TM 112
Figure 4.29: in vivo anti-tumor activity of ClAT-TM in Mahlavu
xenografts 113
Figure 5.1: Novel purine ribonucleoside analogue, AUM42, leads to senescence-induced cell death in liver cancer cells 117
Figure 5.2: The molecular mechanism that ClAT-TM is involved in 121
Supplementary
Figure 1:
Percent cytotoxicity in the presence of novel substituted purin analogues
143
Supplementary Figure 2:
Time- and dose- dependent percent cytotoxicity in the presence of novel purine ribonucleoside analogues
149
Supplementary Figure 3:
Percent cytotoxicity in the presence of novel 6-(substituted piperazine)-9-6-(substituted phenyl) sulfonyl purine analogues given in Supplementary Table 2
155
Supplementary Figure 4:
Percent cytotoxicity in the presence of novel 6-(substituted piperazine)-9-6-(substituted benzyl) purine analogues given in Supplementary Table 3
161
Supplementary Figure 5:
Percent cytotoxicity in the presence of novel 6-(4-substituted phenyl)-9-(4-6-(4-substituted phenyl) sulfonyl purine analogues given in Supplementary Table 4 and 2-amino/2-chloro/6 e)/6-(4-substituted phenyl amino)/6-(2-substituted ethylamino)-9-(β-D-ribofuranosyl) purine analogues given in Supplementary Table 5
164
Supplementary Figure 6:
Percent cytotoxicity of the further analyzed novel 6-(substituted piperazine)-9-6-(substituted phenyl) sulfonyl purine analogues given in Supplementary Table 6
xvii Supplementary
Figure 7:
Percent cytotoxicity of the further analyzed novel 6-(substituted piperazine)-9-6-(substituted benzyl) purine analogues given in Supplementary Table 7
176
Supplementary Figure 8:
Percent cytotoxicity of the further analyzed novel 6-(4-substituted phenyl)-9-(4-6-(4-substituted phenyl) sulfonyl AND 2-amino/2-chloro/6-(4-substituted piperazine)/6-(4-substituted phenyl amino)/6-(2-piperazine)/6-(4-substituted ethylamino)-9-(β-D-ribofuranosyl) purine analogues given in Supplementary Table 8
179
Supplementary Figure 9:
Percent cytotoxicity in the presence of HUBT coded novel aminotriazole and thiadiazine derivatives
182
Supplementary Figure 10:
Percent cytotoxicity in the presence of novel 1,2,4 triazolo[3,4-b]-1,3,4-thiadiazine derivatives (72 hour)
185
Supplementary Figure 11:
Percent cytotoxicity in the presence of novel 1,2,4 triazolo[3,4-b]-1,3,4-thiadiazine derivatives (24 hour and 48 hour)
xviii
LIST OF TABLES
Table 1.1: FDA approved protein kinase inhibitors 7
Table 1.2: Proteolytic fragments of PARP-1 12
Table 4.1: The small molecules analyzed in thi thesis 56
Table 4.2: IC50 values of AUM18, AUM23 and AUM32 against HCC cell line panel
59
Table 4.3: Time-dependent IC50 values of AUM32 68
Table 4.4: Novel 6-(4-substituted
piperazine-1-yl)-9-(β-D-ribofuranosyl)purine analogues
74
Table 4.5: Time-dependent IC50 values of purine ribonucleoside analogues
75
Table 4.6: Substituted purine and purine nucleoside analogues 85
Table 4.7: IC50 values of FAT-TM, ClAT-TMN and n-AT-TM against HCC cell lines panel
88
Table 4.8: IC50 values of ClAT-TM against liver cancer cells 90
Supplementary
Table 1:
IC50 values of AUM adenine and purine analogues 124
Supplementary Table 2:
IC50 values of 6-(substituted piperazine)-9-(substituted phenyl) sulfonyl purine analogues
129
Supplementary Table 3:
IC50 values of 6-(substituted piperazine)-9-(substituted benzyl) purine analogues
131
Supplementary Table 4:
IC50 values of 6-(4-substituted phenyl)-9-(4-substituted phenyl) sulfonyl purine analogues
133
Supplementary Table 5:
IC50 values of 2-amino/2-chloro/6-(4-substituted piperazine)/6-(4-substituted phenyl amino)/6-(2-substituted ethylamino)-9- (β-D-ribofuranosyl) purine analogues
134
Supplementary Table 6:
IC50 values of 6-(substituted piperazine)-9-(substituted phenyl) sulfonyl purine derivatives
135
Supplementary Table 7:
IC50 values of 6-(substituted piperazine)-9-(substituted benzyl) purine analogues
xix Supplementary
Table 8:
IC50 values of 6-(4-substituted phenyl)-9-(4-substituted phenyl) sulfonyl and 2-amino/2-chloro/6-(4-substituted piperazine)/6-(4-substituted phenyl amino)/6-(2-substituted ethylamino)-9-(β-D-ribofuranosyl purine analogues
138
Supplementary Table 9:
IC50 values of HUBT coded 4-amino-3-substituted-1,2,4-triazole-5 thiones (1-8) and 3,6-disubstituted-1,2,4- triazolo[3,4-b]-1,3,4-thiadiazines (1a-8c)
xx
ABBREVIATIONS
5-FU 5-Fluorouracil
ADP Adenosine diphosphate
AGC Containing PKA, PKG, PKC families
AhR Aryl hydrocarbon Receptor
AP1 Activating Protein
Apaf-1 Apoptosis protease activating factor-1
APC Adenomatous Polyposis Coli
ASK1 Apoptosis Signal-Regulating Kinase 1
Atg13/FIP200/ULK Autophagy-Related Gene/Focal Adhesion Kinase Family Interacting Protein of 200 kDa/UNC-51-like-kinase ATM Ataxia-Telangiecstasia-Mutated
ATP Adenosine Tri-Phosphate
ATR ATM and Rad3-Related
BrdU 5-Bromo-2-Deoxyuridine
BSA Bovine Serum Albumin
CAMK Calcium/Calmodulin-dependent protein kinase cAMP Cyclic adenosine monophosphate
cDNA Complementary DNA
CDK Cyclin Dependent Kinase
CI Cell Index
CK1 Casein kinase 1
CKI Cyclin-dependent Kinase Inhibitors
CMGC Containing CDK, MAPK, GSK3, CLK families
CPT Camptothecin
DCFH-DA 2’, 7’-Dichlorofluorescin diacetate
DDR DNA Damage Response
DEB Doxorubicin Eluting Beads
DFG Asp-Phe-Gly
xxi
DMEM Dulbecco's Modified Eagle Medium
DMSO Dimethyl Sulfoxide
DNA Deoxyribonucleic Acid
DSB Double Strand Breaks
DTT Dithiothreitol
ECL Enhanced Chemiluminescence
EDTA Ethylenediamine-Tetra-Acetic Acid
EGF Epidermal Growth Factor
EGFR Epidermal Growth Factor Receptor
ER Endoplasmic Reticulum
ERK1/2 Extracellular Signal-Regulated Kinase FACS Fluorescence-Activated Cell Sorting
FBS Fetal Bovine Serum
FDA Food & Drug Administration
FZD7 Frizzled
G1 Gap1
G2 Gap2
GSK3 Glycogen Synthase Kinase-3 GSK3-β Glycogen Synthase Kinase-3β
HBV Hepatitis B
HCC Hepatocellular Carcinoma
HCV Hepatitis C
HDAC Histone deacetylase
HDV Hepatitis D
HEPES (4-(2-hydroxyethyl)-1-piperazineethanesulfonic acid
HTP Highthroughput
IAP Inhibitor of Apoptosis
IARC International Agency for Reseach on Cancer IC50 Inhibitory Concentration 50
IFN-α Interferon-Alpha
xxii
IGFR Insulin-like Growth Factor Receptor
IKK IκB Kinase
IL-1 Interleukin-1
IRA Insulin Receptor A
IRB Insulin Receptor B
IRS Insulin-Receptor Substrates
kDa kilo Dalton
M Mitosis
MAPK Mitogen-Activated Protein Kinase
MC Mitotic Catastrophe
MES 2-(N-morpholino)ethanesulfonic acid. MOPS 3-(N-morpholino)propanesulfonic acid MPPs Matrix metalloproteinases
MRI Magnetic Resonance Imaging
mTOR Mammalian Target of Rapamycin NAD Nicotinamide Adenine Dinucleotide NBS1 Nijmegen Breakage Syndrome 1 NCI National Cancer Institute
NEAA Non-Essential Amino Acid
NF-κB nuclear factor kappa-light-chain-enhancer of activated B cells
NI No Inhibition
NSAID Nonsteroidal anti-inflammatory drugs
OIS Oncogene-induced Senescence
P/S Penicillin/Streptomycin Solution PARP-1 Poly-(ADP-Ribose) Polymerase
PBS Phosphate Buffer Saline
PCR Polymerase Chain Reaction
PDK Phosphatidylinositol-Dependent Kinase
Ph Phenyl
PI Presidium Iodide
xxiii
PI3K Phosphatidylinositol-3-K
PICS PTEN loss-induced cellular senescence PIP2 Phosphotidylinositol-3,4-Biphosphate PIP3 Phosphotidylinositol-3,4,5-Triphosphate
PK Protein Kinase
PKA cAMP-Dependent Protein Kinase
PKB Protein Kinase B
PKC Protein Kinase C
PKG Protein Kinase G
PKI Protein Kinase Inhibitor PLADO Cisplatin/Doxorubicin
PMSF Phenylmethylsulphonylfluoride PtdIns(4)P Phosphotidylinositol-4-Phosphate PtdIns(4,5)P2 Phosphotidylinositol-4,5-Biphosphate
PTEN Phosphatase and Tensin Homolog Deleted on Chromosome 10
rlu Relative Light Unit
RNA Ribonucleic Acid
ROS Reactive Oxygen Species
RR Ribonucleotide Reductase
RT-CES Real-Time Cell Electronic Sensing RT-PCR Reverse Transcriptase PCR
S Synthesis
SAPK1/JNK1/2/3 Stress-Activated Protein Kinase/c-Jun N-Terminal Kinase SARA Smad Anchor for Receptor Activation
SASP Senecence Associated Secretory Phenotype Saβ-gal Senecence Associated-β-gal
SC Subcutaneous
SDS Sodium Dodecyl Sulphate
Ser Serine
xxiv
Smac/DIABLO Second Mitochondria-derived Activator of Caspases / Direct IAP-Binding Protein with a Low Isoelectric Point
SOD Superoxide Dismutase
SRB Sulforhodamine B
src Rous Sarcoma Virus
STAT Signal Transducer and Activator of Transcription
STE Homologs of yeast Sterile 7, Sterile 11, Sterile 20 kinases
STS Saturosporine
TACE Transarterial Chemoembolization TBS-T Tris-Bufferred Saline with Tween-20
TCA Trichloroacetic Acid
TGF-α Transformig Growth Factor-α TGF-β Transformig Growth Factor-β
Thr Threonine
Thyr Tyrosine
TK Tyrosine Kinase
TKL Tyrosine Kinase-Like
TNF-α Tumor Necrosis Factor-Alpha
TβRI TGF-β Receptor I
TβRII TGF-β Receptor II
VEGF Vascular Endothelial Growth Factor Vps34 Vesicular Protein Sorting 34
1
CHAPTER 1. INTRODUCTION
1.1 Protein phosphorylation:
The form of life we know gives privilege to phosphate group not only to link the nucleosides of DNA and RNA but also to be part of the primary cellular energy source, ATP. These privileges provide phosphates a vital role in living organisms. Phosphorus atom uses its 5 valence electrons to form bonds with oxygen atoms and yields phosphate group (-PO4). Oxygens offer phosphate group
a hydrated ionic shell and high solubility in water. Moreover, a phosphate has 3 ionizable groups which facilitate preserving nucleic acids within cell membrane. Phosphate group is reactive at physiological temperature which is another cellular advantage. The question Weistheimer asked 25 years ago, “Why nature chose phosphates?” highlighted a developing research field (Weistheimer FH, 1987).
Protein phosphorylation, a common post-translational modification, was first discovered when Levene showed vitelline, an egg yolk protein, contains phosphate (Levene PA and Alsberg CL, 1906). Subsequently, Levene had identified phosphoserine in 1932 and achieved to synthesize phosphotyrosine in 1933 (Lipmann FA and Levene PA, 1932; Levene PA and Schormüller A, 1933). After that, Burnett and Kennedy described the first protein kinase activity when they discovered an enzyme capable of catalyzing the transfer of phosphate from ATP to protein in 1954 (Burnett G and Kennedy EP, 1954). Edwin Krebs and Edmond Fischer were able to demonstrate that -phosphate of ATP was incorporated into a particular serine residue of phosphorylase b producing the activated, phosphorylase a, form (Krebs EG et al., 1959). Today it is well-described that, through chemically adding the -phosphate of ATP to target proteins, many cellular processes such as cell growth, proliferation, division, differentiation, adhesion, metabolism and apoptosis are regulated (Figure 1.1).
2
Figure 1.1 The transfer of -phosphate of ATP to the hydroxyl group of an
amino acid residue: (R: Ser/Thr/Tyr) (Schwartz PA and Murray BW, 2011)
1.1.1 Protein kinases:
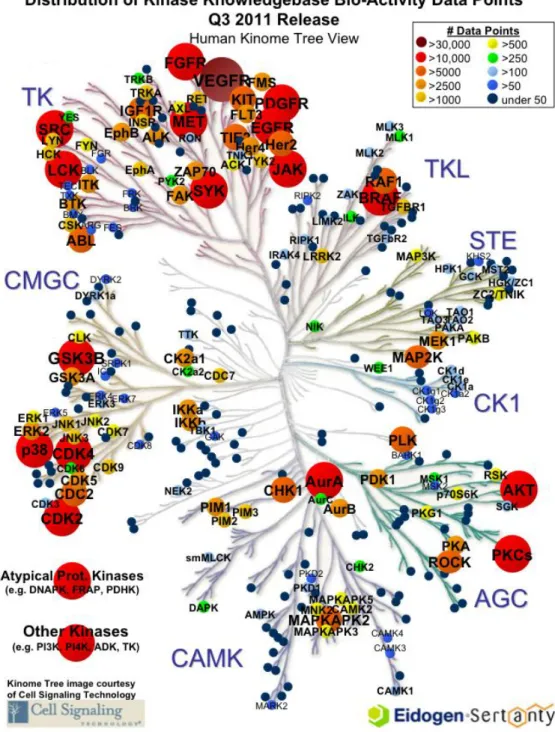
Protein kinases (PK), as being responsible for the post-translational phosphorylation of various proteins, are one of the largest gene families sharing the same molecular action. The protein kinase complement of the human genome, namely the human kinome, encodes more than 500 protein kinases corresponding to almost 2% of the entire genome (Manning G et al., 2002). Seven main groups are labeled and positioned on the kinome tree by comparing the sequence of their catalytic domains: the spatial distance between two kinases represents the divergence between their sequences (Figure 1.2).
PKs can be broadly classified according to their substrate specificity: serine/threonine (Ser/Thr) kinases and tyrosine (Tyr) kinases. There are some dual-specific PKs able to phosphorylate both hydroxyl groups of (Ser/Thr) and (Tyr) residues (Bogoyevitch MA and Fairlie DP, 2007). The (Ser/Thr) kinases are four-fold of (Tyr) kinases in number while the latter are involved in key signaling mechanisms (Arena S et al., 2005). Although cAMP-dependent protein kinase (PKA) is the second discovered, it is the first sequenced PK (Shoji S et al., 1981). Then, the transforming protein from Rous sarcoma virus, Src was shown to be related to the catalytic chain of PKA. Moreover, it was shown that Src is a Tyr kinase while PKA is a Ser/Thr kinase (Barker WC and Dayhoff MO, 1982). Further analysis on the sequences of PKA and Src demonstrated that these two share a common precursor. The conserved subdomains, each with a unique motif, have been accepted in time as a definition of PK core (Hanks SK et al., 1988).
3
Figure 1.2 The human kinome tree: Groups are AGC Containing PKA, PKG, PKC families; CAMK Calcium/calmodulin-dependent protein kinase; CK1 Casein kinase 1; CMGC Containing CDK, MAPK, GSK3, CLK families; STE Homologs of yeast Sterile 7, Sterile 11, Sterile 20 kinases; TK Tyrosine kinase; TKL Tyrosine kinase-like. The Kinase Knowledgebase is Eidogen-Sertanty's database of biological activity data, structure-activity relationships (SAR), and chemical synthesis data focused on protein kinases. (www.eidogen-sertanty.com)
4
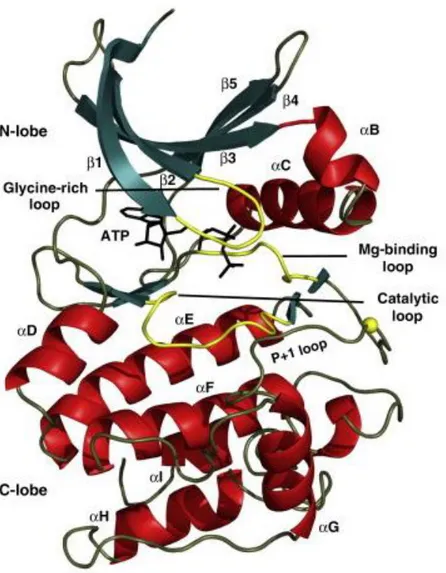
The conserved catalytic core of PKs is composed of two lobes: N-terminal domain and C-terminal domain which are associated with ATP binding and peptide binding respectively (Figure 1.3). Protein kinases are molecular switches regulating numerous cellular processes; even protein kinases themselves are under the control of other upstream kinases. In such a system, the essential feature of PK activation is the spatial assembly of its domains (Kornev AP et al., 2006).
Figure 1.3 Structure of the conserved protein kinase core: Protein kinases (PK) are composed of two domains. The N-terminal domain has Glycine-rich loop, 5 β strands (green) and the C-helix. C-terminal domain is generally helical (red). Catalytically important loops are colored yellow. Glycine-rich loop coordinates the phosphates. The P-loop accommodates the residues of their peptide substrate (Taylor SS and Kornev AP, 2011).
5
The mostly helical C-terminal domain is more stable when compared to N-terminal domain and accommodates the substrate proteins. The activation fragment has a Mg-binding loop at its N-terminal beginning with Asp-Phe-Gly (DFG) motif, followed by the most diverse fragment: the activation loop. The phosphorylation site is protected by the “P-loop” which forms a hydrophobic pocket in order to accommodate the residue of the substrate protein positioned just after the residue (Ser/Thr/Tyr) to be phosphorylated. (Kornev AP and Taylor SS, 2010; Taylor SS and Kornev AP, 2011).
1.1.2 Protein kinase inhibitors:
Dysregulation of protein kinase activity rise as a major mechanism in disease conditions, especially in cancer. To date, amplification, translocation, missense mutation and deletion of certain PK genes have been associated with numerous cancers. Analysis on the human kinome showed that 244 of the catalogued 518 putative protein kinase genes are mapped to disease loci or cancer amplicons (Manning G et al., 2002). Thus, human kinome offers an important opportunity to the drug discovery field.
Type I inhibitors: This group of “first generation” of small molecule kinase inhibitors are ATP-competitive compounds targeting the active DFG motifs of PKs (Zuccotto F et al., 2010). They typically include a heterocyclic ring system in order to be able to imitate the interactions of the adenine moiety and bind to the kinase via H-bonds (Zhang J et al., 2009). The region occupied by type I inhibitors is composed of subregions as illustrated in Figure 1.4. Some of the type I kinase inhibitors prefer the inactive conformation of the PK and there are significant structural differences of the type I inhibitor-kinase complex depending on the characteristics of the inhibitor. Gefitinib, erlotinib, dasatinib, sunitinib, and most notably staurosporine are the typical examples for this type I inhibitors (Fabbro D et al., 2012).
6
A) B)
Figure 1.4 The binding modes of protein kinase inhibitors: A) The subregions of the ATP binding site. H-bonds are represented by dashed lines B) Allosteric binding site (Liu Y and Gray NS, 2006).
Type II inhibitors: This group of inhibitors targets the DFG motif projected-out conformation to occupy the hydrophobic region that is adjacent to ATP binding site, in other words, they are designed to recognize the inactive form of the kinase (Zuccotto F et al., 2010). The first (Food and Drug Administration) FDA approved small molecule kinase inhibitor, imatinib, and others nilotinib, sorafenib and vatalinib are the well-known examples of type II inhibitors (Fabbro D et al., 2012).
Type III inhibitors: This group of compounds can be named as non-ATP-competitive or allosteric kinase inhibitors since they do not interact with ATP binding domain (Figure 1.4.). Considering that the binding site exploited is relatively kinase-specific, type III inhibitors show the highest degree of selectivity. The number of type III inhibitors discovered so far is very limited. The most well-defined allosteric kinase inhibitor (of MEK) is CI-1040 and some others are rapamycin analogs and Abl, IKK, Akt, Chek1, MEK, Src, IGF1R inhibitors (Zhang J et al., 2009).
7 1.1.3 Protein kinase drug discovery:
Cancer cells sustain their malignant phenotype by extensively tangled signaling pathways. Therefore, the identification of the critical and functional nodes of this network is the key step to a successful therapy. FDA approved (Table 1.1) or in preclinical / clinical development chemicals target all stages of signal transduction.
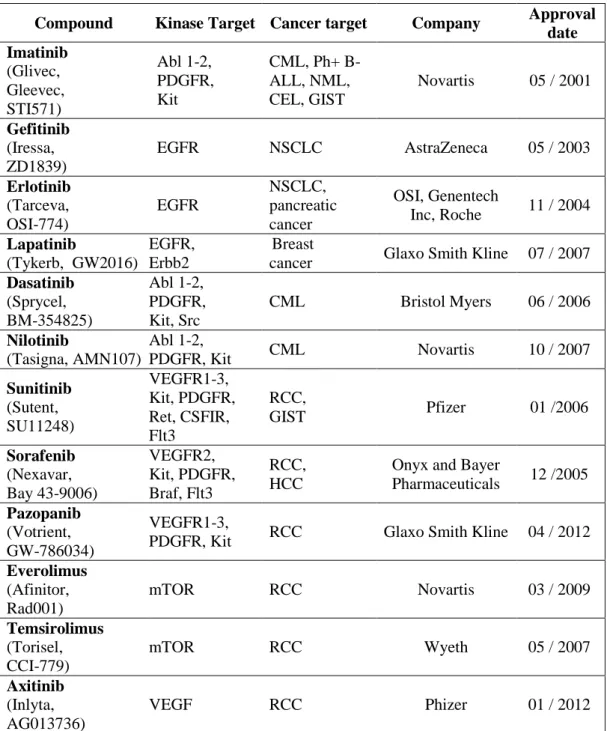
Table 1.1 FDA approved protein kinase inhibitors
Compound Kinase Target Cancer target Company Approval
date Imatinib (Glivec, Gleevec, STI571) Abl 1-2, PDGFR, Kit CML, Ph+ B-ALL, NML, CEL, GIST Novartis 05 / 2001 Gefitinib (Iressa, ZD1839) EGFR NSCLC AstraZeneca 05 / 2003 Erlotinib (Tarceva, OSI-774) EGFR NSCLC, pancreatic cancer OSI, Genentech Inc, Roche 11 / 2004 Lapatinib (Tykerb, GW2016) EGFR, Erbb2 Breast
cancer Glaxo Smith Kline 07 / 2007
Dasatinib (Sprycel, BM-354825) Abl 1-2, PDGFR, Kit, Src CML Bristol Myers 06 / 2006 Nilotinib (Tasigna, AMN107) Abl 1-2, PDGFR, Kit CML Novartis 10 / 2007 Sunitinib (Sutent, SU11248) VEGFR1-3, Kit, PDGFR, Ret, CSFIR, Flt3 RCC, GIST Pfizer 01 /2006 Sorafenib (Nexavar, Bay 43-9006) VEGFR2, Kit, PDGFR, Braf, Flt3 RCC, HCC
Onyx and Bayer
Pharmaceuticals 12 /2005
Pazopanib
(Votrient, GW-786034)
VEGFR1-3,
PDGFR, Kit RCC Glaxo Smith Kline 04 / 2012
Everolimus (Afinitor, Rad001) mTOR RCC Novartis 03 / 2009 Temsirolimus (Torisel, CCI-779) mTOR RCC Wyeth 05 / 2007 Axitinib (Inlyta, AG013736) VEGF RCC Phizer 01 / 2012
8
The complexity of the rewired pathways of cancer cells cause them to become more dependent on the activity of a specific oncogene since during carcinogenesis they have lost the function of another gene that normally performs a similar function (Weinstein IB and Joe AK, 2006). Targeting one of the synthetic lethal genes, known as their mutations lead to death if they exist simultaneously, is an elegant strategy for small molecule kinase inhibitors (Kaelin WG, 2005).
Another major challenge for kinase drug discovery is the rising resistance to kinase inhibition. A combinatorial drug treatment approach could be considered as a strategy to improve the therapy. In oncogenic resistance, although the drug fits into its target, inhibitors of apoptosis block the cell death. In order to overcome this resistance, the block should be released or the apoptotic pathways downstream of the block should be taken as a supplementary target (Figure 1.5) (Blagosklonny MV, 2004).
Figure 1.5 Non-oncogenic and oncogenic drug resistance: Inhibitory concentration 50 (IC50) is the drug concentration leading to 50% decrease in cell growth. In case of non-oncogenic drug resistance, dose-response curve shifts to the right with an increase in the IC50 value. If the resistance is oncogenic, the IC50 value does not change; but, since the dose-response curve reaches a plateau,
9
the drug does not kill the cells although it interacts with its target. Therefore, inhibitory concentrations corresponding below the plateau cannot be achieved. (adapted from Blagosklonny MV, 2004)
1.2 Cell death:
Cancer cells show resistance to cell death due to the defects in signaling pathways developed during tumorigenesis. Chemotherapies stimulate these pathways as an attempt to create cytotoxicity with an ultimate aim to lead to cancer cell death. In addition to apoptosis, non-apoptotic mechanisms such as necrosis, autophagy, mitotic catastrophe and senescence are the cellular activities that anti-cancer drugs initiate (Okada H and Mak TW, 2004).
Figure 1.6 Morphological features of cells confronting apoptotic and non-apoptotic cell deaths: A) normal, B) autophagic, C) non-apoptotic, D) mitotic catastrophic, E) necrotic and F) senescent cells. The scale bars represent 1m for A), B), C), E); 5 m for D) and 50 m for F). (Edinger AL and Thompson CB, 2004; Leontieva OV and Blagosklonny MV, 2010; Vitale I et al., 2011).
10
Apoptosis is strictly regulated, “programmed” cell death and can be initiated by either intracellular signals or extracellular ligands. In early apoptosis, cells round up, loose contact to their neighbors and shrink with blebbing cell membranes (Figure 1.6). The chromatin condenses and DNA fragmentation starts. The nucleus becomes tangled, disintegrates into encapsulated, compact fragments called “apoptotic bodies” (Lawen A, 2003). Signals originating from death receptors initiate the Death Inducing Signaling Complex (DISC) which activates caspase-8 (Gewies A, 2003; de Bruin EC and Medema JP, 2008). Cysteinyl aspartate proteinases, caspases, are inactive enzyme precursors involved in the cleavage of Asp residue containing substrates (Lavrik IN et al., 2005; Kumar S, 2007). Apoptotic stimuli trigger the initiator group of caspases (caspase-8, -9, -10) which consequently activates the executioner group of caspases (caspase-3, -6, -7) (Kurokawa M and Kornbluth S, 2009).
This direct caspase cascade which is sufficient to start apoptosis is called the extrinsic pathway. If the apoptotic signal from DISC needs to be amplified, caspase-8 activates BH3-only protein Bid which subsequently induces the mitochondria to release cytochrome c (Gewies A, 2003; Ricci MS and Zong WX, 2006). This small, mobile molecule, known as an electron carrier, associates with the Apaf-1 (apoptosis protease activating factor-1) and forms apoptosome (Goodsell DS, 2004). The heptameric apoptosome activates caspase-9, another initiator caspase, able to activate caspase cascade through caspase-3 (Gewies A, 2003). Another proapoptotic factor released from mitochondria is Smac/DIABLO (second mitochondria-derived activator of caspases / direct IAP-binding protein with a low isoelectric point) which mainly targets the inhibitor of apoptosis (IAP) to prevent the blockage of caspase cascade (Herr I and Debatin KM, 2010).
Bcl-2 family members, both pro- and anti-apoptotic Bcl-2 proteins, are located upstream of mitochondria and play an essential role in determining whether the cell will live or die (Gross A et al., 1999). The ratio between the anti-apoptotic Bcl-2 members (Bcl-2, Bcl-xL) and the pro-anti-apoptotic ones (Bid, Bax, Bak, Puma, Noxa) helps to decide the cell’s fate. Puma (p53 upregulated modulator of apoptosis) and Noxa are involved in p53-mediated apoptosis. DNA
11
damage as a consequence of irradiation, drugs or other external stress activates the tumor suppressor protein, p53, which performs in favor of apoptosis (Elmore S, 2007)
Cell death by autophagy is a self-degradation process, in which double-membrane vesicles sequester the organelles with cytoplasm to form autophagosomes that fuse with lysosomes (Figure 1.6). Eventually, vesicles breakdown and the contents are hydrolytically digested (Edinger AL and Thompson CB, 2004; Coates JM et al., 2009). Autophagy, “self-eating” is a ubiquitous, evolutionarily conserved process, which is activated in normal tissue, in order to maintain not only cellular homeostasis but also ATP levels during starvation (Jin S and White E, 2007; Coates JM et al., 2009). Although in normal cells autophagy has a tumor suppressive role, in cancer cells its function is complex and context dependent (Cheong H et al., 2012).
Autophagy starts with the formation of phagophore which is regulated by numerous signaling pathways. In mammalian cells phagophore membranes are originated from endoplasmic reticulum (ER) and expand to sequester the organelles with cytoplasm to form autophagosomes (Glick D, 2010). After inhibiting the negative regulator of autophagy, energy-sensing mTOR (mammalian target of rapamycin) kinase, Atg13/FIP200/ULK (Autophagy-related gene/focal adhesion kinase family interacting protein of 200 kDa/UNC-51-like kinase) complex is stimulated and this initiates phagophore formation Phosphatidylinositol 3 (PI3) kinase complex, composed of Vps34 (vesicular protein sorting 34), Atg14L, Becn1, regulates the vesicle nucleation step (Cheong H et al., 2012).
In contrast to apoptosis and autophagy, necrosis is an unrestrained form of cell death. Necrotic cells swell, lose the membrane integrity and morphologically recognized by vacuolation of their cytoplasm (Figure 1.6) (de Bruin EC and Medema JP, 2008). Necrosis, which has been considered as an uncontrolled cell death, is weakly characterized at the molecular level (Portugal J, 2010). Until recently, necrotic cells were distinguished by the swollen organelles, randomly
12
degraded nuclear DNA, lacking chromatin condensation, ruptured plasma membrane and eventually total cell collapse (Zhivotovsky B, 2004). Earlier studies define necrosis as a traumatic cellular response to severe toxicity without a stimulating signaling cascade (Okada H and Mak TW, 2004). On the contrary, the following studies evidently showed that depending on the context, necrosis is a tightly controlled interaction of signaling pathways, originated from various stimuli (Duprez L et al., 2009).
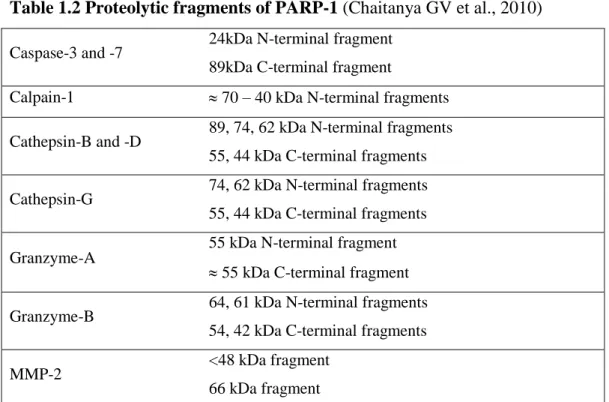
Poly-(ADP-ribose) polymerase (PARP-1) is an 113kDa nuclear enzyme. Under normal circumstances, PARP-1 detects and repairs DNA damages; but, massive DNA damage hyperactivates PARP-1, reduces NAD+ levels, leads to ATP shortage and eventually causes necrosis (Duprez L et al., 2009; Chaitanya GV et al., 2010).
Table 1.2 Proteolytic fragments of PARP-1 (Chaitanya GV et al., 2010)
Caspase-3 and -7 24kDa N-terminal fragment 89kDa C-terminal fragment
Calpain-1 70 – 40 kDa N-terminal fragments Cathepsin-B and -D 89, 74, 62 kDa N-terminal fragments
55, 44 kDa C-terminal fragments
Cathepsin-G 74, 62 kDa N-terminal fragments 55, 44 kDa C-terminal fragments
Granzyme-A
55 kDa N-terminal fragment 55 kDa C-terminal fragment Granzyme-B 64, 61 kDa N-terminal fragments
54, 42 kDa C-terminal fragments
MMP-2 <48 kDa fragment
66 kDa fragment
Caspases, calpains, cathepsins, granzymes and matrix metalloproteinases (MPPs), in other words suicide proteases, create PARP-1 fragments specific to the type of cell death (Table 1.2). Cleavage of PARP-1 by means of caspases occurs during apoptosis and therefore of 89kDa cleaved-PARP is considered as an
13
apoptosis marker (Chaitanya GV et al., 2010). On the other hand, the major fragment obtained during necrosis is 50 kDa (Gobeil S et al., 2001).
Mitotic catastrophe (MC) is occasionally accepted as an aberrant mitosis eventually leading cell irreversibly to death rather than a form of death (Ricci MS and Zong WX, 2011). Abnormal mitosis drives cells to mitotic catastrophe (MC) through several different pathways but finally the enlarged, multi-nucleated cells share a common, characteristic morphology. They lack the nuclear envelope, have fragmented nuclei as in apoptotic cells but contain uncondensed chromatin (Figure 1.6) (Roninson IB et al., 2002). Additionally, MC has been evaluated as a distinctive subset of apoptosis due to the common biochemical features both apoptosis and MC share, such as caspase activation and the permeabilization of mitochondrial membrane (Castedo M et al., 2004). There are also accumulated data describing MC as a survival mechanism that the tumor cells exploit. Another currently supported opinion is that MC is a preliminary process leading to apoptosis or necrosis (Vakifahmetoglu et al., 2008).
Mitotic catastrophe does not occur in a thoroughly established homogenous manner; instead, depending on the duration between mitotic arrest and the cell death, MC can happen in various modes. Recently, three different fates for cells experiencing mitotic arrest have been described. First, the cells can undergo mitotic death; in other words, they can die during mitosis following mitotic arrest. Second, the cell death can happen during the interphase of the subsequent cell cycle. Third, instead of cell death, the cells can be subjected to senescence during the interphase of the next cell cycle (Vitale I et al., 2011).
1.2.1 Senescence:
Senescence was described long ago after the observation of the limited life span of normal human embryonic fibroblasts in culture dish. Senescent cells are large, flattened and multi-nucleated with granular cytoplasms. A commonly used senescence biomarker is the increased senescence associated-β-gal (SA-β-gal)
14
activity, which can be detected by X-gal, forming a blue precipitate at pH 6.0 (Figure 1.6) (Dimri GP et al., 1995; Dimri GP 2005).
The phenomenon named as “replicative senescence” and defined as irreversible cell cycle arrest (Hayflick L and Moorhead PS, 1961; Hayflick L, 1965). Different from quiescent cells, senescent cells do not enter S phase in the presence of mitogenic stimuli. Unlike apoptotic cells, they remain alive if fresh culture medium is supplied; namely senescence provides them resistance to apoptosis (Zhang H, 2007). Additionally, they develop a senescence associated secretory phenotype (SASP) including various cytokines, growth factors and proteases containing strong autocrine and paracrine effects (Rodier F and Campisi J, 2011).
1.2.1.1 Replicative senescence:
The underlying molecular mechanism for cultured cells halting replication after a finite number of passaging is explained by telomere shortening (Harley C et al., 1990). The repetitive DNA sequence (TTAGGG) and its specific proteins are called telomeres. These DNA-protein complexes cap and therefore protect the ends of human chromosomes. Since most of the human cells lack telomerase, responsible for the de novo synthesis of telomeric DNA, telomeres shorten after each cell cycle. When the telomere size reaches to a threshold, cells stop replicating permanently; in other words, they undergo senescence due to damaged DNA at the ends of the chromosomes (Campisi J, 2001; Campisi J and d’Adda di Fagagna F, 2007). Not only telomere shortening but also oncogene activation, DNA-damage, oxidative stress, PTEN (phosphatase and tensin homolog deleted on chromosome 10) loss and cytotoxic drugs can lead to senescence (Collado M and Serrano M, 2006; Kuilman T et al., 2010).
1.2.1.2 Oncogene-induced senescence:
Oncogene-induced senescence (OIS) emerges as a tumor-suppressive response to hyper-replication of oncogene proteins such as myc and H-ras (Lee S
15
et al., 2011) Oncogenic ras-dependent transformation of normal cells to tumor cells requires the cooperation of an additional oncogene or the lack of tumor suppressor genes. Otherwise, with the accumulation of p53 and/or p16, oncogenic ras drives cells to G1 arrest and eventually senescence (Serrano M et al., 1997).
The expression levels of the oncogene determine the future of senescence. Surprisingly, OIS requires overexpressed oncogene; whereas, basal levels are capable of inducing neither senescence nor tumorigenesis. In other words, when the tumor have already been installed but have not yet been completely malignant, senescence can be induced. This phenomenon makes oncogene-induced senescence markers available to detect tumorigenesis at early stages (Collado M and Serrano M, 2006).
1.2.1.3 DNA damage-induced senescence:
DNA damage-induced senescent cells follow the same pathways of replicative senescence (Shay JW and Roninson IB, 2004). They are continuously cell cycle arrested, secrete inflammatory cytokines and accommodate permanent nuclear foci including DNA damage response (DDR) related proteins (Rodier F, 2011). Double strand breaks (DSB) on DNA strands, ruin the integrity of the genome and should be immediately fixed by means of the interacting pathways generally called DDR (Mah L et al., 2010). DDR signaling is vital to provoke senescence (Roider F et al., 2011). Therefore, the inactivation of the cell cycle checkpoint kinases (e.g. ATM, Chek2), blocks the p53-dependent senescence; moreover, impedes p53-independent secretion of inflammatory cytokines which compose the SASP (Rodier F et al., 2009; Rodier F et al., 2011).
1.2.1.4 ROS-induced cellular senescence:
Oxygen concentration, which is directly related to the formation of reactive oxygen species (ROS), limits cellular lifespan (Lu T and Finkel T, 2008). The large fraction of ROS production (90%) takes place at mitochondria (Irmak MB et al., 2003). Mitochondrial ROS generation initiates with an oxygen molecule (O2)
16
which can be turned into singlet oxygen (1O2) or by a single electron (e-) reduction
to superoxide anion (–O2•). Either superoxide dismutase (SOD) provides another
single e- or spontaneously, superoxide anion (–O2•). can be further reduced and
form hydrogen peroxide (H2O2), a more stable molecule which can pass through
the lipid membranes of cells. H2O2 can oxidize ferrous iron to ferric iron in a
Fenton reaction and consequently get reduced to hyroxyl radical (OH•). ROS can be neutralized and form water, oxygen and hypochlorous acid. Mitochondria, intends to increase the energy output to its maximum level while trying to minimize the excess ROS in a mediating redox state (Figure 1.7) (Aon MA et al., 2010; Chen L et al., 2012).
Figure 1.7 ROS (reactive oxygen species) generation
The hindered senescence process in the presence of antioxidants and the early initiation of senescence upon inhibiting the cellular oxidant scavengers, clearly demonstrates the contribution of ROS to induce senescence (Chen Q et al., 1995; Yuan H et al., 1995). Recently, it was shown that, induction of senescence requires a dynamic feedback loop, between p21 and ROS, triggered by a DDR (Passos JF et al., 2010). Significantly, ROS have been detected as a key
17
intermediary between replicative and oncogene-induced senescence. High O2
concentrations lead cells to replicative senescence; whereas under low O2
conditions their lifespan expands (Ozturk M et al., 2008).
Figure 1.8 Mitochondrial ROS levels and the cell’s fate (modified from Hamanaka RB and Chandel NS, 2010)
ROS, as a key player of signaling pathways, influence the cell’s fate according to its cellular levels. While low levels of ROS involve in proliferation and differentiation, increasing ROS production first upregulates antioxidant genes, then induce senescence and finally cause cell death. With extreme ROS levels, cellular contents experience permanent damage beyond the signaling interactions (Figure 1.8) (Hamanaka RB and Chandel NS, 2010).
1.2.1.5 PTEN loss-induced cellular senescence:
In premalignancies, loss of a tumor suppressor gene leads to senescence. In this telomere-independent form of senescence, in addition to the absence of hyperreplication, as seen in OIS, DNA damage response is also missing (Nardella C et al., 2011). Due to its distinctive features, this form of senescence
18
was named as PTEN loss-induced cellular senescence (PICS); since, it was first observed rapidly after PTEN inactivation (Alimonti A et al., 2010). PI3K/Akt pathway, known to be one of the major survival pathways cancer cells exploit, becomes constitutively active in the absence of PTEN (Song MS et al., 2012). In addition to PTEN, loss of other tumor suppressor genes, such as NF1, VHL and Rb, also induce senescence (Acosta JC and Gil J, 2012). Resembling OIS, PICS is associated with amplified p53 translation (Alimonti A et al., 2010). Nevertheless, in PICS mTOR mediates the p53 upregulation; whereas, p53 activation is promoted by the phosphorylation of DDR and ARF in OIS (Nardella C et al., 2011; Acosta JC and Gil J, 2012).
1.2.1.6 Drug-induced cellular senescence:
Senescence is a potent barrier to tumor development which recently started to be considered as a promising approach for cancer therapy (Ewald JA et al., 2010). Recent findings reveal that cancer cells can also undergo senescence. Thus, inducing senescence in tumors; namely, pro-senescence therapy, is a new strategy in the fight against cancer. Senescence can prevent immortalization; thus senescence-inducing drugs emerge rapidly (Cairney CJ et al., 2012). Small-molecule inhibitors dominate the market of pro-senescence drugs and can be categorized according to their therapeutic approaches. p53-enhancing approaches include both inhibiting the MDM2-p53 interaction and restoring the mutant p53. Therapeutic modulation of cell cycle machinery approach can be achieved by inhibiting either the S phase kinase associated protein-2 (SKP2) or cyclin dependent kinase 2 (CDK2). Oncogene addiction approach exploits the inhibition of the oncogene, known that the tumor is addicted to, which induces senescence. The approach for the compounds enhancing PICS is to inhibit PTEN and activate p53 indirectly. Utilizing telomerase inhibitors, in order to let the telomeres of cancer cells get shorter, is also another approach guiding to senescence (Nardella C et al., 2011)
19 1.2.1.7 Senescence pathways :
Replicative senescence and telomere-independent forms of senescence use one of the two major tumor suppressor pathways, p53 and p16. Activation of p53, including not only its induction but also the post-translational modifications p53 encounter, is essential in senescence (Caino MC et al., 2009). Despite the unchanged p53 mRNA and protein levels, during senescence p53 gets phosphorylated and activated (Zhang H, 2007). Throughout the pathway initiated with p53, one of the downstream activated proteins is p21, a member of the Cip/Kip family of CDK inhibitors (Sherr CJ and Roberts JM, 1999). It is demonstrated that, independent from p53 activation, p21 can induce senescence; moreover, p21 deletion delays senescence (Larsson O, 2005).
In senescence pathways, p53 cooperates with Rb, which represses E2F-DP transcription factors; therefore, keeps cells away from entering S phase of cell cycle. To inactivate Rb; in other words, to phosphorylate Rb, CDK activity is required. In senescent cells p16, a member of the INK4 family of CDK inhibitors, is mainly responsible for the hypophosphorylated status of Rb (Wei W et al., 2003). Other than p16, p21 upregulation can directly prevent Rb phosphorylation and this finding supports the idea of a linear p53-Rb pathway (Figure 1.9) (Ben-Porath I and Weinberg RA, 2005).
20 Figure 1.9 Senescence pathways
(modified Ben-Porath I and Weinberg RA, 2005)
1.2.1.8 The cell cycle and its regulation:
Healthy cells traverse the cell cycle in strictly-regulated phases of two main stages: mitosis (M) and interphase, the interval between two consecutive M phases (Vermeulen K et al., 2003). Mitosis is composed of karyokinesis, the process in which the nucleus divides into two, and cytokinesis, the further division of the cytoplasm . Karyokinesis also has ensuing stages: prophase, prometaphase, metaphase, anaphase and telophase. As soon as M-phase has been accomplished, G1 (Gap1) phase initiates the interphase. Cellular contents other than chromosomes are duplicated during G1, where the cells commit to enter another
21
cell cycle (Ma HT and Poon RYC, 2011). DNA replication occurs in the S (synthesis) phase preceding G2 (Gap2) phase (Vermeulen K et al., 2003).
The quality control mechanisms of the cell cycle are located all through the process. DNA damage checkpoints take place before entering the S phase (G1-S checkpoint), after the duplication of DNA (G2-M checkpoint) and also during S and M phases (Dipaola RS, 2002; Vermeulen K et al., 2003). M phase checkpoints detect malformed spindle assemblies and incorrect spindle alignments (Okada H and Mak TW, 2004). For the induction of S phase arrest, ataxia-telangiecstasia-mutated (ATM)-mediated phosphorylation of Nijmegen breakage syndrome 1 (NBS1) is required (Lim DS et al., 2000). If the genes involved in the induction of mitotic catastrophe are faulty, tumor formation can be accelerated. These genes encode the protein kinases regulating the cell cycle (Okada H and Mak TW, 2004). In response to DNA damage, ATM and ATM-and Rad3-related (ATR) get activated in order to initiate a kinase cascade. Finally, CDK1, the chief conductor of M phase, become inactivated leading to G2/M arrest (Dipaola RS, 2002).
Another important regulator of the cell cycle is the retinoblastoma gene product (Rb). In its active form, Rb, the tumor suppressor gene, is hypophosphorylated and forms an inhibitory complex with transcription factor, E2F-DP (E2F-1, E2F-2, and E2F-3). Hyperphosphorylation of Rb by CDK2, CDK4 and CDK6 inactivates Rb and releases E2F-DP. Initiation of the transcription of various S phase proteins facilitates the G1-S transition (Schwartz GK and Shah MA, 2005).
1.2.1.9 Cyclin-dependent kinases (CDKs):
Cyclin-dependent kinases (CDKs) are fundamental regulators of cell cycle. They belong to the Ser/Thr kinase family and are active during the cell cycle if associated with cyclins. Although CDK levels remain constant, their activating proteins, cyclins, fluctuate as the cell cycle proceeds (Vermeulen K et al., 2003). Cell cycle phase-specific assembly of CDK-cyclin complex depends on the
22
accurate completion of the preceding step; namely, cell cycle checkpoints (Knockaert M et al., 2002).
1.2.1.10 Cyclin-dependent kinase inhibitors (CKIs):
In addition to cyclins, two distinct families of CKIs also regulate the activity of CDKs. The INK4 family members p15 (INK4b), p16 (INK4a), p18 (INK4c) and p19 (INK4d) negatively regulates the G1-specific CDKs, CDK4 and CDK6. The Cip/Kip family includes p21 (Waf1, Cip1), p27 (Cip2) and p57 (Kip2), general inhibitors of CDK-cyclin complex (Denicourt C and Dowdy SF, 2004; Cánepa ET et al.,2007).
1.3 Hepatocellular carcinoma (HCC):
Liver is the second largest organ after skin and that makes it the largest internal organ in human. It has a distinguishing blood supply coming directly not only from the heart but also from the digestive tract. Corresponding to its superior physical features, liver is a vital organ responsible homeostasis of human body. The majority of the cells in liver are hepatocytes, macrophages (Kupffer cells) and stellate cells (fat-storing cells). In a healthy liver stellate cells store vitamin A, preserve the liver membrane; most importantly stay inactive. In case of liver injury, they become activated; thus, use their vitamin A stocks to produce fibrous scar tissue. The accumulation of the scar tissue, leads to liver diseases depending on its severity (Kolios G et al., 2006). Although it was a controversial issue formerly, now it is accepted that liver contains progenitor stem cells. In cases of chronic and severe liver injuries, a subgroup of liver cells (oval cells) is induced not only to proliferate but also to differentiate according to conditions (Qin AL et al., 2004).
Benign growths in liver, which do not transform into cancer, are a common issue. They can be treated with or without surgery successfully; whereas, liver cancer treatment options are limited and mostly palliative (Lau WY and Lai EC, 2008). The major type of primary liver cancer, Hepatocellular carcinoma (HCC),