ISSN Print: 1560–8530; ISSN Online: 1814–9596 12–059/ZIP/2012/14–4–590–594
http://www.fspublishers.org
Full Length Article
Prediction of Body Weight from Testicular and Morphological
Characteristics in Indigenous Mengali Sheep of Pakistan using
Factor Analysis Scores in Multiple Linear Regression Analysis
MOHAMMAD MASOOD TARIQ, ECEVIT EYDURAN1†, MASROOR AHMAD BAJWA, ABDUL WAHEED‡, FARHAT
IQBAL¶ AND YASIR JAVED
Center for Advanced Studies in Vaccinology and Biotechnology (CASVAB), University of Balochistan, Quetta, Balochistan, Pakistan
†Biometry Genetics Unit, Department of Animal Science, Faculty of Agriculture, Iğdır University, 76000, Iğdır, Turkiye †Faculty of Veterinary Science, Bahauddin Zakariya University, Multan, Pakistan
¶Department of Statistics, University of Balochistan, Quetta, Pakistan
1Corresponding author’s e-mail: [email protected]
ABSTRACT
The objective of the investigation was to predict body weight (BW) from testicular and morphological characteristics of the indigenous Mengali Sheep in Balochistan, Pakistan. The characteristics recorded were: body weight (BW), testicular length (TL), scrotal length (SL), scrotal circumference (SC), body length (BL), withers height (WH) and heart girth (HG) of 107 indigenous Mengali sheep in age range of 12 to 48 months. Only multiple linear regression analysis fitting to the available data showed tendency to multicollinearity problem with VIF >10 and didn’t present optimal solutions. With the purpose of removing the multicollinearity problem and especially making more correct interpretation biologically, the data were exposed to a combination of Factor and Multiple Linear Regression analyses. The appropriateness of factor analysis for the current data was determined by using criteria such as Kaiser-Meyer Olkin (KMO) measure of sampling adequacy and Bartlett’s test of spherity. These criteria showed that the data were appropriate for the factor analysis, one of the multivariate statistical analysis techniques. Thereafter, the factor analysis was applied to explanatory variables in order to derive new-uncorrelated latent explanatory variables from the variables. In the factor analysis, three new latent variables whose eigenvalues were greater than one were considered as explanatory variable for multiple linear regression analysis. Results obviously illustrated that 79.1% of variation in body weight was effectively explained by these new latent explanatory variables. Consequently, if confirmed at genetic level, the testicular and body traits might provide a significant contribution in the genetic improvement of the body weight of the indigenous Mengali for sheep breeding. © 2012 Friends Science Publishers
KeyWords:Factoranalysis;Multiplelinearregressionanalysis;Indigenousmengalisheep;Multicollinearity;Varimaxrotation
INTRODUCTION
An assessment of indigenous sheep breeds is significant in terms of germplasm conservation of a country. In the indigenous sheep breeding, the identification of multivariate relationships among age, body weight, testicular characteristics and body measurements is necessary for selecting better animals with the aim of gaining more genetic progress on reproductive yield. Among, testicular characteristics, scrotal circumference and length, and testicular length and diameter, which are influenced by age, body weight and seasonal changes were considered to be indirect selection criteria for more genetic progress in fertility (Karakus et al., 2010; Khan et al., 2010). There is a clear evidence that highly significant relationships between pairs of these more heritable testicular traits were
reported in some studies (Bilgin et al., 2004) and especially in a previous report, the existence of strong relationships between sperm quality and testicular traits was particularly pointed out in the literature (Blockey, 1980). Karakus et al. (2010) determined that, the best non-linear functions describing relationship between each testicular trait-time in Norduz lambs at young age were Logistic (with 3 parameters) and Richards’s models. Confirming these studies, Salhab et al. (2001) and Karakus et al. (2010) also underlined the significant effects of age and body weight on testicular traits with the multiple linear regression analysis, which is used to identify the relationship of body weight with some body measurements, prone to multicollinearity problem. One of the most effective methods to remove the problem is to use factor analysis scores for multiple regression analysis in different species as reported by many
MORPHOLOGICAL CHARACTERISTICS IN INDIGENOUS MENGALI SHEEP / Int. J. Agric. Biol., Vol. 14, No. 4, 2012
authors (Keskin et al., 2007a, b; Cankaya et al., 2009; Eyduran et al., 2009; Ogah et al., 2009; Sangun et al., 2009; Yakubu, 2009; Eyduran et al., 2010).
Body measurements as indicators of breed standards (Pesmen & Yardımcı, 2008) provide great convenience for the prediction of body weight without weighbridges (Afolayan et al., 2006; Adeyinka & Mohammed, 2006; Yakubu, 2009). In recent years, there have been a growing number of reports on the prediction of body weight from a variety of body traits measured at different growth periods of sheep (Riva et al., 2004; Afolayan et al., 2006; Kunene et
al., 2009; Cam et al., 2010a) and goat (Gül et al., 2005;
Khan et al., 2006; Moaeen-ud-Din et al., 2006; Rahman, 2007; Cam et al., 2010b). Recently, Tariq et al. (2011) made a detailed study on several morphological, fertility and growth traits for Mengali sheep in Pakistan. However, no available work in the literature is on the definition of complex relationships among age, body weight, testicular and body measurements using a combination of factor analysis with multiple linear regression analysis. Hence, the aim of this investigation was to develop a functional model identifying the multivariate-complex association among age, body weight, testicular and body measurements using factor analysis and Multiple Linear Regression Analysis jointly on indigenous Mengali sheep of the Balochistan, Pakistan.
MATERIALS AND METHODS
The study was conducted on 107 indigenous Mengali sheep male lambs born at the Experimental Station, Centre for Advanced Studies in Vaccinology and Biotechnology (ESC), University of Balochistan, Quetta, Pakistan. Morphological data about testicular measurements [testicular length (TL), scrotal length (SL) and scrotal circumference (SC)] and body measurements (body length (BL), withers height (WH) and heart girth (HG) and body weight (BW) at different ages ranging of 12 to 48 months were collected for predicting body weight of the indigenous Mengali sheep in the current study.
In general, multiple linear regression analysis model (Erturk & Tatlidil, 2010) can be written as:
BW=a+b1SC+b2SL+b3TL+b4BL+b5WH+b6HG+e
However, use of factor scores together with multiple linear regression analysis is recommended for removing multicollinearity problem.
The appropriateness of factor analysis was determined with Kaiser-Meyer-Olkin (KMO) measure of sampling adequacy and Bartlett's test of sphericity (Sharma, 1996).
The basic factor analysis equation in matrix form can be written as:
Z = λF + ε
Where Z is a px1 vector of variables, λ is a pxm matrix of factor loadings, F is an mx1 vector of factors and ε is a px1 vector of error or residual factors (Sharma, 1996).
As a result of the differences in the units of variables for factor analysis, the variables were standardized and eigenvalues were estimated by a correlation matrix of variables. VARIMAX rotation was utilized for facilitating interpretation of factor loadings (Lik). Factor coefficients
(Cik) were used to obtain factor scores for the selected
factors in the factor analysis. Factors eigenvalues greater than 1 were included in multiple regression analysis (Tabachnick & Fidell, 2001).
Score values corresponding to the chosen factors were used as explanatory variables to predict body weight of the indigenous Mengali sheep. The multiple linear regression equation for fitting standardized body weight and the following factor score equation can be formulated as below:
BW = a + b1FS1 + b2FS2 + b3FS3 + e
Where a, regression constant (it is the value of intercept & its value is zero); b1, b2 and b3 are regression
coefficients of Factor Scores (FS). FS is factor score and e is the error term. The significance of regression coefficients (intercept & slopes) were tested using a t-statistic. The quality criteria of the multiple regression analysis were determined with the help of the coefficient of determination (R2) and Mean Square Error (MSE) (Eyduran et al., 2009;
Sakar et al., 2011).
In order to estimate body weight of the indigenous Mengali sheep, the current data were analyzed using factor scores in multiple regression analysis. The effectiveness of multiple regression analysis explaining variation in body weight of the indigenous Mengali sheep was determined using determination coefficient (R2) and Root of Mean
Square Error (RMSE) and Variance Inflation Factor (VIF), as an indicator of multicollinearity. The VIF is an index, which measures how much the variance of a coefficient is enlarged due to collinearity. For a reliable multiple linear regression analysis, VIF for all the independent variables should be less than 10 (Karakus etal., 2010; Eyduran et al., 2012).
All the statistical evaluations were performed with MINITAB statistical package program. (www.minitab.com).
RESULTS
Definition of breed traits in a sheep breed is of great importance in the determination of genetically superior animals in selection programs to be conducted for breeding purposes. Generally, knowledge on the relationships among these breed traits plays a significant role in respect of improving selection effectiveness. In the current study, Pearson correlation coefficients between age, testicular and morphological traits of indigenous Mengali sheep were calculated (Table I). All the positive correlation coefficients among these traits were statistically significant at significance level of 0.01.
Multiple linear regression analysis was fitted to the current data with the purpose of predicting body weight from testicular and morphological traits in the indigenous Mengali sheep. A severe Multicollinearity problem was observed for the multiple linear regression analysis, because of very strong correlation coefficients and high VIF values (data not shown). Thus, it has produced much higher standard errors for regression coefficients than expected in the multicollinearity problem.
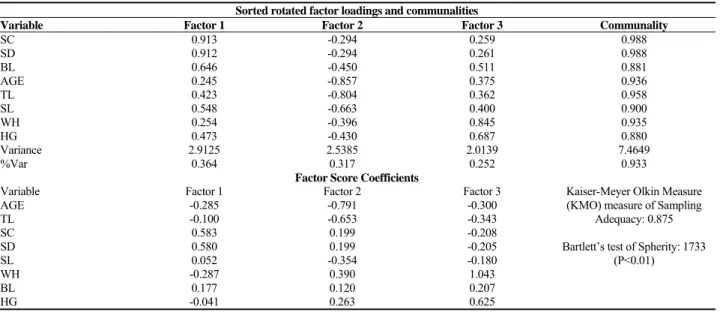
For the prediction of body weight in the indigenous Mengali sheep, factor analysis scores in the multiple regression analysis was applied to the current data, as a superior alternative to remove multicollinearity problem being observed in multiple regression analysis, path analysis and canonic correlation analysis. With the exception of body weight as a dependent variable; all other explanatory variables were firstly exposed to factor analysis, a multivariate analysis technique. The values on factor score coefficients, rotated factor loadings and communalities obtained in the result of factor analysis with VARIMAX rotation are depicted in Table II. Results of Kaiser-Meyer Olkin Measure (KMO) measure of Sampling Adequacy Bartlett’s test of Spherity illustrated that factor analysis was appropriate for the current data (Table II). Number of the most suitable factor for the explanatory variables in factor analysis applied was determined as 3 with magnitude of eigenvalues. In other words, the 3 uncorrelated latent variables (FS1, FS2 & FS3) whose eigenvalues were greater than one in the factor analysis were derived from the explanatory variables under the investigation. The explained variation by the explanatory three latent variables in the factor analysis was a proportion of 93.3%. The variations explained by Factors 1, 2, and 3 were 0.364, 0.317 and 0.252, respectively. Very high communality values were obtained in the factor analysis for all the explanatory variables. Factor producing the highest factor loading for an explanatory variable was the best factor for this variable. For example, SC, SD and BL among the explanatory variables with high correlations of 0.913, 0.912 and 0.646 provided significant contribution to the composition of Factor 1. Similarly, AGE, TL and SL were the variables that statistically made a greater contribution to Factor 2
compared to the rest. In a similar way, WH and HG also contributed in a considerable amount to Factor 3.
Thereafter, as a result of a combination of factor analysis and multiple linear regression analysis, reliable-unbiased regression coefficients were estimated by removing the multicollinearity problem. Table III illustrates the results of multiple regression analysis with new-explanatory (three latent) variables from factor analysis and body weight (dependent variable) standardized with its own average and standard deviation values. As shown in Table III, 79.1% of variation in body weight was explained by three latent variables, FS1, FS2 and FS3, statistically significant, respectively (P<0.01). As expected biologically, body weight increased with increasing FS1, FS2, and FS3, respectively. In Table II, FS1 was positively-highly correlated with SC, SD and BL. In the same way, Pearson correlations of FS3 with WH and HG were positively found. Mathematically, signs (negative) of Pearson correlation coefficients between FS2 with AGE, TL and SL considerably contributing to Factor 2 (Table II) showed similar tendency with the sign (negative) of regression coefficients of FS2 with Table III. When Tables II and III were taken into consideration, statistical analysis results reflected that, body weight would increase with increasing quantitative traits like SC, SD, BL, AGE, TL, SL, WH and HG, respectively.
DISCUSSION
Sheep with high values in respect to SC, SD, BL, AGE, TL, SL, WH and HG were more likely to have high values in body weight. This may also be attributed to the nature of growth-development in sheep, depending upon genetic and environmental factors.
Present results illustrated that 79.1% of variation in body weight was explained by three latent variables, FS1, FS2 and FS3, which were statistically significant. The results were supported by a previous study on Muscovy Duck, where Ogah et al. (2009) observed 84.2% and 63.5% total variation in body weight using various morphological measurements for both male and female ducks, respectively. Sangun et al. (2009) explained 98.4% of variation in body weight from several body measurements in Lizardfish with three latent variables. The explained variation of 75.4% for milk yield using four latent variables derived from some udder traits was reported by Keskin et al. (2007a). In the prediction of carcass weight by three latent variables obtained from body measurements, 83.9% R2 was found in multiple regression analysis (Keskin et al., 2007b). In a previous study about factor and multiple regression analysis conducted to examine relationship between carcass weight and six body measurements (live weight, body length, breast circumference, thigh circumference, shank length & wing length) of 8-weeks old Arbor Acre broiler chickens in a sub-humid environment of Nigeria, Yakubu (2009) revealed that, in the varimax rotated factor analysis, two selected Table I: Pearson correlation coefficients between pairs
of all traits BW AGE TL SC SD SL WH BL AGE 0.933 TL 0.809 0.894 SC 0.544 0.587 0.716 SD 0.546 0.589 0.716 0.999 SL 0.721 0.797 0.913 0.786 0.787 WH 0.677 0.712 0.745 0.585 0.587 0.752 BL 0.699 0.733 0.813 0.826 0.827 0.839 0.738 HG 0.741 0.759 0.781 0.727 0.728 0.797 0.793 0.842 TL: Testicular Length, SL: Scrotal Length, SC:Scrotal Circumference, BL: Body Length,
WH: Withers Height, HG: Heart Girth, BW: Body Weight **All the correlations were significant (P<0.01)
MORPHOLOGICAL CHARACTERISTICS IN INDIGENOUS MENGALI SHEEP / Int. J. Agric. Biol., Vol. 14, No. 4, 2012
factors from six independent variables explained 87.53% of the total variability in the body measurements of the chickens. In Norduz lambs, Eyduran et al. (2009) successfully predicted weaning weight (WW) using six body measurements (withers height, body length, chest circumference, leg circumference, body depth & width of chest behind shoulders) measured at weaning period by factor scores in multiple regression model. They found approximately 80% of variation in weaning weight with three latent variables. Eyduran et al. (2010) mentioned that 74.2% and 60.2% of total variation were explained for male and female trout in body weight from several biometrical traits viz. total and fork lengths, body height, head length, adipose fin width and adipose fin length of Salmo trutta
fario trouts. Similarly, Cankaya et al. (2009) conducted a
study with the intention of predicting weaning weight from several body measurements (height at withers, height at rump, body length, chest girth & depth, middle & hind rump width & chest width), at the weaning period from a total of 101 Karayaka lambs and reported that 73.1% of variation in weaning weight was explained with the five uncorrelated latent variables. In the current study, model developed could be sufficient with 79.1% accuracy to explain body weight of the indigenous Mengali sheep. Additionally, in the literature, no available work exists on use of factor analysis in multiple regression analysis to predict body weight from AGE, SC, SD, BL, AGE, TL, SL, WH and HG in the
indigenous Mengali sheep. However, this finding with the explained variation of 79.1% obtained in the current study was practically in agreement with some of previous works published on various animal species and breeds (Keskin et
al., 2007a & b; Cankaya et al., 2009; Eyduran et al., 2009;
Ogah et al., 2009; Eyduran et al., 2010), but higher than the variation proportion mentioned by some authors in various publications (Ogah et al., 2009; Yakubu, 2009; Sangun et
al., 2009). The current finding on getting rid of the
multicollinearity using joint factor analysis scores in the multiple linear regression analysis definitely supported those reported by the above mentioned authors. These differences may be ascribed to the combined effect of genetic (various rearing systems) and environmental factors, and especially different statistical methods and morphological traits used in all previous studies.
CONCLUSION
In the identification of multivariate relationships among body weight, testicular and morphological traits, compared to only multiple linear regression analysis; the current model, using factor scores together with multiple linear regression analysis was a better alternative approach from the point of removing multicollinearity problem with 79.1 R2 (%) explained for body weight. In conclusion, if
verified at genetic level, the current results on these Table II: Factor analysis results applied for explanatory variables
Sorted rotated factor loadings and communalities
Variable Factor 1 Factor 2 Factor 3 Communality
SC 0.913 -0.294 0.259 0.988 SD 0.912 -0.294 0.261 0.988 BL 0.646 -0.450 0.511 0.881 AGE 0.245 -0.857 0.375 0.936 TL 0.423 -0.804 0.362 0.958 SL 0.548 -0.663 0.400 0.900 WH 0.254 -0.396 0.845 0.935 HG 0.473 -0.430 0.687 0.880 Variance 2.9125 2.5385 2.0139 7.4649 %Var 0.364 0.317 0.252 0.933
Factor Score Coefficients
Variable Factor 1 Factor 2 Factor 3 Kaiser-Meyer Olkin Measure (KMO) measure of Sampling
Adequacy: 0.875 Bartlett’s test of Spherity: 1733
(P<0.01) AGE -0.285 -0.791 -0.300 TL -0.100 -0.653 -0.343 SC 0.583 0.199 -0.208 SD 0.580 0.199 -0.205 SL 0.052 -0.354 -0.180 WH -0.287 0.390 1.043 BL 0.177 0.120 0.207 HG -0.041 0.263 0.625
TL: Testicular Length, SL: Scrotal Length, SC:Scrotal Circumference, BL: Body Length WH: Withers Height, HG: Heart Girth, BW: Body Weight
Table III: Result of Multiple linear regression analysis for latent variables
Predictor Coefficient SE coeff t P VIF
FS1 0.22331 0.04502 4.96 0.000 1.0
FS2 -0.76132 0.04502 -16.91 0.000 1.0
FS3 0.40220 0.04502 8.93 0.000 1.0
morphological traits might permit obtaining desirable genetic improvement in the body weight for sheep breeding.
REFERENCES
Adeyinka, I.A. and I.D. Mohammed, 2006. Relationship of liveweight and linear body measurement in two breeds of goat of Northern Nigeria.
J. Anim. Vet. Adv., 5: 891–893
Afolayan, R.A., I.A. Adeyinka and C.A.M. Lakpini, 2006. The estimation of live weight from body meauserements in Yankasa sheep. Czech J.
Anim. Sci., 51: 343–348
Bilgin, O.C., E. Emsen and M.H. Davis, 2004. Comparison of non-linear models for describing the growth of scrotal circumference in Awassi male lambs. Small Rum. Res., 52: 155-160
Blockey, M.A., 1980. Getting the most out of rams and boars. Proc. Aust.
Soc. Anim. Prod., 13: 46
Cam, M.A., M. Olfaz and E. Soydan, 2010a. Posibilities of using morphometrics characteristics as a tool for body weight production in Turkish hair goats (Kilkeci). Asian J. Anim. Vet. Adv., 5: 52–59 Cam, M.A., M. Olfaz and E. Soydan, 2010b. Body measurements reflect
body weights and carcass yields in Karakaya sheep. Asian J. Anim.
Vet. Adv., 5: 120–127
Cankaya, S., A. Altop, E. Kul and G. Erener, 2009. Body weight estimation in Karayaka lambs by using factor analysis scores. Anadolu J. Agric.
Sci., 24: 98–102
Erturk, Y.E. and F. Tatlidil, 2010. The effect of the quality assurance systems certificates on the purchasing behaviors of consumers. 5th Central European Congress on Food. 19th-22nd May 2010,
Bratislava, Slovakia
Eyduran, E., K. Karakus, S. Karakus and F. Cengiz, 2009. Usage of factor scores for determining relationships among body weight and body measurements. Bulgarian J. Agric. Sci., 15: 374–378
Eyduran, E., M. Topal and A.Y. Sonmez, 2010. Use of factor scores in multiple regression analysis for estimation of body weight by several body measurements in brown trouts (Salmo trutta fario). Int. J.
Agric. Biol., 12: 611–615
Eyduran, E., M. Topal, A.Y. Sonmez and S. Keskin, 2012. Carcass weight estimation from some morphological traits of Capoeta capoeta capoeta (Güldenstädt, 1772) using factor scores in multiple regression analysis. Pakistan J. Stat., 28: 159–165
Gül, S., Ö. Görgülü, M. Keskin, O. Bicer and A. Sarı, 2005. Some production equations of live weight from diffrent body measurements in Shami (Damascus) goats. J. Anim. Vet. Adv., 4: 532–534
Karakus, K., E. Eyduran, T. Aygun and K. Javed, 2010. Appropriate growth model describing some testicular characteristics in Norduz male lambs. J. Anim. Plant Sci., 20: 1–4
Keskin, S., A. Kor and S. Karaca, 2007a. Use of factor analysis scores in multiple linear regression model for determining relationships between milk yield and some udder traits in Goats. J. Appl. Anim.
Res., 31: 185–188
Keskin, S., I. Daskiran and A. Kor, 2007b. Factor analysis scores in a multiple linear regression model for the prediction of carcass weight in Akkeci kids. J Appl. Anim. Res., 31: 201–204
Khan, H., F. Muhammad, R. Ahmad, G. Nawaz, G. Rahimullah and M. Zubair, 2006. Relationship of body weight with linear body measurements in goat. J. Agric. Biol. Sci., 1: 51–54
Khan, R.U., F.R. Durrani, N. Chand and H. Anwar, 2010. Influence of feed supplementation with Cannabis sativa on quality of broilers carcass.
Pakistan Vet. J., 30: 34–38
Kunene, N.W., A.E. Nesamvuni and I.V. Nsahlai, 2009. Determination of prediction equations for estimating body weight of Zulu (Nguni) sheep. Small Rumin. Res., 84: 41–46
Moaeen-ud-Din, M., N. Ahmad, A. Iqbal and M. Abdullah, 2006. Evaluation of different formulas for weight estimation in beetal, teddi and crossbred (beetal x teddi) goats. J. Anim. Plant Sci., 16: 3–4 Ogah, D.M., A.A. Alaga and M.O. Momoh, 2009. Use of factor analysis
scores in multiple regression model for estimation of body weight from some body measurement in Muscovy duck. Int. J. Poult. Sci., 8: 1107–1111
Pesmen, G. and Y. Yardımcı, 2008. Estimating the live weight using some body measurements in Saanen goats. Arch. Zootechnica, 11: 30–40 Rahman, F., 2007. Prediction of carcass weight from the body
characteristics of black Bengal goats. Int. J. Agric. Biol., 9: 431–434 Riva, J., R. Rizzi, S. Marelli and L.G. Cavalchini, 2004. Body measurements
in Bergamasca sheep. Small Rumin. Res., 55: 221–227
Sakar, E., S. Keskin and S. Unver 2011. Using of factor analysis scores in multiple linear regression model for prediction of kernel weight in Ankara walnuts. J. Anim. Plant Sci., 21: 182–185
Salhab, S.A., M. Zarkawi, M.F. Wardeh, M.R. Al-Masri and R. Kassem 2001. Development of testicular dimensions and size and their relationship to age, body weight and parental size in growing Awassi ram lambs. Small Rum. Res., 40: 187–191
Sangun, L., S. Cankaya, G.T. Kayaalp and M. Akar, 2009. Use of factor analysis scores in multiple regression models for estimation of body weight from some body measurements in Lizardfish. J. Anim. Vet.
Adv., 8: 47–50
Sharma, S., 1996. Applied Multivariate Techniques. John Wiley and Sons, Inc., New York, USA
Tariq, M.M., M.A. Bajwa, F. Abbas, E. Eyduran, M.A. Awan, M. Rafeeq, A. Waheed, A. Hussain, F.A. Bukhari, M.A. Attiq, Z. Ahmad and Y. Javed, 2011. Some morphological, fertility and growth traits for Mengali sheep of Balochistan, Pakistan. Iğdır Univ. J. Inst. Sci.
Tech., 1: 63–68
Tabachnick, B.G. and L.S. Fidell, 2001. Using Multivariate Statististics. Allyn and Bacon Pearson Education Company, Boston Massachusetts, USA
Yakubu, A., 2009. Fixing collinearity instability in the estimation of body weight from morpho-biometrical traits of West African dwarf goats.
Trakia J. Sci., 7: 61–66