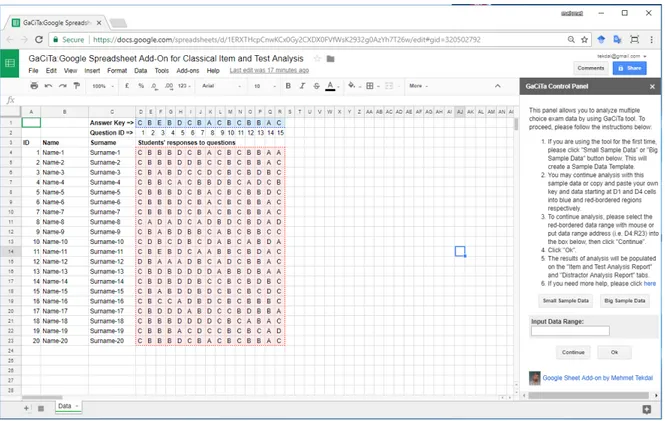
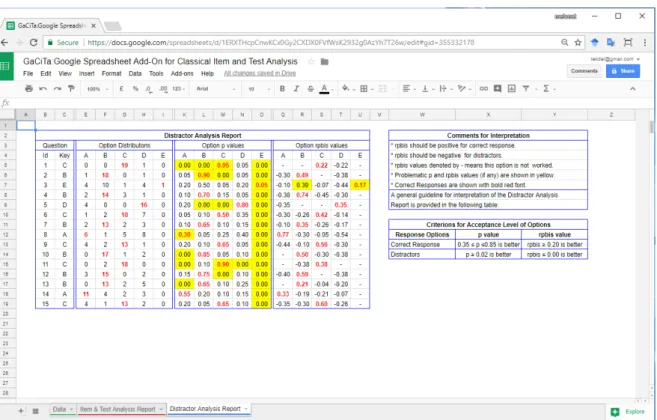
GaCiTa -The Google spreadsheet add-on for classical ıtems and test analysis: development and evaluation study
Tam metin
Şekil
Benzer Belgeler
Beliefs about being a donor includedreasons for being a donor (performing a good deed, being healed, not committing a sin), barriers to being a donor (beingcriticized by others,
Sayılan unsurları kapsayacak şekilde blok zinciri teknolojisi temelinde gerçekleşen muhasebe uygulamalarının bahsedilen dağıtık defter yapısı, geleneksel anlamda
"CURRENT FINANCIAL ANALYSIS OF BOTH COMPANIES BEKO A.S AND BSH A.SAND THEIR CURRENT FINANCIAL POSITIONS IN COMPARISON IN THE MARKET TURKEY"..
The developed system is Graphical User Interface ( MENU type), where a user can load new speech signals to the database, select and play a speech signal, display
Thermocouples are a widely used type of temperature sensor for measurement and control and can also be used to convert a temperature gradient into electricity.. Commercial
Svetosavlje views the Serbian church not only as a link with medieval statehood, as does secular nationalism, but as a spiritual force that rises above history and society --
It shows us how the Kurdish issue put its mark on the different forms of remembering Armenians and on the different ways of making sense of the past in a place
One of the wagers of this study is to investigate the blueprint of two politico-aesthetic trends visible in the party’s hegemonic spatial practices: the nationalist
