CERN-EP-2018-230 2019/02/05
CMS-B2G-17-018
Search for single production of vector-like quarks decaying
to a top quark and a W boson in proton-proton collisions at
√
s
=
13 TeV
The CMS Collaboration
∗Abstract
A search is presented for the single production of vector-like quarks in proton-proton collisions at √s = 13 TeV. The data, corresponding to an integrated luminosity of 35.9 fb−1, were recorded with the CMS experiment at the LHC. The analysis focuses on the vector-like quark decay into a top quark and a W boson, with one muon or electron in the final state. The mass of the vector-like quark candidate is reconstructed from hadronic jets, the lepton, and the missing transverse momentum. Methods for the identification of b quarks and of highly Lorentz boosted hadronically decaying top quarks and W bosons are exploited in this search. No significant deviation from the standard model background expectation is observed. Exclusion limits at 95% con-fidence level are set on the product of the production cross section and branching frac-tion as a funcfrac-tion of the vector-like quark mass, which range from 0.3 to 0.03 pb for vector-like quark masses of 700 to 2000 GeV. Mass exclusion limits up to 1660 GeV are obtained, depending on the vector-like quark type, coupling, and decay width. These represent the most stringent exclusion limits for the single production of vector-like quarks in this channel.
Published in the European Physical Journal C as doi:10.1140/epjc/s10052-019-6556-3.
c
2019 CERN for the benefit of the CMS Collaboration. CC-BY-4.0 license
∗See Appendix A for the list of collaboration members
1
Introduction
The discovery of the Higgs boson (H) [1, 2] with a mass of 125 GeV completes the particle con-tent of the standard model (SM). Even though the SM yields numerous accurate predictions, there are several open questions, among them the origin of the H mass stability at the elec-troweak scale. Various models beyond the SM have been proposed that stabilise the H mass at the measured value; some examples are Little Higgs [3–5] or Composite Higgs models [6], in which additional top quark partners with masses at the TeV scale are predicted. Since the left-(LH) and right-handed (RH) chiral components of these particles transform in the same way under the SM electroweak symmetry group, they are often referred to as “vector-like quarks” (VLQs). In contrast to a fourth chiral quark generation, their impact on the H properties is small, such that VLQs have not been excluded by the measurements of H mediated cross sec-tions [7–9].
Several searches for VLQs have been performed at the CERN LHC, setting lower exclusion lim-its on the VLQ mass mVLQ[10–31]. Many of these analyses study the pair production of VLQs
via the strong interaction. In contrast, the analysis presented here searches for the single VLQ production via the weak interaction, where a hadronic jet is emitted at a low angle with respect to the beam direction. Furthermore, VLQs with enhanced couplings to the third generation quarks (i.e. VLQ B and X5/3 quarks with an electric charge of 1/3 and 5/3 respectively) are
produced in association with a bottom (b) or top (t) quark, leading to the B+b, B+t, and X5/3+t
production modes.
While a VLQ B quark could decay into the Hb, Zb, or tW final state, a VLQ X5/3 quark could
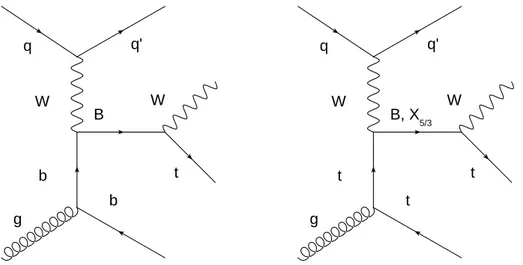
only decay into the tW final state. This search focuses on the tW final state. In Fig. 1, two leading-order (LO) Feynman diagrams are shown for the single production of B and X5/3 quarks and their decay into tW. This paper presents the first search of this signature in proton-proton (pp) collision data recorded at a centre-of-mass energy of 13 TeV. Results at√s =8 TeV have been obtained by the ATLAS collaboration [32].
Figure 1: Leading order Feynman diagrams for the production of a single vector-like B or X5/3
quark in association with a b (left) or t (right) and a light-flavour quark, and the subsequent decay of the VLQ to tW.
In this analysis, final states with a single muon or electron, several hadronic jets, and missing transverse momenta pmissT are studied. Because of the high mass of the VLQ, the t and W can have high Lorentz boosts, leading to highly collimated decays of the W boson, the top
quark and non-isolated leptons. For signal events, the mass of the B and X5/3 quarks can be
reconstructed using hadronic jets, the lepton, and the pmissT . The associated b and t, as well as the leptons originating from their decay, have much lower transverse momenta pTand are not
considered for the reconstruction or selection.
The dominant SM background processes are top quark pair (tt) production, W+jets and Z+jets production, single t production, and multijet production via the strong force. All SM back-grounds contributing to this search are predicted from dedicated control regions in data, de-fined through the absence of a forward jet.
This paper is organised as follows: Section 2 provides a description of the CMS detector. Sec-tion 3 introduces the data set and the simulated events. This is followed by the event selecSec-tion in Section 4, as well as by the description of the reconstruction of the VLQ mass in Section 5. In Section 6, a method to estimate the background is discussed. Systematic uncertainties are detailed in Section 7. The final results of the analysis, as well as the statistical interpretation in terms of exclusion limits, are discussed in Section 8.
2
The CMS detector and physics objects
The central feature of the CMS apparatus is a superconducting solenoid of 6 m internal diame-ter, providing a magnetic field of 3.8 T. Within the solenoid volume are a silicon pixel and strip tracker, a lead tungstate crystal electromagnetic calorimeter (ECAL), and a brass and scintilla-tor hadron calorimeter (HCAL), each composed of a barrel and two endcap sections. Forward calorimeters extend the pseudorapidity coverage provided by the barrel and endcap detectors. Muons are detected in gas-ionisation chambers embedded in the steel flux-return yoke outside the solenoid.
The particle-flow event algorithm [33] aims to reconstruct and identify each individual particle with an optimised combination of information from the various elements of the CMS detec-tor. The energy of photons is directly obtained from the ECAL measurement, corrected for zero-suppression effects. The energy of electrons is determined from a combination of the electron momentum at the primary interaction vertex, the energy of the corresponding ECAL cluster, and the energy sum of all bremsstrahlung photons spatially compatible with originat-ing from the electron track [34]. The energy of muons is obtained from the curvature of the corresponding track [35]. The energy of charged hadrons is determined from a combination of their momentum measured in the tracker and the matching ECAL and HCAL energy de-posits, corrected for zero-suppression effects and for the response function of the calorimeters to hadronic showers. Finally, the energy of neutral hadrons is obtained from the corresponding corrected ECAL and HCAL energy.
The reconstructed vertex with the largest value of summed physics-object p2T is taken to be the primary pp interaction vertex. The physics objects used are the jets, clustered with the jet finding algorithm [36, 37] with the tracks assigned to the vertex as inputs, and the associated missing transverse momentum, taken as the negative vector sum of the pTof those jets.
A more detailed description of the CMS detector, together with a definition of the coordinate system used and the relevant kinematic variables, can be found in Ref. [38].
3
Data and simulated samples
In this analysis, pp collision data at a centre-of-mass energy of 13 TeV taken in 2016 by the CMS experiment are analyzed. The data have been collected with muon and electron triggers [39]. For the muon trigger, a muon candidate with pT > 50 GeV is required. Data events in the
electron channel are collected using a logical combination of two triggers: the first requires an electron candidate with pT > 45 GeV and a hadronic jet candidate with pT > 165 GeV, the
second requires an electron candidate with pT >115 GeV. In the trigger selection, reconstructed
leptons and jets must be in the central part of the detector, with a pseudorapidity of|η| <2.4.
No lepton isolation criteria are applied at the trigger level. The collected data correspond to an integrated luminosity of 35.9 fb−1[40].
For the study of dominant SM background processes and for the validation of the background estimation, simulated samples using Monte Carlo (MC) techniques are used. The top quark pair production via the strong interaction and single top quark production in the t-channel, and the tW process are generated with the next-to-leading-order (NLO) generator POWHEG [41– 43] (version v2 is used for the first two and version v1 for the third). The event generator MADGRAPH5 aMC@NLO(v2.2.2) [44] at NLO is used for single top quark production in the s-channel. The W+jets and Z+jets processes are also simulated using MADGRAPH5 aMC@NLO
(v2.2.2). The W+jets events are generated at NLO, and the FXFX scheme [45] is used to match the parton shower emission. The Z+jets events are produced at LO with the MLM parton matching scheme [46]. The production of quantum chromodynamics (QCD) multijet events has been simulated at LO usingPYTHIA[47]. All generated events are interfaced withPYTHIA
for the description of the parton shower and hadronisation. The parton distribution functions (PDFs) are taken from the NNPDF 3.0 [48] sets, with the precision matching that of the ma-trix element calculations. The underlying event tune is CUETP8M1 [49, 50], except for the simulation of top quark pairs and single top quark production in the t-channel, which use CUETP8M2T4 [51].
Signal events are generated at LO using MADGRAPH5 aMC@NLO for B and X5/3 with VLQ
decay widths relative to the VLQ mass of(Γ/m)VLQ = 1, 10, 20, and 30%. The samples with 1% relative VLQ width are simulated in steps of 100 GeV for masses between 700 and 2000 GeV. Samples with 10, 20, and 30% relative VLQ widths are generated in steps of 200 GeV for masses ranging from 800 to 2000 GeV, using a modified version of the model proposed in Refs. [52–54]. Separate signal samples are generated for the two main production modes, in which VLQs are produced in association either with a b quark or with a t quark, viz. pp→ Bbq and pp→Btq. The theoretical cross sections for VLQ production are calculated using Refs. [55–57], where a simplified approach is used to provide a model-independent interpretation of experimental results for narrow and large mass width scenarios, as already used for the interpretation of singly produced vector-like T and B quarks [18, 19]. The MADSPIN package [58, 59] is used to retain the correct spin correlations of the top quark and W boson decay products. Interference effects between signal and SM processes have been found to be negligible in this analysis. All generated events are passed through a GEANT4 [60] based detector simulation of the CMS
detector. Additional pp interactions originating from the same bunch crossing (in-time pileup), as well as from the following or previous bunch crossings (out-of-time pileup) are taken into account in the simulation.
4
Event selection
The physics objects used in this analysis are muons, electrons, hadronic jets,~pTmiss, and ST,lep
(defined as the scalar sum of the lepton pTand pmissT ).
For each event, jets are clustered from reconstructed particles using the infrared and collinear safe anti-kT algorithm [36] with a distance parameter R = 0.4 (AK4 jet). Additionally, jets
with R = 0.8 (AK8 jet) are also clustered in every event with the anti-kTalgorithm, which are
used for t and W tagging. The jet clustering is performed with the FASTJET[37] package. Jet
momentum is determined as the vectorial sum of all particle momenta in the jet, and is found from simulation to be within 5–10% of the true momentum over the whole pT spectrum and
detector acceptance. Additional pp interactions within the same or nearby bunch crossings can contribute additional tracks and calorimetric energy depositions to the jet momentum. To mitigate this effect, tracks identified to be originating from pileup vertices are discarded, and an offset correction is applied to correct for remaining contributions. Jet energy corrections are derived from simulation studies so that the average measured response of jets becomes identical to that of particle level jets. In situ measurements of the momentum balance in dijet, photon+jet, Z+jet, and multijet events are used to account for any residual differences in the jet energy scale in data and simulation. Additional selection criteria are applied to each jet to remove jets potentially dominated by anomalous contributions from various subdetector components or reconstruction failures [61].
From the corrected and reconstructed AK4 jets, those are considered that have pT > 30 GeV
and|η| <4, while AK8 jets must have pT >170 GeV and|η| <2.4.
Events selected in the analysis are required to have one reconstructed muon or electron with pT > 55 GeV and|η| < 2.4. Electrons and muons are selected using tight quality criteria with
small misidentification probabilities of about 0.1% for muons and 1% for electrons [34, 62]. In the electron channel, a AK4 jet must have pT > 185 GeV and|η| <2.4 if the electron has pT <
120 GeV, reflecting the trigger selection. Events with more than one muon or electron passing the same tight identification criteria and having pT > 40 GeV and |η| < 2.4 are discarded.
Selected events contain two AK4 jets with pT > 50 GeV, which are in the central part of the
detector with |η| < 2.4. Additionally at least one AK8 jet is required. For the reconstruction
AK4 jets are used with pT >30 GeV and|η| <2.4, while the AK4 jets emitted close to the beam
pipe and employed in the background estimation must fulfill pT >30 GeV and 2.4< |η| <4.
Because of the high Lorentz boosts of the top quarks and W bosons from the heavy VLQ de-cay, signal events can have leptons in close vicinity to the jets. For this reason, standard lepton isolation would reduce the selection efficiency considerably. Therefore, for the suppression of events originating from QCD mulitjet processes, either the perpendicular component of the lep-ton momentum relative to the geometrically closest AK4 jet pT,rel, is required to exceed 40 GeV or the angular distance of the lepton to the jet, ∆R(`, jet) =
√
(∆η)2+ (∆φ)2, must be larger than 0.4, where φ is the azimuthal angle in radians. Furthermore, for selecting an event, the magnitude of~pTmisshas to be greater than 50 GeV in the muon channel and greater than 60 GeV in the electron channel. This requirement reduces the amount of background from multijet pro-duction. The final selection is based on the variable ST,lep, which is required to be larger than
250 GeV in the muon channel and 290 GeV in the electron channel.
Events are separated into categories exploiting the tagging techniques for boosted top quarks and W bosons decaying hadronically, as well as for hadronic jets originating from b quarks. Jets with R = 0.8 are used to identify the hadronic decays of highly boosted top quarks and W bosons [63, 64]. For top quark jets pT > 400 GeV is required, and for W boson jets the
requirement is pT > 200 GeV. The “soft drop” (SD) declustering and grooming algorithm [65,
66] with z = 0.1 and β =0 is employed to identify subjets and to remove soft and wide-angle radiation. The groomed jet mass, mSD, is used to identify top quark and W boson candidates.
Tagged top quark candidates (t tagged) are required to have 105< mSD< 220 GeV and one of
the subjets must fulfill the loose b tagging criterion, based on the combined secondary vertex (CSVv2) [67] algorithm. The loose criterion is defined to give a 80% efficiency of correctly identifying b jets, with a 10% probability of incorrectly tagging a light quark jet. Additionally, the jet must have a N-subjettiness [68, 69] ratio τ3/τ2 < 0.5 and its angular distance to the
lepton ∆R(`, t tag) must be larger than 2. Identified W boson candidates (W tag) must have 65 < mSD < 95 GeV. The medium b tag criterion is used on AK4 jets, defined to give a 60%
efficiency of correctly identifying b jets, with a 1% probability of incorrectly tagging a light quark jet.
Selected events are attributed to different mutually exclusive event categories. Events contain-ing at least one t tag constitute the first category (“t tag”). If no t tag is found, all events with at least one W tag are grouped into a second category (“W tag”). The remaining events are attributed to three further categories based on the multiplicity of b tags found in the event. We distinguish events with at least two (“≥2 b tag”), exactly one (“1 b tag”), and no b tag (“0 b tag”). These five categories are built separately in the muon and in the electron channel leading to a total of ten categories.
5
Mass reconstruction
Hadronic jets, leptons, and~pTmissare used to reconstruct the mass of the VLQ, denoted mreco. In
signal events, the lepton in the final state always originates from the decay of a W boson, either the W boson from the VLQ decay or the W boson from the top quark decay. The neutrino four-momentum can thus be reconstructed from the components of~pmiss
T , the W mass constraint,
and the assumption of massless neutrinos.
In the case when a hadronic jet with a t tag is found, mrecois calculated from the four-momentum
of the t-tagged jet and the four-momentum of the leptonically decaying W boson. If several hadronic jets with t tags are present, the one with the largest angular distance to the recon-structed leptonic W boson decay is used. Once the t-tagged jet has been selected, all overlap-ping AK4 jet jets in the event are removed in order to avoid double counting of energy. For the shown mrecodistributions these events form the t tag category. For events in the other
cate-gories the hadronic part of the VLQ decay is reconstructed from combinations of AK4 jets with
|η| < 2.4. Each possible jet assignment for the decays of the W boson and t quark is tested
exploiting the following χ2quantity
χ2 = (mt−mt) 2 σt2 + (mW−mW) 2 σW2 + (∆R(t, W) −π) 2 σ∆R2 + (pT,W/pT,t−1) 2 σp2T . (1)
For each event, the jet assignment with the maximum χ2 probability is selected. For the
χ2 quantity the pT balance, pT,W/pT,t, the angular distance, ∆R(t, W), and the reconstructed
masses of the top quark candidate mt and the W boson candidate mW are used. The expected
values mt and mW, and their standard deviations σtand σW are obtained from simulation for
correctly reconstructed events and it is verified that the values are independent of the VLQ mass. Here, correctly reconstructed events are defined by the assignment of jets to generated t quarks and W bosons, where the generated particles from the VLQ decay are unambiguously matched within a distance of∆R < 0.4 to the reconstructed particles. It was also verified in
[GeV]
recom
0 500 1000 1500 2000 2500 3000 3500 Events / 85 Gev 20 40 60 80 100 120 t tag category B+b, RH = 800 GeV B m = 1000 GeV B m = 1200 GeV B m = 1400 GeV B m = 1600 GeV B m (13 TeV) -1 35.9 fb channel µ CMSSimulation[GeV]
recom
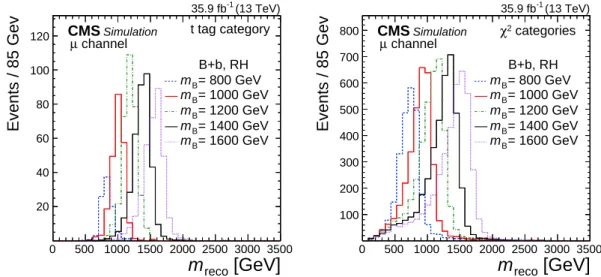
0 500 1000 1500 2000 2500 3000 3500 Events / 85 Gev 100 200 300 400 500 600 700 800 χ2 categories B+b, RH = 800 GeV B m = 1000 GeV B m = 1200 GeV B m = 1400 GeV B m = 1600 GeV B m (13 TeV) -1 35.9 fb channel µ CMSSimulationFigure 2: Distributions of mreco for the B+b production mode, obtained for simulated events
with a muon in the final state, reconstructed with a t tag (left) and with the χ2method (right) for right-handed VLQ couplings and various VLQ masses mB. Signal events are shown assuming
a production cross section of 1 pb and a relative VLQ decay width of 1%.
simulation that the expected values of ∆R(t, W) and the pT balance are π and 1, with their
standard deviations σ∆R and σpT. In order to account for cases where the W boson from the
VLQ decay decays into a lepton and neutrino, the χ2 is calculated for each permutation with
the second term omitted. Cases where the hadronic decay products of the W bosons or the top quark are reconstructed in a single AK4 jet are included by omitting the first or second term in the calculation of the χ2.
The distributions of mreco in simulation for the B+b production mode with right-handed
cou-plings are shown in Fig. 2 for events with a muon in the final state. The reconstruction of events with a t tag (left) is best suited for high VLQ masses where the decay products of the top quark are highly boosted, while the χ2 method (right) yields a stable performance for all
VLQ masses, where the decay products of the W boson and top quark are reconstructed from several jets. Additionally, the latter method enables the reconstruction of events with a lepton from the top quark decay chain. Mass resolutions between 10–15% are achieved for both re-construction methods, with peak values of the mreco distributions at the expected values. The
VLQs with left-handed couplings (not shown) have a lower selection efficiency by 20–25% be-cause of a smaller lepton pT, on average, but otherwise features a behaviour similar to VLQs
with right-handed couplings. Distributions obtained for the final states with an electron are similar to those with a muon.
6
Background estimation
The data sample obtained after the selection is then divided into a signal region with a jet in the forward region of the detector with 2.4< |η| <4.0 and a control region without such a jet.
The distribution of background processes in the signal region is estimated using the shape of the mreco distribution in the control region. Residual differences in the shapes of the mreco
dis-tributions between signal and control regions are investigated in each of the signal categories by using simulated SM events. Differences can arise from different background compositions in signal and control regions due to the presence of a forward jet. The observed differences are small, with average values of 10%, and are corrected for by multiplicative factors applied
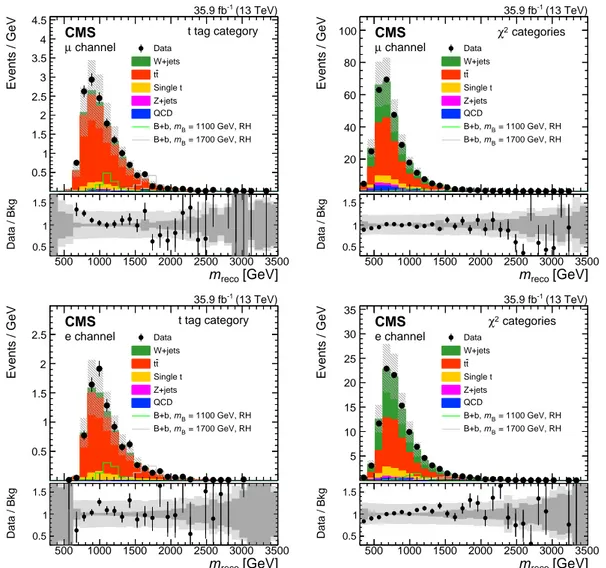
500 1000 1500 2000 2500 3000 3500 Events / GeV 0.5 1 1.5 2 2.5 3 3.5 4 4.5 t tag category Data W+jets t t Single t Z+jets QCD = 1100 GeV, RH B m B+b, = 1700 GeV, RH B m B+b, (13 TeV) -1 35.9 fb channel µ CMS [GeV] reco m 500 1000 1500 2000 2500 3000 3500 Data / Bkg 0.5 1 1.5 500 1000 1500 2000 2500 3000 3500 Events / GeV 20 40 60 80 100 χ2 categories Data W+jets t t Single t Z+jets QCD = 1100 GeV, RH B m B+b, = 1700 GeV, RH B m B+b, (13 TeV) -1 35.9 fb channel µ CMS [GeV] reco m 500 1000 1500 2000 2500 3000 3500 Data / Bkg 0.5 1 1.5 500 1000 1500 2000 2500 3000 3500 Events / GeV 0.5 1 1.5 2 2.5 t tag category Data W+jets t t Single t Z+jets QCD = 1100 GeV, RH B m B+b, = 1700 GeV, RH B m B+b, (13 TeV) -1 35.9 fb e channel CMS [GeV] reco m 500 1000 1500 2000 2500 3000 3500 Data / Bkg 0.5 1 1.5 500 1000 1500 2000 2500 3000 3500 Events / GeV 5 10 15 20 25 30 35 categories 2 χ Data W+jets t t Single t Z+jets QCD = 1100 GeV, RH B m B+b, = 1700 GeV, RH B m B+b, (13 TeV) -1 35.9 fb e channel CMS [GeV] reco m 500 1000 1500 2000 2500 3000 3500 Data / Bkg 0.5 1 1.5
Figure 3: Distributions of mreco in data and simulation in the control region for the muon
(up-per) and electron (lower) channels for events reconstructed with a t tag (left) and with the χ2 method (right). The VLQ signal is shown for the B+b production mode and right-handed VLQ couplings. The vertical bars illustrate the statistical uncertainties on the data, while the shaded area shows the total uncertainties for the background simulation. The lower panels show the ratio of data to the background prediction. The dark and light gray bands correspond to the statistical and total uncertainties, respectively.
to the background predictions in the validation and signal regions. The largest differences are observed for mrecovalues below 800 GeV, with values no larger than about 20%.
In order to validate the VLQ mass reconstruction, data are compared to simulation in the con-trol region. In Fig. 3 the distributions of mreco are shown in the muon (upper) and electron
(lower) channels for events with a t tag (left) and events reconstructed with the χ2 method (right). The tt and tW standard model processes provide irreducible backgrounds in the recon-structed VLQ mass distributions, showing good agreement between the data and simulation. The contribution of signal events in the control region is small and is taken into account by a simultaneous fit to signal and control regions in the statistical extraction of the results.
In order to validate the background estimation, a validation region is constructed from requir-ing events with reconstruction p-values smaller than 0.08. The p-values are calculated as the probability of obtaining the χ2as given by Eq. (1), where the number of degrees of freedom of
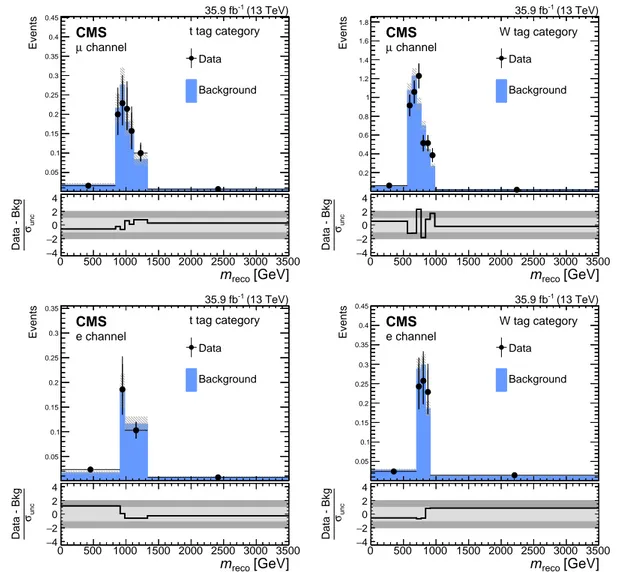
0 500 1000 1500 2000 2500 3000 3500 0.05 0.1 0.15 0.2 0.25 0.3 0.35 0.4 0.45 VLQ mass [GeV] VLQ mass [GeV] 0 500 1000 1500 2000 2500 3000 3500 Events 0.05 0.1 0.15 0.2 0.25 0.3 0.35 0.4 0.45 0 500 1000 1500 2000 2500 3000 3500 Events 0.05 0.1 0.15 0.2 0.25 0.3 0.35 0.4 0.45 t tag category Data Background (13 TeV) -1 35.9 fb channel µ CMS [GeV] reco m 0 500 1000 1500 2000 2500 3000 3500 unc σ Data - Bkg −−42 0 2 4 0 500 1000 1500 2000 2500 3000 3500 0.2 0.4 0.6 0.8 1 1.2 1.4 1.6 1.8 VLQ mass [GeV] VLQ mass [GeV] 0 500 1000 1500 2000 2500 3000 3500 Events 0.2 0.4 0.6 0.8 1 1.2 1.4 1.6 1.8 0 500 1000 1500 2000 2500 3000 3500 Events 0.2 0.4 0.6 0.8 1 1.2 1.4 1.6 1.8 W tag category Data Background (13 TeV) -1 35.9 fb channel µ CMS [GeV] reco m 0 500 1000 1500 2000 2500 3000 3500 unc σ Data - Bkg −−42 0 2 4 0 500 1000 1500 2000 2500 3000 3500 0.05 0.1 0.15 0.2 0.25 0.3 0.35 VLQ mass [GeV] VLQ mass [GeV] 0 500 1000 1500 2000 2500 3000 3500 Events 0.05 0.1 0.15 0.2 0.25 0.3 0.35 0 500 1000 1500 2000 2500 3000 3500 Events 0.05 0.1 0.15 0.2 0.25 0.3 0.35 t tag category Data Background (13 TeV) -1 35.9 fb e channel CMS [GeV] reco m 0 500 1000 1500 2000 2500 3000 3500 unc σ Data - Bkg 4 − 2 − 0 2 4 0 500 1000 1500 2000 2500 3000 3500 0.05 0.1 0.15 0.2 0.25 0.3 0.35 0.4 0.45 VLQ mass [GeV] VLQ mass [GeV] 0 500 1000 1500 2000 2500 3000 3500 Events 0.05 0.1 0.15 0.2 0.25 0.3 0.35 0.4 0.45 0 500 1000 1500 2000 2500 3000 3500 Events 0.05 0.1 0.15 0.2 0.25 0.3 0.35 0.4 0.45 W tag category Data Background (13 TeV) -1 35.9 fb e channel CMS [GeV] reco m 0 500 1000 1500 2000 2500 3000 3500 unc σ Data - Bkg 4 − 2 − 0 2 4
Figure 4: Distributions of mrecoin the validation region of the two most sensitive categories in
the muon channel (upper) and electron channel (lower). The lower panels show the difference of data and background expectations in units of the total (stat. and sys.) uncertainty on the background estimate.
the selected hypothesis are taken into account. For events with a t tag, the same χ2quantity is
evaluated for the selected hypothesis. The validation region has an order of magnitude fewer events than the signal region and a negligible amount of signal contamination. The mreco
dis-tributions for the two most sensitive categories are shown in Fig. 4 for the muon (upper) and electron (lower) channels. The observed number of events is found to be in good agreement with the predicted number of events from the background estimation in the validation region, with no statistically significant deviations. Similar observations are made for the other signal categories.
7
Systematic uncertainties
Systematic uncertainties can affect both the overall normalisation of background components and the shapes of the mrecodistributions for signal and background processes. The main
uncer-tainty in the shape of the mrecodistribution from the background estimation based on a control
Cor-rection factors are applied to account for this difference, obtained from SM simulations. These uncertainties have a size of 10% on average, with maximum values of 20% at small values of mreco. Compared to these uncertainties, the effects from uncertainties in the SM simulations are
negligible on the background estimation, as these cancel to a large degree when building the ratios between signal and control regions. The uncertainties in the overall normalisation of the background predictions are obtained from a fit to the data in the signal region.
Uncertainties in the MC simulation are applied to all simulated signal events. In the following, the systematic uncertainties are summarized.
• The uncertainty in the integrated luminosity measurement recorded with the CMS detector in the 2016 run at√s=13 TeV is 2.5% [40].
• The estimation of pileup effects is based on the total inelastic cross section. This cross section is determined to be 69.2 mb. The uncertainty is taken into account by varying the total inelastic cross section by 4.6% [70].
• Simulated events are corrected for lepton identification, trigger, and isolation effi-ciencies. The corresponding corrections are applied as functions of |η|and pT. The
systematic uncertainties due to these corrections are taken into account by varying each correction factor within its uncertainty.
• The scale factors for the jet energy scale and resolution are determined as functions of|η|and pT[61]. The effect of the uncertainties in these scale factors are considered
by varying the scale factors within their uncertainties. Jets with distance parameters of 0.4 and 0.8 are modified simultaneously. The results of variations for AK4 jets are propagated to the measurement of~pTmiss.
• The uncertainties due to the PDFs are evaluated by considering 100 replicas of the NNPDF 3.0 set according to the procedure described in Ref. [71]. The associated PDF uncertainties in the signal acceptance are estimated following the prescription for the LHC [71].
• Uncertainties associated with variations of the factorisation µf and renormalisation
scales µrare evaluated by varying the respective scales independently, by factors of
0.5 and 2.
• Corrections for the b tagging efficiencies and misidentification rates for AK4 jets, and subjets of AK8 jets are applied. These are measured as a function of the jet pT [67].
The corresponding uncertainties are taken into account by varying the corrections within their uncertainties for heavy- and light-flavour jets separately.
• An uncertainty on the t tagging efficiency of+7 and−4% is applied to signal events with a t tag [64]. The uncertainty on the W tagging efficiency is determined from jet mass resolution (JMR) and scale (JMS) uncertainties, which are added in quadrature. An additional JMR uncertainty is derived from the differences in the hadronisation and shower models ofPYTHIAandHERWIG++ [72]. The uncertainty depends on the
pTof the W boson; for VLQs with a mass of 700 GeV it is around 2% and for a mass
of 1800 GeV it is around 6%. An uncertainty of 1% is assigned to the JMS, as obtained from studies of the jet mass in fully merged hadronic W boson decays.
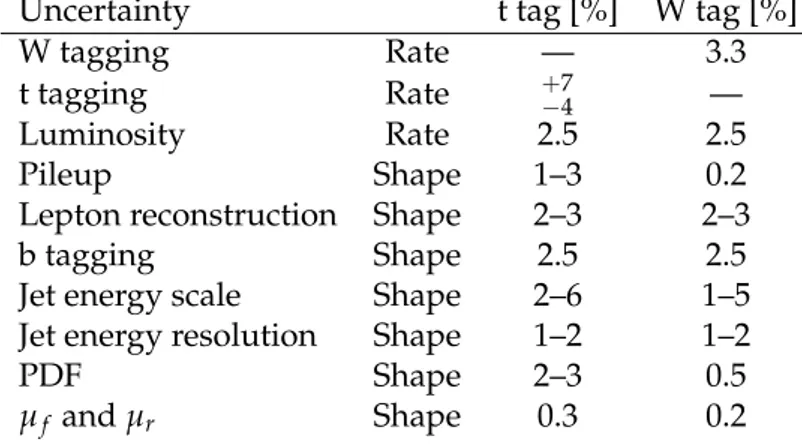
In Table 1, a summary of the uncertainties considered for signal events is shown, where the largest uncertainties come from the jet energy scale and the jet tagging. For the uncertainties connected to the PDF, µf and µr only the signal acceptance and shape differences are
propa-gated. The uncertainties with the largest impact on the analysis are the uncertainties associated with the data-driven background estimation, being more than two times larger than the jet
Table 1: Uncertainties considered for simulated signal events in the B+b production mode (mB=900 GeV) for right-handed VLQ couplings for the t tag and W tag categories. The
uncer-tainties in the b tag categories are of comparable size to those in the W tag category.
Uncertainty t tag [%] W tag [%]
W tagging Rate — 3.3
t tagging Rate +−74 —
Luminosity Rate 2.5 2.5
Pileup Shape 1–3 0.2
Lepton reconstruction Shape 2–3 2–3
b tagging Shape 2.5 2.5
Jet energy scale Shape 2–6 1–5
Jet energy resolution Shape 1–2 1–2
PDF Shape 2–3 0.5
µf and µr Shape 0.3 0.2
energy scale uncertainties in the signal.
8
Results
The mreco distributions in the ten categories are measured in the signal and control region,
which are defined by the presence or absence of a forward jet with |η| > 2.4. For the
back-ground estimate in the signal regions, a simultaneous binned maximum likelihood fit of both regions is performed using the THETA[73] package. In these fits, the signal cross section and the background normalisations in the different signal categories are free parameters. The shapes of the mreco distributions for the SM background in the signal regions are taken from the
cor-responding control regions. Systematic uncertainties are taken into account as additional nui-sance parameters. A common nuinui-sance parameter is used for uncertainties in the muon and electron channels if a similar effect is expected on the shape or normalisation of the mreco
dis-tribution in both channels similarly. The nuisance parameters for the shape uncertainties are taken to be Gaussian distributed. For the uncertainties on the normalisation log-normal prior distributions are assumed.
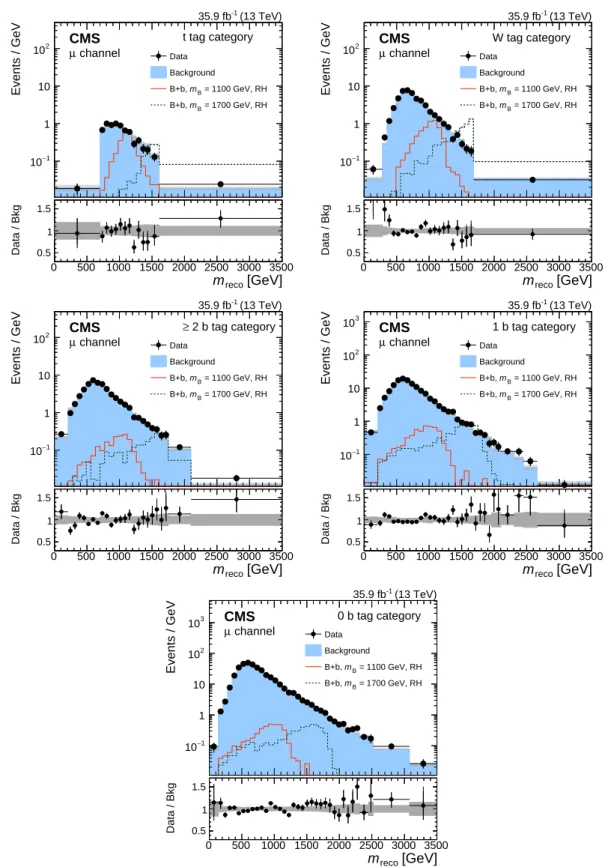
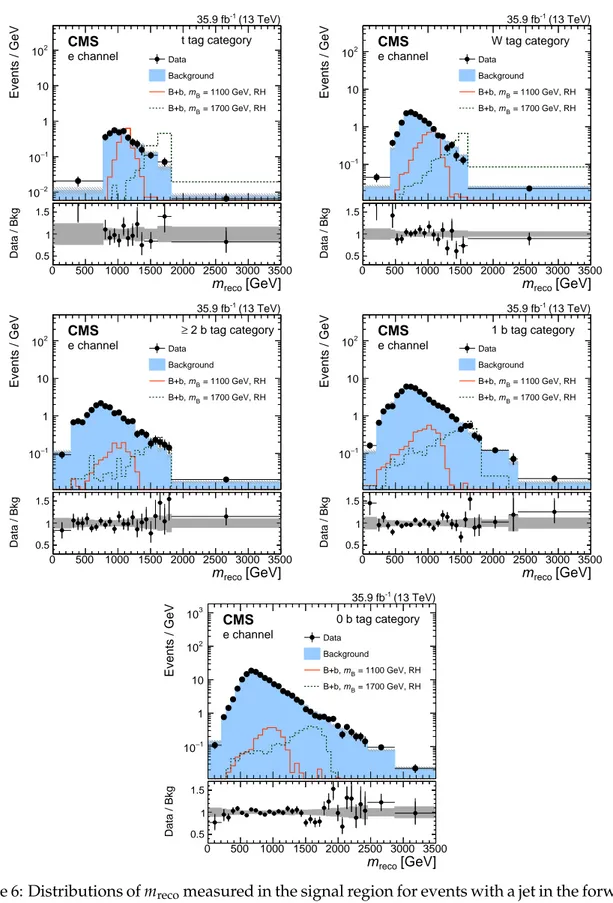
The measured distributions of mreco for the signal categories are shown in Figs. 5 and 6 for
the muon and electron channels, together with the background predictions obtained from the control regions. The signal mrecodistributions for a vector-like B quark with right-handed
cou-plings produced in association with a b quark are shown for illustration, for two different VLQ masses with an assumed production cross section of 1 pb and a relative VLQ width of 1%. No significant deviation from the background expectation is observed in any of the categories. Exclusion limits on the product of the VLQ production cross section and branching fraction are calculated at 95% confidence level (CL) for VLQ masses between 700 and 2000 GeV by using a Bayesian statistical method [73, 74]. Pseudo-experiments are performed to extract expected upper limits under the background-only hypothesis. For the signal cross section parameter an uniform prior distribution, and for the nuisance parameters log-normal prior distributions are used. The nuisance parameters are randomly varied within their ranges of validity to estimate the 68 and 95% CL expected limits. Correlations between the systematic uncertainties across all channels are taken into account through a common nuisance parameter. The statistical uncer-tainties of the background predictions are treated as an additional Poisson nuisance parameter in each bin of the mrecodistribution.
0 500 1000 1500 2000 2500 3000 3500 Events / GeV 1 − 10 1 10 2 10 t tag category Data Background = 1100 GeV, RH B m B+b, = 1700 GeV, RH B m B+b, (13 TeV) -1 35.9 fb channel µ CMS [GeV] reco m 0 500 1000 1500 2000 2500 3000 3500 Data / Bkg 0.5 1 1.5 0 500 1000 1500 2000 2500 3000 3500 Events / GeV 1 − 10 1 10 2 10 W tag category Data Background = 1100 GeV, RH B m B+b, = 1700 GeV, RH B m B+b, (13 TeV) -1 35.9 fb channel µ CMS [GeV] reco m 0 500 1000 1500 2000 2500 3000 3500 Data / Bkg 0.5 1 1.5 0 500 1000 1500 2000 2500 3000 3500 Events / GeV 1 − 10 1 10 2 10 2 b tag category ≥ Data Background = 1100 GeV, RH B m B+b, = 1700 GeV, RH B m B+b, (13 TeV) -1 35.9 fb channel µ CMS [GeV] reco m 0 500 1000 1500 2000 2500 3000 3500 Data / Bkg 0.5 1 1.5 0 500 1000 1500 2000 2500 3000 3500 Events / GeV 1 − 10 1 10 2 10 3 10 1 b tag category Data Background = 1100 GeV, RH B m B+b, = 1700 GeV, RH B m B+b, (13 TeV) -1 35.9 fb channel µ CMS [GeV] reco m 0 500 1000 1500 2000 2500 3000 3500 Data / Bkg 0.5 1 1.5 0 500 1000 1500 2000 2500 3000 3500 Events / GeV 1 − 10 1 10 2 10 3 10 0 b tag category Data Background = 1100 GeV, RH B m B+b, = 1700 GeV, RH B m B+b, (13 TeV) -1 35.9 fb channel µ CMS [GeV] reco m 0 500 1000 1500 2000 2500 3000 3500 Data / Bkg 0.5 1 1.5
Figure 5: Distributions of mrecomeasured in the signal region for events with a jet in the forward
direction with|η| >2.4 in the muon channel. Shown are the sensitive categories: t tag (upper
left), W tag (upper right), ≥2 b tag (middle left), 1 b tag (middle right) and 0 b tag (lower). The background prediction is obtained from control regions as detailed in the main text. The distributions from two example signal samples for the B+b production mode with right-handed VLQ couplings with a cross section of 1 pb and a relative width of 1% are shown for illustration.
0 500 1000 1500 2000 2500 3000 3500 Events / GeV 2 − 10 1 − 10 1 10 2 10 t tag category Data Background = 1100 GeV, RH B m B+b, = 1700 GeV, RH B m B+b, (13 TeV) -1 35.9 fb e channel CMS [GeV] reco m 0 500 1000 1500 2000 2500 3000 3500 Data / Bkg 0.5 1 1.5 0 500 1000 1500 2000 2500 3000 3500 Events / GeV 1 − 10 1 10 2 10 W tag category Data Background = 1100 GeV, RH B m B+b, = 1700 GeV, RH B m B+b, (13 TeV) -1 35.9 fb e channel CMS [GeV] reco m 0 500 1000 1500 2000 2500 3000 3500 Data / Bkg 0.5 1 1.5 0 500 1000 1500 2000 2500 3000 3500 Events / GeV 1 − 10 1 10 2 10 2 b tag category ≥ Data Background = 1100 GeV, RH B m B+b, = 1700 GeV, RH B m B+b, (13 TeV) -1 35.9 fb e channel CMS [GeV] reco m 0 500 1000 1500 2000 2500 3000 3500 Data / Bkg 0.5 1 1.5 0 500 1000 1500 2000 2500 3000 3500 Events / GeV 1 − 10 1 10 2 10 1 b tag category Data Background = 1100 GeV, RH B m B+b, = 1700 GeV, RH B m B+b, (13 TeV) -1 35.9 fb e channel CMS [GeV] reco m 0 500 1000 1500 2000 2500 3000 3500 Data / Bkg 0.5 1 1.5 0 500 1000 1500 2000 2500 3000 3500 Events / GeV 1 − 10 1 10 2 10 3 10 0 b tag category Data Background = 1100 GeV, RH B m B+b, = 1700 GeV, RH B m B+b, (13 TeV) -1 35.9 fb e channel CMS [GeV] reco m 0 500 1000 1500 2000 2500 3000 3500 Data / Bkg 0.5 1 1.5
Figure 6: Distributions of mrecomeasured in the signal region for events with a jet in the forward
direction with|η| >2.4 in the electron channel. Shown are the sensitive categories: t tag(upper
left), W tag(upper right), ≥2 b tag (middle left), 1 b tag (middle right) and 0 b tag (lower). The background prediction is obtained from control regions as detailed in the main text. The distributions from two example signal samples for the B+b production mode with right-handed VLQ couplings with a cross section of 1 pb and a relative VLQ width of 1% are shown for illustration.
Table 2: Observed (expected) upper limits at 95% CL on the product of the cross section and branching fraction for the B+b and X5/3+t production modes, for a set of VLQ masses, for VLQs
widths of 1% and 10%, and for left-handed and right-handed couplings. The exclusion limits for the B+t production mode (not shown) are very similar to those for the X5/3+t mode.
B+b X5/3+t mVLQ[TeV] 1% LH 10% LH 1% RH 1% LH 10% LH 1% RH 0.8 0.29 (0.36) 0.27 (0.36) 0.25 (0.29) 0.31 (0.27) 0.32 (0.25) 0.21 (0.18) 1 0.29 (0.17) 0.29 (0.19) 0.21 (0.12) 0.25 (0.15) 0.25 (0.16) 0.15 (0.10) 1.2 0.10 (0.10) 0.11 (0.11) 0.07 (0.07) 0.10 (0.09) 0.10 (0.10) 0.06 (0.06) 1.4 0.07 (0.07) 0.06 (0.08) 0.03 (0.05) 0.05 (0.06) 0.05 (0.07) 0.03 (0.05) 1.6 0.05 (0.05) 0.05 (0.06) 0.03 (0.04) 0.04 (0.04) 0.05 (0.05) 0.03 (0.03) 1.8 0.04 (0.04) 0.05 (0.04) 0.03 (0.03) — 0.05 (0.04) —
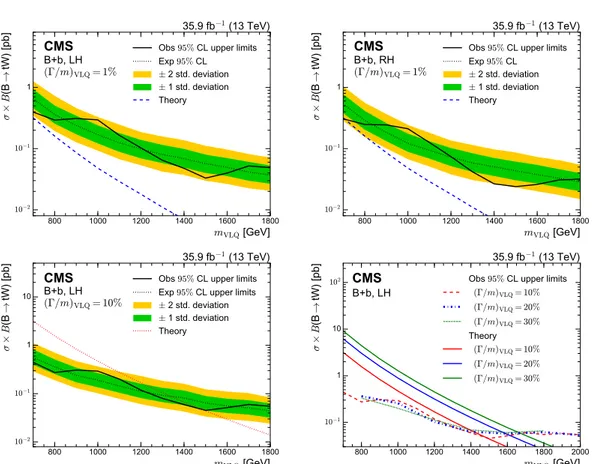
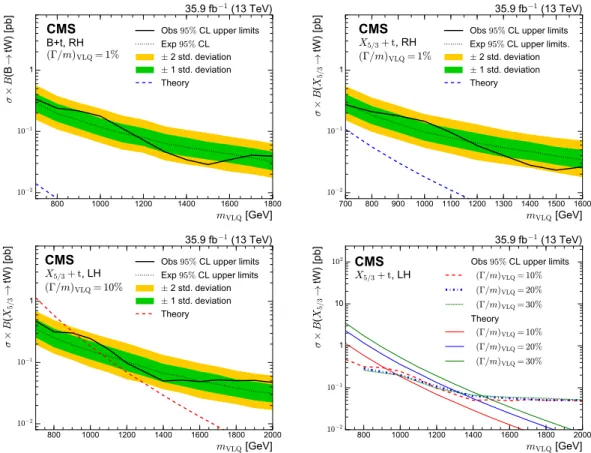
Figure 7 shows the 95% CL upper limits on the product of the cross section and branching frac-tion for the B+b producfrac-tion mode for left- and right-handed VLQ couplings and a relative VLQ width of 1% (upper left and upper right), for the left-handed VLQ couplings and a relative VLQ width of 10% (lower left), as well as a comparison of the observed exclusion limits for relative VLQ widths between 10 and 30% (lower right). In Fig. 8, the 95% CL upper limits on the prod-uct of the cross section and branching fraction for the prodprod-uction modes B+t (upper left) and X5/3+t (upper right) and right-handed VLQ couplings are shown. The figure also shows the X5/3+t exclusion limits for left-handed VLQ couplings with a 10% relative VLQ width (lower left) and a comparison of the observed exclusion limits for VLQ widths between 10 and 30% for left-handed couplings (lower right). The predicted cross sections for variations of the rela-tive VLQ mass width (dashed lines) are taken from Refs. [55–57]. For a set of VLQ masses the expected and observed 95% CL upper limits for the B+b and the X5/3+t production modes are
also given in Table 2 for VLQs with widths of 1% and 10% and left-handed couplings, as well as for widths of 1% and right-handed couplings. The exclusion limits for the B+t production mode are similar to those for the X5/3+t production mode.
The obtained exclusion limits range from 0.3 to 0.03 pb for VLQ masses between 700 and 2000 GeV. For VLQs with a relative width of 1% and purely left-handed couplings an increase of about 25% of the 95% CL upper limits is observed because of the reduced signal acceptance, in comparison to the right-handed couplings. The expected limits for VLQ with relative widths of 10–30% and left-handed couplings only show small differences. Although the predicted cross sections for the SM backgrounds are considerably larger at 13 TeV, similar exclusion lim-its on the product of cross section and branching fraction are achieved compared to the results obtained at 8 TeV in the more restricted mass range considered in Ref. [32]. However, because of the increase of the VLQ signal cross section at 13 TeV, with this analysis, the existence of VLQ B (X5/3) quarks with left-handed couplings and a relative width of 10, 20, and 30% can be
ex-cluded for masses below 1490, 1590, and 1660 GeV (920, 1300, and 1450 GeV) respectively. The results represent the most stringent exclusion limits for singly produced VLQ in this channel.
9
Summary
A search for singly produced vector-like quarks decaying into a top quark and a W boson has been performed using the 2016 data set recorded by the CMS experiment at the CERN LHC. The selection is optimised for high vector-like quark masses, with a single muon or electron, significant missing transverse momentum, and two jets with high pT in the final state.
800 1000 1200 1400 1600 1800 mVLQ [GeV] 10−2 10−1 1 σ × B (B → tW ) [p b] CMS B+b, LH (Γ/m)VLQ= 1% 35.9 fb−1 (13 TeV) Obs 95% CL upper limits Exp 95% CL ± 2 std. deviation ± 1 std. deviation Theory 800 1000 1200 1400 1600 1800 mVLQ [GeV] 10−2 10−1 1 σ × B (B → tW ) [p b] CMS B+b, RH (Γ/m)VLQ= 1% 35.9 fb−1 (13 TeV) Obs 95% CL upper limits Exp 95% CL ± 2 std. deviation ± 1 std. deviation Theory 800 1000 1200 1400 1600 1800 mVLQ [GeV] 10−2 10−1 1 10 σ × B (B → tW ) [p b] CMS B+b, LH (Γ/m)VLQ= 10% 35.9 fb−1 (13 TeV) Obs 95% CL upper limits Exp 95% CL upper limits ± 2 std. deviation ± 1 std. deviation Theory 800 1000 1200 1400 1600 1800 2000 mVLQ [GeV] 10−1 1 10 102 σ × B (B → tW ) [p b] CMS B+b, LH 35.9 fb−1 (13 TeV) Obs 95% CL upper limits (Γ/m)VLQ= 10% (Γ/m)VLQ= 20% (Γ/m)VLQ= 30% Theory (Γ/m)VLQ= 10% (Γ/m)VLQ= 20% (Γ/m)VLQ= 30%
Figure 7: Upper limits at 95% CL on the product of the VLQ production cross section and branching fraction for the B+b production mode for a relative VLQ width of 1% and and right-handed VLQ couplings (upper left and right), for 10% relative VLQ width and left-handed VLQ couplings (lower left), and a comparison of the observed exclusion limits for relative VLQ widths of 10, 20, and 30% for left-handed couplings (lower right). The dashed lines show the theoretical predictions.
800 1000 1200 1400 1600 1800 mVLQ [GeV] 10−2 10−1 1 σ × B (B → tW ) [p b] CMS B+t, RH (Γ/m)VLQ= 1% 35.9 fb−1 (13 TeV) Obs 95% CL upper limits Exp 95% CL ± 2 std. deviation ± 1 std. deviation Theory 700 800 900 1000 1100 1200 1300 1400 1500 1600 mVLQ [GeV] 10−2 10−1 1 σ × B ( X5/3 → tW ) [p b] CMS X5/3+ t, RH (Γ/m)VLQ= 1% 35.9 fb−1 (13 TeV) Obs 95% CL upper limits Exp 95% CL upper limits. ± 2 std. deviation ± 1 std. deviation Theory 800 1000 1200 1400 1600 1800 2000 mVLQ [GeV] 10−2 10−1 1 σ × B ( X5/3 → tW ) [p b] CMS X5/3+ t, LH (Γ/m)VLQ= 10% 35.9 fb−1 (13 TeV) Obs 95% CL upper limits Exp 95% CL upper limits ± 2 std. deviation ± 1 std. deviation Theory 800 1000 1200 1400 1600 1800 2000 mVLQ [GeV] 10−2 10−1 1 10 102 σ × B ( X5/3 → tW ) [p b] CMS X5/3+ t, LH 35.9 fb−1 (13 TeV) Obs 95% CL upper limits (Γ/m)VLQ= 10% (Γ/m)VLQ= 20% (Γ/m)VLQ= 30% Theory (Γ/m)VLQ= 10% (Γ/m)VLQ= 20% (Γ/m)VLQ= 30%
Figure 8: Upper limits at 95% CL on the product of the VLQ production cross section and branching fraction for the B+t and X5/3+t production modes for right-handed VLQ couplings assuming a relative VLQ width of 1% (upper left and right), for the X5/3+t production mode
with left-handed VLQ couplings and a 10% relative width (lower left) and a comparison of the observed exclusion limits for left-handed couplings for relative widths of 10, 20, and 30% (lower right). The dashed lines show the theoretical predictions.
and a forward jet. The latter feature is used to obtain the background prediction in the signal regions from data. The mass of the vector-like quark is reconstructed from the hadronic jets, the missing transverse momentum, and the lepton in the event. Different decay possibilities of the t and W are considered. The reach of the search is enhanced by t, W, and b tagging methods. No significant deviation from the standard model prediction is observed. Upper exclusion limits at 95% confidence level on the product of the production cross section and branching fraction range from around 0.3–0.03 pb for vector-like quark masses between 700 and 2000 GeV. Depending on the vector-like quark type, coupling, and decay width to tW, mass exclusion limits up to 1660 GeV are obtained. These represent the most stringent exclusion limits for the single production of vector-like quarks in this channel.
Acknowledgments
We congratulate our colleagues in the CERN accelerator departments for the excellent perfor-mance of the LHC and thank the technical and administrative staffs at CERN and at other CMS institutes for their contributions to the success of the CMS effort. In addition, we grate-fully acknowledge the computing centres and personnel of the Worldwide LHC Computing Grid for delivering so effectively the computing infrastructure essential to our analyses. Fi-nally, we acknowledge the enduring support for the construction and operation of the LHC and the CMS detector provided by the following funding agencies: BMWFW and FWF (Aus-tria); FNRS and FWO (Belgium); CNPq, CAPES, FAPERJ, FAPERGS, and FAPESP (Brazil); MES (Bulgaria); CERN; CAS, MoST, and NSFC (China); COLCIENCIAS (Colombia); MSES and CSF (Croatia); RPF (Cyprus); SENESCYT (Ecuador); MoER, ERC IUT, and ERDF (Estonia); Academy of Finland, MEC, and HIP (Finland); CEA and CNRS/IN2P3 (France); BMBF, DFG, and HGF (Germany); GSRT (Greece); NKFIA (Hungary); DAE and DST (India); IPM (Iran); SFI (Ireland); INFN (Italy); MSIP and NRF (Republic of Korea); LAS (Lithuania); MOE and UM (Malaysia); BUAP, CINVESTAV, CONACYT, LNS, SEP, and UASLP-FAI (Mexico); MOS (Mon-tenegro); MBIE (New Zealand); PAEC (Pakistan); MSHE and NSC (Poland); FCT (Portugal); JINR (Dubna); MON, RosAtom, RAS, RFBR, and NRC KI (Russia); MESTD (Serbia); SEIDI, CPAN, PCTI, and FEDER (Spain); MOSTR (Sri Lanka); Swiss Funding Agencies (Switzerland); MST (Taipei); ThEPCenter, IPST, STAR, and NSTDA (Thailand); TUBITAK and TAEK (Turkey); NASU and SFFR (Ukraine); STFC (United Kingdom); DOE and NSF (USA).
Individuals have received support from the Marie-Curie programme and the European Re-search Council and Horizon 2020 Grant, contract No. 675440 (European Union); the Leventis Foundation; the A. P. Sloan Foundation; the Alexander von Humboldt Foundation; the Belgian Federal Science Policy Office; the Fonds pour la Formation `a la Recherche dans l’Industrie et dans l’Agriculture (FRIA-Belgium); the Agentschap voor Innovatie door Wetenschap en Tech-nologie (IWT-Belgium); the F.R.S.-FNRS and FWO (Belgium) under the “Excellence of Science - EOS” - be.h project n. 30820817; the Ministry of Education, Youth and Sports (MEYS) of the Czech Republic; the Lend ¨ulet (“Momentum”) Programme and the J´anos Bolyai Research Schol-arship of the Hungarian Academy of Sciences, the New National Excellence Program ´UNKP, the NKFIA research grants 123842, 123959, 124845, 124850 and 125105 (Hungary); the Council of Science and Industrial Research, India; the HOMING PLUS programme of the Foundation for Polish Science, cofinanced from European Union, Regional Development Fund, the Mo-bility Plus programme of the Ministry of Science and Higher Education, the National Science Center (Poland), contracts Harmonia 2014/14/M/ST2/00428, Opus 2014/13/B/ST2/02543, 2014/15/B/ST2/03998, and 2015/19/B/ST2/02861, Sonata-bis 2012/07/E/ST2/01406; the National Priorities Research Program by Qatar National Research Fund; the Programa Estatal de Fomento de la Investigaci ´on Cient´ıfica y T´ecnica de Excelencia Mar´ıa de Maeztu, grant
MDM-2015-0509 and the Programa Severo Ochoa del Principado de Asturias; the Thalis and Aristeia programmes cofinanced by EU-ESF and the Greek NSRF; the Rachadapisek Sompot Fund for Postdoctoral Fellowship, Chulalongkorn University and the Chulalongkorn Aca-demic into Its 2nd Century Project Advancement Project (Thailand); the Welch Foundation, contract C-1845; and the Weston Havens Foundation (USA).
References
[1] ATLAS Collaboration, “Observation of a new particle in the search for the standard model Higgs boson with the ATLAS detector at the LHC”, Phys. Lett. B 716 (2012) 1, doi:10.1016/j.physletb.2012.08.020, arXiv:1207.7214.
[2] CMS Collaboration, “Observation of a new boson at a mass of 125 GeV with the CMS experiment at the LHC”, Phys. Lett. B 716 (2012) 30,
doi:10.1016/j.physletb.2012.08.021, arXiv:1207.7235.
[3] N. Arkani-Hamed, A. G. Cohen, E. Katz, and A. E. Nelson, “The littlest Higgs”, JHEP 07 (2002) 034, doi:10.1088/1126-6708/2002/07/034, arXiv:hep-ph/0206021. [4] M. Schmaltz, “Physics beyond the standard model (theory): Introducing the little Higgs”,
Nucl. Phys. Proc. Suppl. 117 (2003) 40, doi:10.1016/S0920-5632(03)01409-9, arXiv:hep-ph/0210415.
[5] M. Schmaltz and D. Tucker-Smith, “Little Higgs review”, Ann. Rev. Nucl. Part. Sci. 55 (2005) 229, doi:10.1146/annurev.nucl.55.090704.151502,
arXiv:hep-ph/0502182.
[6] D. Marzocca, M. Serone, and J. Shu, “General composite Higgs models”, JHEP 08 (2012) 013, doi:10.1007/JHEP08(2012)013, arXiv:1205.0770.
[7] A. Djouadi and A. Lenz, “Sealing the fate of a fourth generation of fermions”, Phys. Lett. B 715 (2012) 310, doi:10.1016/j.physletb.2012.07.060, arXiv:1204.1252. [8] J. A. Aguilar-Saavedra, R. Benbrik, S. Heinemeyer, and M. P´erez-Victoria, “Handbook of
vectorlike quarks: Mixing and single production”, Phys. Rev. D 88 (2013) 094010, doi:10.1103/PhysRevD.88.094010, arXiv:1306.0572.
[9] ATLAS and CMS Collaborations, “Measurements of the Higgs boson production and decay rates and constraints on its couplings from a combined ATLAS and CMS analysis of the LHC pp collision data at√s=7 and 8 TeV”, JHEP 08 (2016) 045,
doi:10.1007/JHEP08(2016)045, arXiv:1606.02266.
[10] CMS Collaboration, “Inclusive search for a vector-like T quark with charge 23 in pp collisions at√s = 8 TeV”, Phys. Lett. B 729 (2014) 149,
doi:10.1016/j.physletb.2014.01.006, arXiv:1311.7667.
[11] CMS Collaboration, “Search for vector-like T quarks decaying to top quarks and Higgs bosons in the all-hadronic channel using jet substructure”, JHEP 06 (2015) 080,
doi:10.1007/JHEP06(2015)080, arXiv:1503.01952.
[12] CMS Collaboration, “Search for vector-like charge 2/3 T quarks in proton-proton collisions at√s=8 TeV”, Phys. Rev. D 93 (2016) 012003,
[13] CMS Collaboration, “Search for single production of a heavy vector-like T quark
decaying to a Higgs boson and a top quark with a lepton and jets in the final state”, Phys. Lett. B 771 (2017) 80, doi:10.1016/j.physletb.2017.05.019,
arXiv:1612.00999.
[14] CMS Collaboration, “Search for single production of vector-like quarks decaying into a b quark and a W boson in proton-proton collisions at√s=13 TeV”, Phys. Lett. B 772 (2017) 634, doi:10.1016/j.physletb.2017.07.022, arXiv:1701.08328. [15] CMS Collaboration, “Search for top quark partners with charge 5/3 in proton-proton
collisions at√s=13 TeV”, JHEP 08 (2017) 073, doi:10.1007/JHEP08(2017)073, arXiv:1705.10967.
[16] CMS Collaboration, “Search for pair production of vector-like T and B quarks in single-lepton final states using boosted jet substructure in proton-proton collisions at√
s =13 TeV”, JHEP 11 (2017) 085, doi:10.1007/JHEP11(2017)085, arXiv:1706.03408.
[17] CMS Collaboration, “Search for pair production of vector-like quarks in the bWbW channel from proton-proton collisions at√s =13 TeV”, Phys. Lett. B 779 (2018) 82, doi:10.1016/j.physletb.2018.01.077, arXiv:1710.01539.
[18] CMS Collaboration, “Search for single production of a vector-like T quark decaying to a Z boson and a top quark in proton-proton collisions at√s=13 TeV”, Phys. Lett. B 781 (2018) 574, doi:10.1016/j.physletb.2018.04.036, arXiv:1708.01062. [19] CMS Collaboration, “Search for single production of vector-like quarks decaying to a b
quark and a Higgs boson”, JHEP 06 (2018) 031, doi:10.1007/JHEP06(2018)031, arXiv:1802.01486.
[20] ATLAS Collaboration, “Search for heavy vector-like quarks coupling to light quarks in proton-proton collisions at√s=7 TeV with the ATLAS detector”, Phys. Lett. B 712 (2012) 22, doi:10.1016/j.physletb.2012.03.082, arXiv:1112.5755. [21] ATLAS Collaboration, “Search for pair production of a new quark that decays to a Z
boson and a bottom quark with the ATLAS detector”, Phys. Rev. Lett. 109 (2012) 071801, doi:10.1103/PhysRevLett.109.071801, arXiv:1204.1265.
[22] ATLAS Collaboration, “Search for pair and single production of new heavy quarks that decay to a Z boson and a third-generation quark in pp collisions at√s=8 TeV with the ATLAS detector”, JHEP 11 (2014) 104, doi:10.1007/JHEP11(2014)104,
arXiv:1409.5500.
[23] ATLAS Collaboration, “Analysis of events with b-jets and a pair of leptons of the same charge in pp collisions at√s=8 TeV with the ATLAS detector”, JHEP 10 (2015) 150, doi:10.1007/JHEP10(2015)150, arXiv:1504.04605.
[24] ATLAS Collaboration, “Search for production of vector-like quark pairs and of four top quarks in the lepton-plus-jets final state in pp collisions at√s =8 TeV with the ATLAS detector”, JHEP 08 (2015) 105, doi:10.1007/JHEP08(2015)105,
arXiv:1505.04306.
[25] ATLAS Collaboration, “Search for vector-like B quarks in events with one isolated lepton, missing transverse momentum and jets at√s=8 TeV with the ATLAS detector”, Phys. Rev. D 91 (2015) 112011, doi:10.1103/PhysRevD.91.112011, arXiv:1503.05425.
[26] ATLAS Collaboration, “Search for top squarks in final states with one isolated lepton, jets, and missing transverse momentum in√s=13 TeV pp collisions with the ATLAS detector”, Phys. Rev. D 94 (2016) 052009, doi:10.1103/PhysRevD.94.052009, arXiv:1606.03903.
[27] ATLAS Collaboration, “Search for single production of vector-like quarks decaying into Wb in pp collisions at√s= 8 TeV with the atlas detector”, Eur. Phys. J. C 76 (2016) 442, doi:10.1140/epjc/s10052-016-4281-8, arXiv:1602.05606.
[28] ATLAS Collaboration, “Search for single production of a vector-like quark via a heavy gluon in the 4b final state with the ATLAS detector in pp collisions at√s=8 TeV”, Phys. Lett. B 758 (2016) 249, doi:10.1016/j.physletb.2016.04.061,
arXiv:1602.06034.
[29] ATLAS Collaboration, “Search for pair production of vector-like top quarks in events with one lepton, jets, and missing transverse momentum in√s=13 TeV pp collisions with the ATLAS detector”, JHEP 08 (2017) 052, doi:10.1007/JHEP08(2017)052, arXiv:1705.10751.
[30] ATLAS Collaboration, “Search for pair production of heavy vector-like quarks decaying to high-p√ TW bosons and b quarks in the lepton-plus-jets final state in pp collisions at
s =13 TeV with the ATLAS detector”, JHEP 10 (2017) 141, doi:10.1007/JHEP10(2017)141, arXiv:1707.03347.
[31] ATLAS Collaboration, “Search for pair production of up-type vector-like quarks and for four-top-quark events in final states with multiple b-jets with the ATLAS detector”, JHEP 07 (2018) 089, doi:10.1007/JHEP07(2018)089, arXiv:1803.09678.
[32] ATLAS Collaboration, “Search for the production of single vector-like and excited quarks in the Wt final state in pp collisions at√s = 8 TeV with the ATLAS detector”, JHEP 02 (2016) 110, doi:10.1007/JHEP02(2016)110, arXiv:1510.02664.
[33] CMS Collaboration, “Particle-flow reconstruction and global event description with the CMS detector”, JINST 12 (2017) P10003, doi:10.1088/1748-0221/12/10/P10003, arXiv:1706.04965.
[34] CMS Collaboration, “Performance of electron reconstruction and selection with the CMS detector in proton-proton collisions at√s=8 TeV”, JINST 10 (2015) P06005,
doi:10.1088/1748-0221/10/06/P06005, arXiv:1502.02701.
[35] CMS Collaboration, “Performance of CMS muon reconstruction in pp collision events at√ s =7 TeV”, JINST 7 (2012) P10002, doi:10.1088/1748-0221/7/10/P10002, arXiv:1206.4071.
[36] M. Cacciari, G. P. Salam, and G. Soyez, “The anti-kTjet clustering algorithm”, JHEP 04
(2008) 063, doi:10.1088/1126-6708/2008/04/063, arXiv:0802.1189.
[37] M. Cacciari, G. P. Salam, and G. Soyez, “Fastjet user manual”, Eur. Phys. J. C 72 (2012) 1896, doi:10.1140/epjc/s10052-012-1896-2, arXiv:1111.6097.
[38] CMS Collaboration, “The CMS experiment at the CERN LHC”, JINST 3 (2008) S08004, doi:10.1088/1748-0221/3/08/S08004.
[39] CMS Collaboration, “The CMS trigger system”, JINST 12 (2017) P01020, doi:10.1088/1748-0221/12/01/P01020, arXiv:1609.02366.
[40] CMS Collaboration, “CMS luminosity measurements for the 2016 data taking period”, Technical Report CMS-PAS-LUM-17-001, 2017.
[41] P. Nason, “A new method for combining NLO QCD with shower Monte Carlo algorithms”, JHEP 11 (2004) 040, doi:10.1088/1126-6708/2004/11/040, arXiv:hep-ph/0409146.
[42] S. Frixione, P. Nason, and C. Oleari, “Matching NLO QCD computations with parton shower simulations: the POWHEG method”, JHEP 11 (2007) 070,
doi:10.1088/1126-6708/2007/11/070, arXiv:0709.2092.
[43] S. Alioli, P. Nason, C. Oleari, and E. Re, “A general framework for implementing nlo calculations in shower monte carlo programs: the POWHEG BOX”, JHEP 06 (2010) 043, doi:10.1007/JHEP06(2010)043, arXiv:1002.2581.
[44] J. Alwall et al., “The automated computation of tree-level and next-to-leading order differential cross sections, and their matching to parton shower simulations”, JHEP 07 (2014) 079, doi:10.1007/JHEP07(2014)079, arXiv:1405.0301.
[45] R. Frederix and S. Frixione, “Merging meets matching in MC@NLO”, JHEP 12 (2012) 061, doi:10.1007/JHEP12(2012)061, arXiv:1209.6215.
[46] J. Alwall et al., “Comparative study of various algorithms for the merging of parton showers and matrix elements in hadronic collisions”, Eur. Phys. J. C 53 (2008) 473, doi:10.1140/epjc/s10052-007-0490-5, arXiv:0706.2569.
[47] T. Sj ¨ostrand et al., “An introduction to PYTHIA 8.2”, Comput. Phys. Commun. 191 (2015) 159, doi:10.1016/j.cpc.2015.01.024, arXiv:1410.3012.
[48] NNPDF Collaboration, “Parton distributions for the LHC run II”, JHEP 04 (2015) 040, doi:10.1007/JHEP04(2015)040, arXiv:1410.8849.
[49] CMS Collaboration, “Event generator tunes obtained from underlying event and multiparton scattering measurements”, Eur. Phys. J. C 76 (2016) 155,
doi:10.1140/epjc/s10052-016-3988-x, arXiv:1512.00815.
[50] P. Skands, S. Carrazza, and J. Rojo, “Tuning PYTHIA 8.1: the Monash 2013 tune”, Eur. Phys. J. C 74 (2014) 3024, doi:10.1140/epjc/s10052-014-3024-y,
arXiv:1404.5630.
[51] CMS Collaboration, “Investigations of the impact of the parton shower tuning in Pythia 8 in the modelling of tt at√s =8 and 13 TeV”, Technical Report CMS-PAS-TOP-16-021, CERN, Geneva, 2016.
[52] M. Buchkremer, G. Cacciapaglia, A. Deandrea, and L. Panizzi, “Model independent framework for searches of top partners”, Nucl. Phys. B 876 (2013) 376,
doi:10.1016/j.nuclphysb.2013.08.010, arXiv:1305.4172.
[53] B. Fuks and H.-S. Shao, “QCD next-to-leading-order predictions matched to parton showers for vector-like quark models”, Eur. Phys. J. C 77 (2017) 135,
doi:10.1140/epjc/s10052-017-4686-z, arXiv:1610.04622.
[54] A. Carvalho, “Gravity particles from warped extra dimensions, predictions for LHC”, (2014). arXiv:1404.0102.
[55] J. M. Campbell, R. K. Ellis, and F. Tramontano, “Single top production and decay at next-to-leading order”, Phys. Rev. D 70 (2004) 094012,
doi:10.1103/PhysRevD.70.094012, arXiv:hep-ph/0408158.
[56] O. Matsedonskyi, G. Panico, and A. Wulzer, “On the interpretation of top partners searches”, JHEP 12 (2014) 097, doi:10.1007/JHEP12(2014)097,
arXiv:1409.0100.
[57] A. Carvalho et al., “Single production of vector-like quarks with large width at the Large Hadron Collider”, Phys. Rev. D 98 (2018) 015029,
doi:10.1103/PhysRevD.98.015029, arXiv:1805.06402.
[58] S. Frixione, E. Laenen, P. Motylinski, and B. R. Webber, “Angular correlations of lepton pairs from vector boson and top quark decays in Monte Carlo simulations”, JHEP 04 (2007) 081, doi:10.1088/1126-6708/2007/04/081, arXiv:hep-ph/0702198. [59] P. Artoisenet, R. Frederix, O. Mattelaer, and R. Rietkerk, “Automatic spin-entangled
decays of heavy resonances in Monte Carlo simulations”, JHEP 03 (2013) 015, doi:10.1007/JHEP03(2013)015, arXiv:1212.3460.
[60] GEANT4 Collaboration, “GEANT4–a simulation toolkit”, Nucl. Instrum. Meth. A 506 (2003) 250, doi:10.1016/S0168-9002(03)01368-8.
[61] CMS Collaboration, “Jet energy scale and resolution in the CMS experiment in pp collisions at 8 TeV”, JINST 12 (2017) P02014,
doi:10.1088/1748-0221/12/02/P02014, arXiv:1607.03663.
[62] CMS Collaboration, “Performance of the CMS muon detector and muon reconstruction with proton-proton collisions at√s=13 TeV”, JINST 13 (2018) P06015,
doi:10.1088/1748-0221/13/06/P06015, arXiv:1804.04528. [63] CMS Collaboration, “Top tagging with new approaches”, Technical Report
CMS-PAS-JME-15-002, CERN, Geneva, 2016.
[64] CMS Collaboration, “Jet algorithms performance in 13 TeV data”, Technical Report CMS-PAS-JME-16-003, 2017.
[65] M. Dasgupta, A. Fregoso, S. Marzani, and G. P. Salam, “Towards an understanding of jet substructure”, JHEP 09 (2013) 029, doi:10.1007/JHEP09(2013)029,
arXiv:1307.0007.
[66] A. J. Larkoski, S. Marzani, G. Soyez, and J. Thaler, “Soft Drop”, JHEP 05 (2014) 146, doi:10.1007/JHEP05(2014)146, arXiv:1402.2657.
[67] CMS Collaboration, “Identification of heavy-flavour jets with the CMS detector in pp collisions at 13 TeV”, JINST 13 (2018) P05011,
doi:10.1088/1748-0221/13/05/P05011, arXiv:1712.07158.
[68] J. Thaler and K. Van Tilburg, “Identifying boosted objects with N-subjettiness”, JHEP 03 (2011) 015, doi:10.1007/JHEP03(2011)015, arXiv:1011.2268.
[69] J. Thaler and K. Van Tilburg, “Maximizing boosted top identification by minimizing N-subjettiness”, JHEP 02 (2012) 093, doi:10.1007/JHEP02(2012)093,
[70] CMS Collaboration, “Measurement of the inelastic proton-proton cross section at√s=7 TeV”, Phys. Lett. B 722 (2013) 5, doi:10.1016/j.physletb.2013.03.024,
arXiv:1210.6718.
[71] J. Butterworth et al., “PDF4LHC recommendations for LHC run II”, J. Phys. G 43 (2016) 023001, doi:10.1088/0954-3899/43/2/023001, arXiv:1510.03865.
[72] M. B¨ahr et al., “Herwig++ physics and manual”, Eur. Phys. J. C 58 (2008) 639, doi:10.1140/epjc/s10052-008-0798-9, arXiv:0803.0883.
[73] J. Ott, “THETA— A framework for template-based modeling and inference” (2010),
http://www-ekp.physik.uni-karlsruhe.de/˜ott/theta/theta-auto. [74] A. O’Hagan and J. J. Forster, “Kendall’s advanced theory of statistics. Vol. 2B: Bayesian
A
The CMS Collaboration
Yerevan Physics Institute, Yerevan, Armenia
A.M. Sirunyan, A. Tumasyan
Institut f ¨ur Hochenergiephysik, Wien, Austria
W. Adam, F. Ambrogi, E. Asilar, T. Bergauer, J. Brandstetter, M. Dragicevic, J. Er ¨o, A. Escalante Del Valle, M. Flechl, R. Fr ¨uhwirth1, V.M. Ghete, J. Hrubec, M. Jeitler1, N. Krammer, I. Kr¨atschmer, D. Liko, T. Madlener, I. Mikulec, N. Rad, H. Rohringer, J. Schieck1, R. Sch ¨ofbeck,
M. Spanring, D. Spitzbart, A. Taurok, W. Waltenberger, J. Wittmann, C.-E. Wulz1, M. Zarucki
Institute for Nuclear Problems, Minsk, Belarus
V. Chekhovsky, V. Mossolov, J. Suarez Gonzalez
Universiteit Antwerpen, Antwerpen, Belgium
E.A. De Wolf, D. Di Croce, X. Janssen, J. Lauwers, M. Pieters, H. Van Haevermaet, P. Van Mechelen, N. Van Remortel
Vrije Universiteit Brussel, Brussel, Belgium
S. Abu Zeid, F. Blekman, J. D’Hondt, J. De Clercq, K. Deroover, G. Flouris, D. Lontkovskyi, S. Lowette, I. Marchesini, S. Moortgat, L. Moreels, Q. Python, K. Skovpen, S. Tavernier, W. Van Doninck, P. Van Mulders, I. Van Parijs
Universit´e Libre de Bruxelles, Bruxelles, Belgium
D. Beghin, B. Bilin, H. Brun, B. Clerbaux, G. De Lentdecker, H. Delannoy, B. Dorney, G. Fasanella, L. Favart, R. Goldouzian, A. Grebenyuk, A.K. Kalsi, T. Lenzi, J. Luetic, N. Postiau, E. Starling, L. Thomas, C. Vander Velde, P. Vanlaer, D. Vannerom, Q. Wang
Ghent University, Ghent, Belgium
T. Cornelis, D. Dobur, A. Fagot, M. Gul, I. Khvastunov2, D. Poyraz, C. Roskas, D. Trocino, M. Tytgat, W. Verbeke, B. Vermassen, M. Vit, N. Zaganidis
Universit´e Catholique de Louvain, Louvain-la-Neuve, Belgium
H. Bakhshiansohi, O. Bondu, S. Brochet, G. Bruno, C. Caputo, P. David, C. Delaere, M. Delcourt, A. Giammanco, G. Krintiras, V. Lemaitre, A. Magitteri, A. Mertens, K. Piotrzkowski, A. Saggio, M. Vidal Marono, S. Wertz, J. Zobec
Centro Brasileiro de Pesquisas Fisicas, Rio de Janeiro, Brazil
F.L. Alves, G.A. Alves, M. Correa Martins Junior, G. Correia Silva, C. Hensel, A. Moraes, M.E. Pol, P. Rebello Teles
Universidade do Estado do Rio de Janeiro, Rio de Janeiro, Brazil
E. Belchior Batista Das Chagas, W. Carvalho, J. Chinellato3, E. Coelho, E.M. Da Costa, G.G. Da Silveira4, D. De Jesus Damiao, C. De Oliveira Martins, S. Fonseca De Souza, H. Malbouisson, D. Matos Figueiredo, M. Melo De Almeida, C. Mora Herrera, L. Mundim, H. Nogima, W.L. Prado Da Silva, L.J. Sanchez Rosas, A. Santoro, A. Sznajder, M. Thiel, E.J. Tonelli Manganote3, F. Torres Da Silva De Araujo, A. Vilela Pereira
Universidade Estadual Paulistaa, Universidade Federal do ABCb, S˜ao Paulo, Brazil
S. Ahujaa, C.A. Bernardesa, L. Calligarisa, T.R. Fernandez Perez Tomeia, E.M. Gregoresb, P.G. Mercadanteb, S.F. Novaesa, SandraS. Padulaa
Bulgaria
A. Aleksandrov, R. Hadjiiska, P. Iaydjiev, A. Marinov, M. Misheva, M. Rodozov, M. Shopova, G. Sultanov
University of Sofia, Sofia, Bulgaria
A. Dimitrov, L. Litov, B. Pavlov, P. Petkov
Beihang University, Beijing, China
W. Fang5, X. Gao5, L. Yuan
Institute of High Energy Physics, Beijing, China
M. Ahmad, J.G. Bian, G.M. Chen, H.S. Chen, M. Chen, Y. Chen, C.H. Jiang, D. Leggat, H. Liao, Z. Liu, F. Romeo, S.M. Shaheen6, A. Spiezia, J. Tao, Z. Wang, E. Yazgan, H. Zhang, S. Zhang6, J. Zhao
State Key Laboratory of Nuclear Physics and Technology, Peking University, Beijing, China
Y. Ban, G. Chen, A. Levin, J. Li, L. Li, Q. Li, Y. Mao, S.J. Qian, D. Wang
Tsinghua University, Beijing, China
Y. Wang
Universidad de Los Andes, Bogota, Colombia
C. Avila, A. Cabrera, C.A. Carrillo Montoya, L.F. Chaparro Sierra, C. Florez, C.F. Gonz´alez Hern´andez, M.A. Segura Delgado
University of Split, Faculty of Electrical Engineering, Mechanical Engineering and Naval Architecture, Split, Croatia
B. Courbon, N. Godinovic, D. Lelas, I. Puljak, T. Sculac
University of Split, Faculty of Science, Split, Croatia
Z. Antunovic, M. Kovac
Institute Rudjer Boskovic, Zagreb, Croatia
V. Brigljevic, D. Ferencek, K. Kadija, B. Mesic, A. Starodumov7, T. Susa University of Cyprus, Nicosia, Cyprus
M.W. Ather, A. Attikis, M. Kolosova, G. Mavromanolakis, J. Mousa, C. Nicolaou, F. Ptochos, P.A. Razis, H. Rykaczewski
Charles University, Prague, Czech Republic
M. Finger8, M. Finger Jr.8
Escuela Politecnica Nacional, Quito, Ecuador
E. Ayala
Universidad San Francisco de Quito, Quito, Ecuador
E. Carrera Jarrin
Academy of Scientific Research and Technology of the Arab Republic of Egypt, Egyptian Network of High Energy Physics, Cairo, Egypt
M.A. Mahmoud9,10, A. Mahrous11, Y. Mohammed9
National Institute of Chemical Physics and Biophysics, Tallinn, Estonia
S. Bhowmik, A. Carvalho Antunes De Oliveira, R.K. Dewanjee, K. Ehataht, M. Kadastik, M. Raidal, C. Veelken