IOP Conference Series: Materials Science and Engineering
PAPER • OPEN ACCESS
A parametric design method for CFD-supported wind-driven ventilation
To cite this article: Günsu Merin Abbas and pek Gürsel Dino 2019 IOP Conf. Ser.: Mater. Sci. Eng. 609 032010View the article online for updates and enhancements.
IAQVEC
IOP Conf. Series: Materials Science and Engineering 609 (2019) 032010
IOP Publishing doi:10.1088/1757-899X/609/3/032010
A parametric design method for CFD-supported wind-driven
ventilation
Günsu Merin Abbas1,*, İpek Gürsel Dino1
1 TOBB University of Economics and Technology, Middle East Technical University
Abstract. The negative impact of the building industry has brought a critical emphasis on the performance-related tools and processes of architectural design. The integration of design and performance simulation has the potential to extend the decision-making capabilities of the architects. Amongst a number of performance parameters, wind-related measures are generally problematic for the design phase, due to the computational cost of predicting wind behaviour, the complexity of the urban context and the constantly changing airflow patterns. In this respect, this paper proposes the preliminary exploration of a design method towards integrating Computational Fluid Dynamics (CFD) coupled with energy modelling and parametric design tools for the wind-related design acts. As building performance is regarded as a design problem that necessitates a designerly point of view as much as a technical perspective, the method aims at providing visual, generative and accurate feedback regarding its potential to facilitate the architect’s designerly integration to the process and to provide a flexible design environment. The preliminary quantitative analysis conducted through a case study indicates the preliminary data flow through the design process.
1. Introduction
Over the last decades, computational design tools have been increasingly used to support building design with building performance simulation (BPS) tools. BPS tools are usually regarded as analytical that are used at the end of the design process, which leaves the generation-evaluation loop incomplete. For such problems, integrated platforms that allow the simultaneous use of design and BPS tools have been developed [1], which has a potential to improve the quality and precision of the design process with visual and rapid feedback [2]. However, the wind-related design processes stand problematic due to the unpredictability of airflow patterns. Regarding the benefits of the wind such as fresh air, passive cooling and natural ventilation- a direct impact on the indoor environmental quality and occupant’s comfort- the problem must be addressed by means of computational support from a designerly point of view. In this regard, this research problematizes the lack of integration between the airflow simulation and design tools and focuses on the integration of computational fluid dynamics (CFD) simulation. The purpose of this research is the preliminary exploration of the integrated design processes supported by simulation tools. To this end, this paper implements a computational design method and presents the preliminary results on the use of CFD-integrated design process to support decision-making in architectural design. A case study is conducted focusing on zone mean air temperature and ventilation sensible heat loss for a simple building in Istanbul, which has a hot-humid climate with the temperatures that reach its extreme in August with 34.6 ℃ [12]. In Istanbul, the vast majority of the building stock is not conditioned, which puts an emphasis on the effective use of natural ventilation for passive cooling.
2. The Development of the Method
The method involves seamless integration of CFD, which has the potential to facilitate real-time intervention on generation and evaluation processes. In this respect, there are several issues that are in need to be addressed regarding the differences between the tools, their operability and the processes.
IAQVEC
IOP Conf. Series: Materials Science and Engineering 609 (2019) 032010
IOP Publishing doi:10.1088/1757-899X/609/3/032010
2
2.1. Requirements for the Proposed Computational Design Method
There is a number of requirements for the method to support architects to conduct an integrated design process as (1) parametric design integration: the design process requires flexibility in the definition and editing of the geometry; therefore, the method must support rapid manipulation of the model, which is possible by parametric design tools, (2) rapid and visual feedback: since the design is a time-bounded, complex and information intense process, providing rapid feedback to the architect is crucial. Since the design is a visual act [3], the method is required to support the architect’s design decisions via descriptive visual feedback, (3) integrated interface: since the method proposes the integration of the design and CFD, both the design geometry and the performance simulations must be accessible from a single platform. Integrated interfaces have the potential to reduce the management problems and to save time by removing the navigation between the different platforms, which is also crucial for data management, and (4) comparative evaluation: since the method supports the parametric design integration, the comparative feedback based on geometry and the simulation must be provided within the design alternatives.
2.2. Computational Fluid Dynamics (CFD)
Various methods are used to model and quantify the airflow and test the wind-built environment interaction such as analytical and empirical models, physical experiments (i.e. on-site measurements, scaled testing in wind tunnels) and computer simulations (i.e. CFD-computational fluid dynamics) [4]. Amongst these, CFD is considered to be the most accessible, time and cost-effective method [5-6], which is a computer-based numerical simulation that computes the fluid and flow related physical behaviour [7]. CFD in architecture is used for airflow-related cases such as ventilation, infiltration and dispersion of the contaminants [8]. The process starts with the definition of the case and the geometry. The geometry is divided into its discrete cells as test points acting as probes in wind tunnel testing to obtain wind pressure (P) and wind velocity (U) values.
2.3. Data Sources and Data Flow
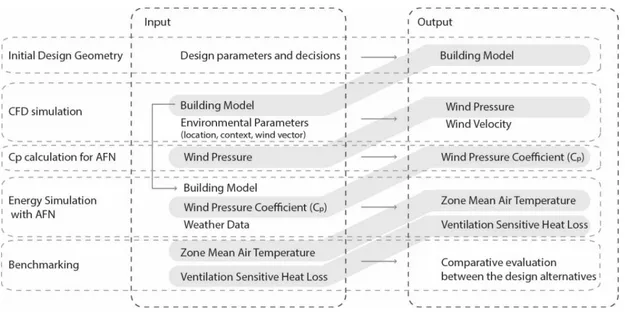
Design activity is complex, multi-objective and information-intense, which calls for seamless data integration and interoperability between tools to prevent fragmented data. In this respect, the method has a number of phases regarding the input-output relation of the process (Fig. 1).
Figure 1. Data Flow and the Phases
The process starts with the generation of the initial design geometry as a 3D model for the energy and CFD simulations. CFD simulations calculate the distributed wind velocity (U) and wind pressure (P) values on the model surface for each generated test point to obtain wind pressure coefficient (Cp) values.
IAQVEC
IOP Conf. Series: Materials Science and Engineering 609 (2019) 032010
IOP Publishing doi:10.1088/1757-899X/609/3/032010
Cp is a unitless factor that is calculated by the measurements of the pressure on the façade, undisturbed
freestream wind speed, atmospheric pressure and air density [9] as follows: 𝐶ₚ =𝑃ₓ−𝑃0
𝑃𝑑 ; 𝑃𝑑 = 𝜌 .𝑈ₕ2
2
where Px is the pressure derived from a test point on the building façade (Pa), P0 is the freestream
reference pressure, Pd is the dynamic pressure (Pa), ρ is the air density (kg/m3) and Uh is the wind speed
at a certain height of the building (m/s). In this research, the sensitivity to Cp is important to test the
impact of CFD, regarding the precision and well-informed design decision making. To this end, the derived Cp values are integrated into the energy model.
3. The Implementation of the Method
3.1. The Selection of Tools and Platforms
For the case study, existing platforms are used for 3D modelling, parametric design and CFD. Rhinoceros 3D and Grasshopper are used for 3D surface modelling and parametric modelling, respectively. Grasshopper supports the rapid parametric manipulation of 3D geometry [11] and enables the integration of various simulation tools such as Daysim, EnergyPlus, and openFOAM via plug-ins as Honeybee, Ladybug, and Butterfly [10]. This integrated platform provides the designer a single interface geometry generation, parametric model transformations and performance simulation, through a seamless process that can enhance the architect’s direct control over the design process.
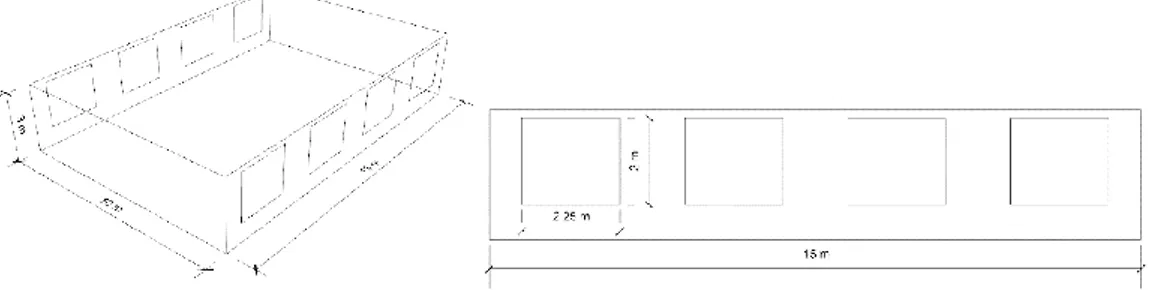
3.2. The Building Geometry
A single zone office building was defined with dimensions 10 x 15 x 3 m. The building has four identical openings, sized 2.25 x 2 m, that are placed on the opposite walls of the building (Fig. 2). The design parameter is selected as the building orientations (0°, 120° and 240°). The initial orientation of the building is aligned to the North-South axis as 0°.
Figure 2. The building geometry
3.3. The Energy and CFD Simulations
The building is located in Istanbul, which has a mixed-humid climate, identified as 4A in ASHRAE climate classification. The building is not conditioned and internal gains due to the electrical equipment, people and lighting are disregarded. The simulation is conducted for the hottest day of the year; the ventilation is set to activate at 21℃.
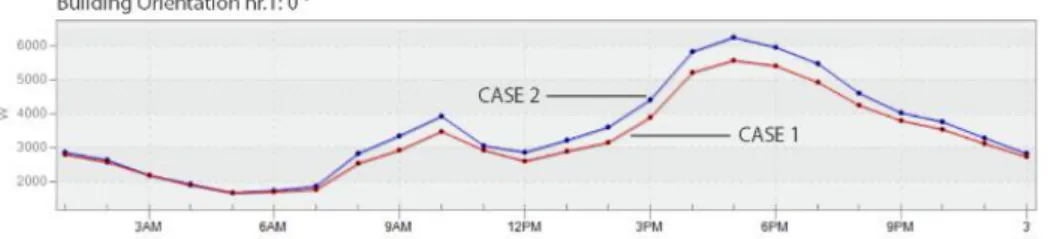
First, CFD is conducted using Butterfly for openFOAM for six directions with 60° intervals to calculate Cp for each window. To examine the impact of CFD integration on energy simulations, two
different energy models that use the AFN model for natural ventilation were generated. The first model (case 1) Cp values previously calculated by CFD, while the second model (case 2) uses auto-calculated
Cp values of the AFN model. The results show that the integration of CFD has influenced the mentioned
IAQVEC
IOP Conf. Series: Materials Science and Engineering 609 (2019) 032010
IOP Publishing doi:10.1088/1757-899X/609/3/032010
4
Figure 3. The impact of CFD integration on ventilation sensible heat loss energy on 0°
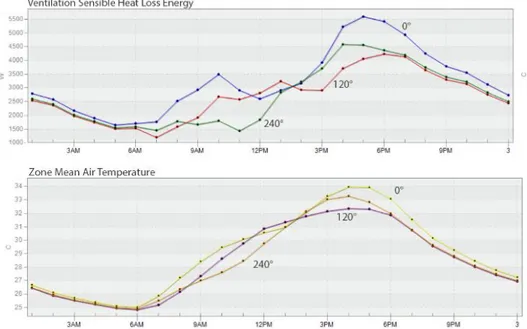
Figure 4. The impact of CFD integration on zone mean air temperature on 0°
Regarding the simulation results, Case 1 for 0°, 120° and 240° has revealed 7.8%, 5.36% and 8.16% decrease in the ventilation sensible heat loss energy and 3.98%, 2.19% and 3.58% increase in zone mean air temperature compared to the Case 2 respectively (Fig. 5). Multiple parameters affect the simulations results. Therefore, regarding the differences in CFD and AFN obtained Cp results precision, the
simulation results could only be regarded as upper and lower boundary conditions of the optimized design. In the graphs, the zone that is created by the result curves of the simulations could also be regarded as a design search space that holds alternative design options.
IAQVEC
IOP Conf. Series: Materials Science and Engineering 609 (2019) 032010
IOP Publishing doi:10.1088/1757-899X/609/3/032010 3.4. Benchmarking
Following the CFD and energy simulations, three alternative building orientations are evaluated. The first building orientation, amongst others, which is aligned on the North-South axis, has the highest ventilation sensible heat loss energy, and its zone mean air temperature is expected to be the lowest. However, the zone mean air temperatures resulted very similar to each other, despite the discrepancies in ventilation sensible heat loss energy graph (Fig. 6). This might be due to the other performance measures that may have an impact on the zone mean air temperature; accordingly, the surface conduction energy is examined since the orientation of the building has an impact on the solar gain (Fig.7). Surface conduction energy results revealed that the 0° has the lowest and 120° has the highest surface conduction energy. In this regard, it can be concluded that, regarding the lowest surface conduction energy, 0° does not support the cooling of the building compared to the other orientations, which has a negative impact on the zone mean air temperature. Also, amongst the building orientations, it is seen that 120° may provide a balanced indoor environment with the lowest zone mean air temperature, median ventilation sensible heat loss energy and the highest surface conduction energy, which supports the relatively rapid cooling of the building. As the design process is a trade-off between the performance measures, the design alternatives can be used to select the most suitable option in this respect.
Figure 6. The simulation results of three design alternatives for the building orientation
Figure 7. The surface conduction energy graph for three design alternatives 4. Conclusion and Discussions
The preliminary results present that the integrated processes of CFD, energy simulation and parametric design tools can support the architect’s well-informed decision-making.
It can be noted that energy simulations are strongly influenced by the CFD derived Cp data.
IAQVEC
IOP Conf. Series: Materials Science and Engineering 609 (2019) 032010
IOP Publishing doi:10.1088/1757-899X/609/3/032010
6
manipulation and allowed the exploration of multiple design alternatives, which is crucial for exploratory design processes. Integrated interfaces provided a flexible design environment both visually and operationally, which have contributed to the quality of the design process, time and data management. Also, integrated interfaces can increase designers’ control over generation-evaluation loop by means of rapid and visual feedback towards the real-time, simple and descriptive graphics and short simulation periods. The parametric design tools and the integrated interfaces have also made possible the comparative evaluation, which enhanced the visual integration of the architect through the performative design process.
For further work, it is observed that the method has the potential to integrate a number of tools and processes such as prototyping, physical testing, and real-time data visualisation.
References
[1] Augenbroe G 2003 Trenda in Building Simulation Advanced Building Simulation Malkawi A and
Augenbroe (eds) 4-24 Spon Press New York
[2] Kalay Y 2004 Architecture’s New Media: Principles, Theories, and Methods of Computer-Aided
Design MIT Press Cambridge MA
[3] Visser W 2009 Design: One, But in Different Forms Design Studies 30(3), 187–223
[4] Ramponi R, Costola D, Angelotti A, Blocken B and Hensen J L M 2011 Evaluation of
Wind-Driven Ventilation in Building Energy Simulation: Sensitivity to Pressure J.-L. Scartezzini (ed),
Proceedings of the CISBAT 2011 - Cleantech for sustainable buildings conference 949–954
Lausanne
[5] Wang B, Dogan T, Pal D and Reinhart C 2012 Simulating Naturally Ventilated Buildings with
Detailed CFD-Based Wind Pressure Database Fifth National Conference of IBPSA-USA 353–360 SimBuild Madison Wisconsin
[6] Kaijima S, Bouffanais R, Willcox K and Naidu S 2013 Computational Fluid Dynamics for Architectural Design. In B. Peters & X. De Kestelier (eds), Computation Works: The Building of
Algorithmic Thought 83 118–123 John Wiley & Sons
[7] Gargiulo C, Pirozzi D and Scarano V 2013 An architecture for CFD Workflow Management 11th
IEEE International Conference on Industrial Informatics (INDIN) 352–357
[8] de Wilde P 2018 Building Performance Analysis John Wiley & Sons New Jersey
[9] Cóstola D, Blocken B and Hensen J L M 2009 Overview of Pressure Coefficient Data in Building
Energy Simulation and Airflow Network Programs Building and Environment 31(0)
[10] Ladybug Tools LLC 2017 https://www.ladybug.tools/about.html
[11] Jansenn P and Chen K W 2011 Visual Dataflow Modelling: A Comparison of Three Systems
CAAD Futures 2011: Designing Together 801–816 Liege Belgium
[12] Design conditions for Istanbul Turkey ASHRAE CLIMATIC DESIGN CONDITIONS