SOFT LANDING IN TURKISH ECONOMY
Zümrüt İmamoğlu* ve Barış Soybilgen
†Executive Summary
As of this week, January data for all of our economic indicators have been released. In January, compared to December, the industrial production index (IPI) decreased by 3.1 percent while import volume index increased by 0.5 percent and export volume index decreased by 2.9 percent. A new economic indicator we started following recently, industrial new order index, indicates a fall in domestic demand and increase in foreign demand for the first quarter of 2012. Betam’s quarter on quarter (QoQ) growth forecast for the first quarter of 2012 is 0.5 percent. Our corresponding year on year (YoY) growth forecast is 4.8 percent. The QoQ and YoY growth forecasts we made for the fourth quarter of 2011 are still 6.2 and 8.4 percent, respectively.
Trade deficit fell slightly in January but did not bring the desired decrease on the current account deficit. In January, annual current account deficit remained at $77.1 billion. However, in the coming months especially in March, we expect a fall in the current account deficit due to base effect. By the end of first quarter, we expect the current account * Dr. Zümrüt İmamoğlu, Betam, Research Associate. [email protected]
† Barış Soybilgen, Betam, Research Assistant,
deficit to GDP ratio to fall from 9.9 percent to 9.5 percent.
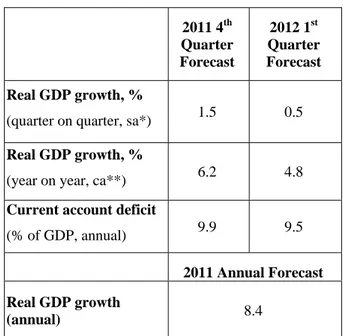
Table 1. Betam’s annual and quarterly growth forecasts
Source: Betam
*sa: seasonally and calendar day adjusted **ca: calendar day adjusted
Contraction in domestic demand, expansion in foreign demand
The growth rate of 2012 will be determined by domestic and foreign demand trends. According to the soft landing scenario, while domestic demand is contracting, there will be expansion in foreign demand and net exports will contribute to economic growth leading to a reduction in the
2011 4th Quarter Forecast 2012 1st Quarter Forecast Real GDP growth, %
(quarter on quarter, sa*) 1.5 0.5
Real GDP growth, %
(year on year, ca**) 6.2 4.8
Current account deficit
(% of GDP, annual) 9.9 9.5
2011 Annual Forecast Real GDP growth
(annual) 8.4
Economic Outlook and Forecasts:
March 2011
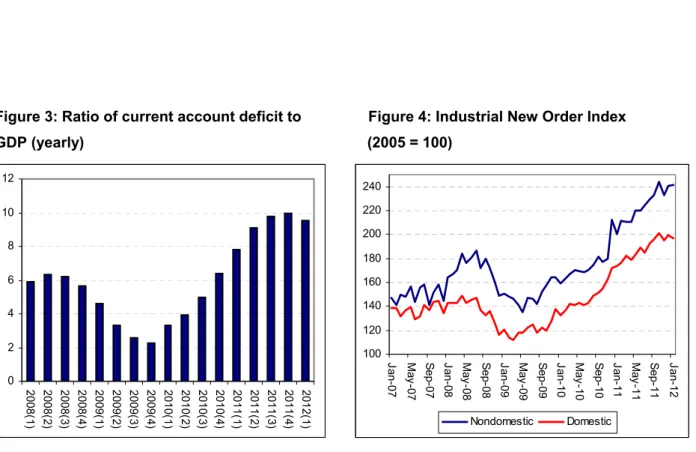
current account deficit. On the other hand, according to the hard landing scenario, a contraction in domestic demand will be accompanied by a fall in foreign demand because of the European debt crisis. The current account deficit will only fall slightly and growth rate will be low. Although, international institutions began to revise their growth forecasts upward, trends of domestic and foreign demand should still be followed closely. In this respect, we add Turkstat’s nondomestic and domestic industrial new order index to our economic indicators. The data indicates that in January domestic demand fell whereas foreign demand expanded (Table 2 and Figure 4), so at least for now, we can infer that the economy is acting according to soft landing scenario.
The fall in exports in January is worrisome though. In the last three months, exports have been increasing while imports were decreasing. However, in January, this trend was reversed: imports increased by 0.5 percent and exports decreased by 2.9 percent. Turkish Exports Assembly’s (TIM) February data also indicates that seasonally adjusted exports may not have increased in February either.
Betam forecast that in the first quarter of 2012 QoQ GDP growth will be 0.5 percent and corresponding YoY growth will be 4.8 percent.
January consumption indicators are negative
Our consumption indicators which we use to forecast the consumption expenditure were mainly negative in January 2012. Consumer confidence
index, real consumer goods imports and domestic industrial new order index fell by 0.2, 6.9 and 1.2 percent, respectively, in January. Because of the decline in consumer goods imports and domestic demand, special consumer tax (SCT) decreased by 4.3 in real terms in January. Moreover, nondurable goods manufacturing increased by 1.9 percent whereas durable goods manufacturing decreased by 1.2 percent.
Investment goods imports and manufacturing declined
January investment indicators are negative like the consumption indicators. Manufacturing and imports of investment goods decreased by 10.2 and 3.3 percent, respectively. IPI also declined by 3.1 percent in January and capacity utilization rate fell by 1 percentage point in February. On the other hand, real sector confidence index increased by 3.6 percent in February after the 1.6 percent fall in January. Increase of real sector confidence index in February might indicate that other investment indicators can become positive in the coming months.
January brake in exports
Figure 2 shows monthly changes of seasonally adjusted import and export volume indices. In January export volume index decreased by 2.9 percent whereas import volume index increased by 0.5 percent. Furthermore, nondomestic industrial new order index increased by 0.4 percent in January. Our analysis showed that the decline in exports is mainly caused by the contraction in European demand. The future of European
economy will be the determinant of Turkey’s export performance in the coming months.
Current account deficit will fall in the first quarter
In January, the current account deficit was $6 billion same as last year’s figure and annual current account deficit remained at $77.1 billion. In January, the current account deficit was mainly financed by central bank (CBT) reserves. One of the main reasons for this decline is the direct intervention of CBT to the foreign exchange market in the beginning of January. Another reason is the fall in capital inflows due to European debt crisis. However, FED’s announcement of lengthening zero interest rate policy until 2014 triggered capital inflows to
emerging markets again at the end of January and in February. When February CAD is announced, we will probably see an increase in CBT reserves.
In the coming months, we expect that CAD will decrease. Especially in March, annual growth rate of CAD will decline because of base affect. On the other hand, decline in imports caused by a slowdown in domestic demand may not have a significant impact on current account deficit because of higher oil prices. At the end of the first quarter, we expect the ratio of current account deficit to GDP to decrease to about 9.5 percent (Figure 3).
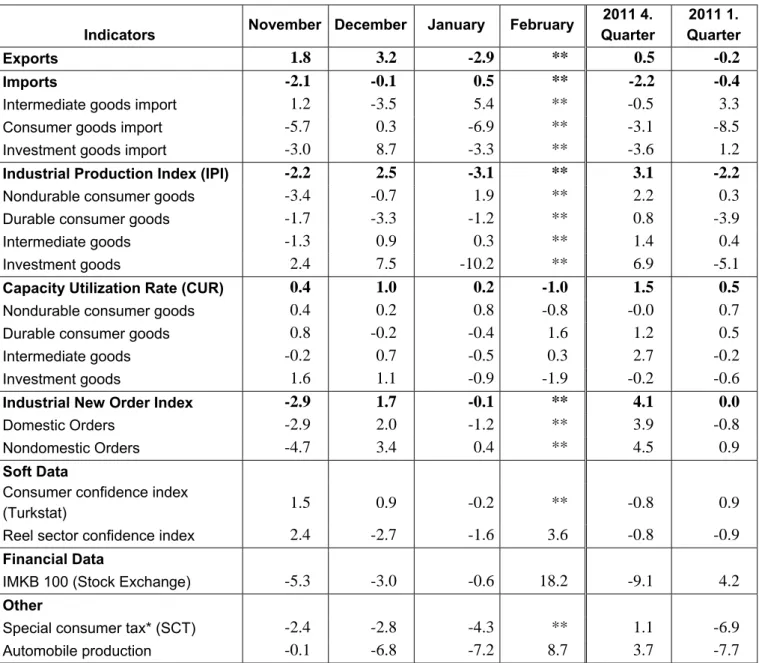
Table 2. Monthly and quarterly changes in Betam’s selected indicators (real and sa)
Indicators November December January February
2011 4. Quarter 2011 1. Quarter Exports 1.8 3.2 -2.9 ** 0.5 -0.2 Imports -2.1 -0.1 0.5 ** -2.2 -0.4
Intermediate goods import 1.2 -3.5 5.4 ** -0.5 3.3
Consumer goods import -5.7 0.3 -6.9 ** -3.1 -8.5
Investment goods import -3.0 8.7 -3.3 ** -3.6 1.2
Industrial Production Index (IPI) -2.2 2.5 -3.1 ** 3.1 -2.2
Nondurable consumer goods -3.4 -0.7 1.9 ** 2.2 0.3
Durable consumer goods -1.7 -3.3 -1.2 ** 0.8 -3.9
Intermediate goods -1.3 0.9 0.3 ** 1.4 0.4
Investment goods 2.4 7.5 -10.2 ** 6.9 -5.1
Capacity Utilization Rate (CUR) 0.4 1.0 0.2 -1.0 1.5 0.5
Nondurable consumer goods 0.4 0.2 0.8 -0.8 -0.0 0.7
Durable consumer goods 0.8 -0.2 -0.4 1.6 1.2 0.5
Intermediate goods -0.2 0.7 -0.5 0.3 2.7 -0.2
Investment goods 1.6 1.1 -0.9 -1.9 -0.2 -0.6
Industrial New Order Index -2.9 1.7 -0.1 ** 4.1 0.0
Domestic Orders -2.9 2.0 -1.2 ** 3.9 -0.8
Nondomestic Orders -4.7 3.4 0.4 ** 4.5 0.9
Soft Data
Consumer confidence index
(Turkstat) 1.5 0.9 -0.2 ** -0.8 0.9
Reel sector confidence index 2.4 -2.7 -1.6 3.6 -0.8 -0.9
Financial Data
IMKB 100 (Stock Exchange) -5.3 -3.0 -0.6 18.2 -9.1 4.2
Other
Special consumer tax* (SCT) -2.4 -2.8 -4.3 ** 1.1 -6.9
Automobile production -0.1 -6.8 -7.2 8.7 3.7 -7.7
Source: TurkStat. TCMB. Treasury. IMKB. Betam. All series are real (or inflation adjusted) wherever necessary and seasonally adjusted.
*This tax is collected on sales of goods such as gas. fuel oils. alcohol. tobacco products and automobiles. **Data not yet released
Figure 1: Capacity utilization rate and industrial production index (sa. left axis for CUR and right axis for IPI)
60 65 70 75 80 85 Ja n-07 May -07 S ep-07 Ja n-08 May -08 S ep-08 Ja n-09 May -09 S ep-09 Ja n-10 May -10 S ep-10 Ja n-11 May -11 S ep-11 Ja n-12 95 100 105 110 115 120 125 130 135 CUR IPI
Source : TurkStat. Betam
Figure 2: Volume indices of exports and imports (sa) 120.00 130.00 140.00 150.00 160.00 170.00 180.00 190.00 200.00 210.00 Ja n-07 Ma y-07 S ep-07 Ja n-08 Ma y-08 S ep-08 Ja n-09 Ma y-09 S ep-09 Ja n-10 Ma y-10 S ep-10 Ja n-11 Ma y-11 S ep-11 Ja n-12 Export Import
Source : TurkStat. Betam
Figure 3: Ratio of current account deficit to Figure 4: Industrial New Order Index
GDP (yearly) (2005 = 100)
Source: TCMB. TurkStat. Betam * Betam’s forecasts 0 2 4 6 8 10 12 2008 (1 ) 2008 (2 ) 2008 (3 ) 2008 (4 ) 2009 (1 ) 2009 (2 ) 2009 (3 ) 2009 (4 ) 2010 (1 ) 2010 (2 ) 2010 (3 ) 2010 (4 ) 2011 (1 ) 2011 (2 ) 2011 (3 ) 2011 (4 ) 2012 (1 ) 100 120 140 160 180 200 220 240 Ja n-07 May -0 7 S ep-07 Ja n-08 May -0 8 S ep-08 Ja n-09 May -0 9 S ep-09 Ja n-10 May -1 0 S ep-10 Ja n-11 May -1 1 S ep-11 Ja n-12 Nondomestic Domestic
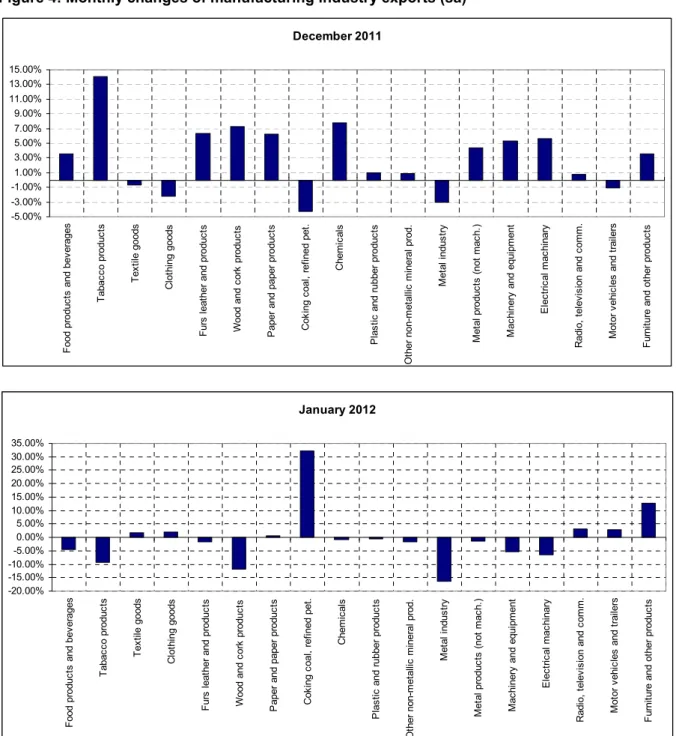
Figure 4: Monthly changes of manufacturing industry exports (sa)
Source: TurkStat. Betam
January 2012 -20.00% -15.00% -10.00% -5.00% 0.00% 5.00% 10.00% 15.00% 20.00% 25.00% 30.00% 35.00% F ood pr oduc ts and bev erages T abac co produc ts T ex til e goods C lot hi ng goods F urs leat her and pr oduc ts Wood and co rk produc ts P aper and paper pr oduc ts C ok ing c oal , ref ine d pet . C hem ic al s P las tic and r ubber pro duc ts O ther non-m et allic m in er al p ro d. M et al indus tr y M et al produc ts (not m ac h. ) M ac hi nery and e qui pm ent E lec tr ic al m ac hi nary R adi o, t el ev is ion and c om m . M ot or v ehi cl es and t rai le rs F urni tur e and ot her pr oduc ts December 2011 -5.00% -3.00% -1.00% 1.00% 3.00% 5.00% 7.00% 9.00% 11.00% 13.00% 15.00% F ood produc ts and bev erages T abac co produc ts T ex til e goods C lot hi ng goods F urs leat her and produc ts Wood and c or k produc ts P aper and paper produc ts C ok ing c oal , r ef ined pet . C hem ic al s P las tic
and rubber produc
ts O ther non-m et al lic m iner al prod. M et al indus tr y M et al pr oduc ts ( not m ac h. ) M ac hi nery an d equi pm ent E lec tr ic al m ac hi nary R adi o, t el ev is ion and c om m . M ot or v ehi cl es and t rai le rs F ur ni ture and ot her produc ts