Signs of Deceleration in the First Quarter
Zümrüt İmamoğlu* ve Barış Soybilgen†
Executive Summary
According to data released by TurkStat, Turkey’s exports and imports decreased in January from a month ago, by 7.6 and 3.7 percent, respectively. Trade deficit also fell in January compared to December and was $7.3 billion. On the other hand, industrial production index (IPI) experienced a 0.5 percent increase, much slower than the 9.6 percent increase in the previous month. We believe that the Turkish economy will return to a slower growth path in 2011. Betam forecasts that the first quarter real GDP growth in 2011 will be 1.3 percent quarter on quarter, which amounts to 5.2 percent annual growth.
Current account deficit was $5.8 billion in January a figure well below December and November levels. However, when compared to the same month a year ago, it almost doubled, and hence remains an important issue for macroeconomic stability in 2011. Betam forecasts that yearly current account deficit will be 6.9 percent of GDP at the end of this quarter.
* Dr. Zümrüt İmamoğlu, Betam, Research Associate. [email protected]
† Barış Soybilgen, Betam, Research Assistant,
Only a limited amount of data on economic activity in the first quarter is released so far, however, high volatility in automobile production, ongoing decrease in special consumption tax (SCT) and deterioration in real sector confidence index that we observe can be inferred as evident signals of deceleration in GDP growth in the first quarter.
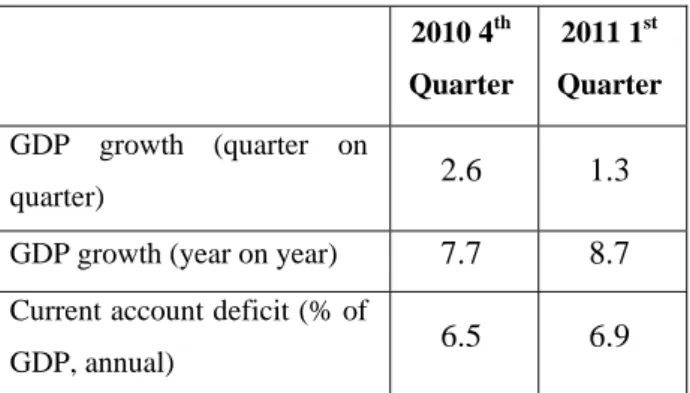
Table 1. Betam’s quarterly and annual growth and current account forecasts
Source: Betam
Investment and consumption decelerate in the first months of 2011
Table 2 lists the monthly indicators Betam follows and their monthly and quarterly percentage changes. In January and February investment and consumption indicators experienced either declines or small increases compared to the surge we observed in the last quarter. According to these indicators, Betam expects a slower growth in first quarter of 2011 compared to last quarter of 2010.
2010 4th Quarter 2011 1st Quarter GDP growth (quarter on quarter) 2.6 1.3 GDP growth (year on year) 7.7 8.7
Current account deficit (% of
GDP, annual) 6.5 6.9
Economic Outlook and Forecasts:
March 2011
Investment indicators
While investment goods production decreased in January, intermediate goods and durable goods production increased slightly. Both in January and February, real sector confidence index declined 1.1 percent and 3.1 percent, respectively. Furthermore, capacity utilization rate (CUR) fell 1.0 percentage point in February. Investment goods imports also had a large decline. According to these numbers, we think that IPI might decline in February or March and growth of investment will probably slow down in the first quarter of 2011.
Consumption indicators
Consumption indicators also give mixed signals like investment indicators. Automobile production fell 4.7 percent in January, and recovered partly in February rising 3.4 percent. Consumer confidence index did not change much in January but rose 1.3 percent in February. Special Consumption Tax (SCT) decreased for two months consecutively, by a total of 8.5 percent. Some of the decrease in SCT can be related to fall in imports, but overall we believe that growth in consumption is slowing down.
Foreign trade
Figure 2 shows monthly changes of seasonally adjusted import and export volume indices. In January both exports and imports decreased. Export volume index fell by 7.6 percent and import volume index fell by 3.7 percent. Persistent and high trade deficit continues to be a concern for the Turkish economy. We believe that the uncertainty in the Middle East will have an
adverse impact on Turkish exports but will remain small.
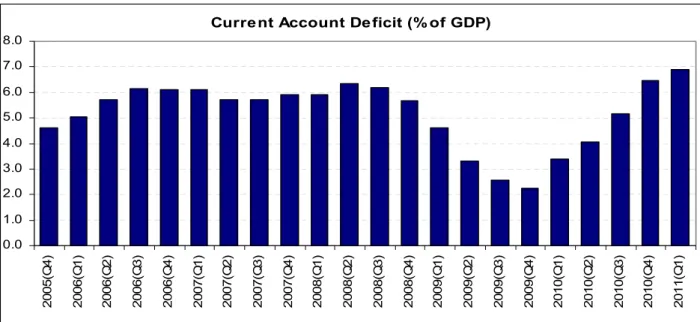
Current account deficit
Trade deficit and the current account deficit were $7.3 billion and $5.8 billion in January, respectively. Current account deficit nearly doubled compared to same month of previous year and it is still important for the financial stability of Turkish economy in 2011. However, when compared to December and November figures, it seems to have slowed down. March numbers will reveal more information about whether the Turkish Central Bank’s policy mix is effective on curbing “hot money” or not.
If current account deficit does not slow down in the second quarter, it can reach 7.0 – 7.2 percent (in part due to strong base effect). However, with diminishing base effect in second half of 2011 and real GDP growth staying around 5.0 – 5.5 percent in 2011, current account deficit might start to decrease in the second half.
Figure 3 shows the current account deficit as percent of GDP. Before the global crisis hit, in the second quarter of 2008, the current account deficit reached its highest point, 6.4 percent of GDP, and then fell as low as 2.3 percent during the crisis. Fueled by the fast recovery in the economy the current account deficit up to an estimated 6.5 percent by the end of 2010, according to Betam’s forecasts and we expect it to reach 6.9 percent in the first quarter of 2011.
Forecasts
Betam releases its GDP and current account forecasts on a monthly basis and revises its forecasts every month after updating its monthly indicators. Table 1 summarizes Betam’s year-on-year and quarter-on-quarter forecasts of real GDP. We expect the real GDP to grow by 1.3 percent in the first quarter from the previous quarter and grow by 8.7 percent in the first quarter from same quarter of previous year.
Betam’s growth forecasts for the 4th quarter are 2.6
percent quarter on quarter and 7.7 percent year on year. 2010 annual growth rate forecast still stands at 8.9 percent.
We also expect that ratio of current account deficit to GDP was 6.5 percent for 2010, and in the first quarter of 2011 it will reach 6.9 percent.
Table 2. Monthly and quarterly changes of Betam’s selected indicators Indicators Decemb er January February 2010 4th Quarter 2011 1st Quarter1 Imports
Intermediate goods import 6.7 -3.5 ** 6.8 1.8
Consumer goods import 9.7 -9.4 ** 13.4 -3.9
Investment goods import 10.6 -16.8 ** 26.6 -9.5
Industrial Production Index (IPI) **
Nondurable consumer goods 2.6 1.0 ** 1.3 2.4
Durable consumer goods 9.3 6.5 ** 1.6 6.8
Intermediate goods 3.0 0.7 ** 4.7 3.2
Investment goods 20.1 -1.9 ** 15.5 7.5
Capacity Utilization Rate (CUR)
Nondurable consumer goods 0.2 -0.4 0.3 1.3 -0.3
Durable consumer goods 0.6 1.6 -0.1 2.1 2.5
Intermediate goods 2.9 -0.1 -1.1 3.2 0.8
Investment goods 0.3 1.3 -0.1 2.4 2.7
Soft Data
Consumer confidence index (Turkstat) -0.3 0.0 1.3 3.1 1.2
Reel sector confidence index 1.3 -1.1 -3.1 8.9 -1.0
Financial Data
IMKB 100 (Stock Exchange) -4.0 -0.3 -2.3 9.4 -3.7
Other
Special consumer tax* (SCT) 3.1 -4.5 -4.2 7.7 -5.0
Automobile production 13.4 -4.7 3.4 13.4 3.0
Source: TurkStat, TCMB, Treasury, IMKB, Betam. All series are real (or inflation adjusted wherever necessary) and seasonally adjusted.
*This tax is collected on sales of goods such as gas, fuel oils, alcohol, tobacco products and automobiles. **Data not yet released.
1
2011 first quarter changes of indicators are based on forecasts which are calculated using January and February data (if available).
Figure 1: Capacity utilization rate and industrial production index (sa, left axis for CUR and right axis for IPI)
60 65 70 75 80 85 Ja n-07 A pr-0 7 Ju l-0 7 Oc t-07 Ja n-08 A pr-0 8 Ju l-0 8 Oc t-08 Ja n-09 A pr-0 9 Ju l-0 9 Oc t-09 Ja n-10 A pr-1 0 Ju l-1 0 Oc t-10 Ja n-11 95 100 105 110 115 120 125 130 135 CUR IPI
Source : TurkStat, Betam
Figure 2: Volume indices of exports and imports (sa) 120.00 130.00 140.00 150.00 160.00 170.00 180.00 190.00 200.00 210.00 Ja n-07 May -07 S ep-07 Ja n-08 May -08 S ep-08 Ja n-09 May -09 S ep-09 Ja n-10 May -10 S ep-10 Ja n-11 Export Import
Source : TurkStat, Betam
Figure 3: Ratio of current account deficit to GDP (annual)
Current Account Deficit (% of GDP)
0.0 1.0 2.0 3.0 4.0 5.0 6.0 7.0 8.0 2 005( Q 4 ) 2 006( Q 1 ) 2 006( Q 2 ) 2 006( Q 3 ) 2 006( Q 4 ) 2 007( Q 1 ) 2 007( Q 2 ) 2 007( Q 3 ) 2 007( Q 4 ) 2 008( Q 1 ) 2 008( Q 2 ) 2 008( Q 3 ) 2 008( Q 4 ) 2 009( Q 1 ) 2 009( Q 2 ) 2 009( Q 3 ) 2 009( Q 4 ) 2 010( Q 1 ) 2 010( Q 2 ) 2 010( Q 3 ) 2 010( Q 4 ) 2 011( Q 1 )
Figure 4: Monthly changes of manufacturing industry exports, December 2010 and January 2011 (sa)
Source: TurkStat, Betam
January 2011 -35.00% -30.00% -25.00% -20.00% -15.00% -10.00% -5.00% 0.00% 5.00% 10.00% M anuf ac tu ring F ood pr oduc ts and T abac co pr oduc ts T ex til e goo ds C lot hi ng goods F ur s l eat her and p ro duc ts W ood and co rk pr oduc ts P ape r a nd paper C ok ing c oal , re fined p et . C hem ic al s Pl as tic a nd rubber O ther non-m et all ic Me ta l i nd us tr y Me ta l pr odu ct s ( not M ac hi ner y and E lec tr ic al m ac hi nar y R adi o, te le vi si on a nd Mo to r ve hi cl es a nd F ur ni tur e a nd ot her December 2010 -15.00% -10.00% -5.00% 0.00% 5.00% 10.00% 15.00% 20.00% 25.00% 30.00% M anuf ac tu ring F ood pr oduc ts and T abac co pr oduc ts T ex til e goo ds C lot hi ng goods F ur s l eat her and p ro duc ts W ood and co rk pr oduc ts P ape r a nd paper C ok ing c oal , re fined p et . C hem ic al s Pl as tic a nd rubber O ther non-m et all ic Me ta l i nd us tr y Me ta l pr odu ct s ( not M ac hi ner y and E lec tr ic al m ac hi nar y R adi o, te le vi si on a nd Mo to r ve hi cl es a nd F ur ni tur e a nd ot her