www.betam.bahcesehir.edu.tr
1
ECONOMIC SLOWDOWN LOWER THAN EXPECTED
Seyfettin Gürsel•, Zümrüt İmamoğlu‡ ve Barış Soybilgen†
Executive Summary
According to data released by Turkstat, Turkey’s real GDP increased at an annual rate of 8.8 percent in the first quarter of 2011 from the same quarter of the previous year. In the first quarter of 2011 the year on year (YoY) growth was 11.6 percent. These figures show that economic growth is slowing down. As emphasized in our previous Growth Review, we believe that the growth rate will remain in single-digit for a considerable time. We expected the slowdown to be faster and the YoY growth rate to be around 6.4 percent. However, investment demand was stronger than predicted and continued to grow despite the decrease in industrial production in the third quarter. We believe that investment demand was driven by a surge in purchases of investment goods before the elections in mid-June because many investors believed that the loan rates would go up after the elections.
Turkstat announced that seasonally adjusted GDP increased by 1.3 percent from the 1st quarter of 2011 to the 2nd quarter of 2011. The quarter on quarter (QoQ) growth rate in the previous quarter was 1.7 percent. Betam had expected almost no QoQ growth in the second quarter. As we predicted contribution of consumption and net exports to GDP growth were very low. The main source of economic growth was investment demand and the increase in government expenditures. Betam’s annual current account deficit forecast was 9.3 of GDP for the 2nd quarter and according to Turkstat releases, it is officially 9,2 percent.
•Seyfettin Gürsel, Betam, Director.
‡ Zümrüt İmamoğlu, Betam, Research Associate.
† Barış Soybilgen, Betam, Research Assistant.
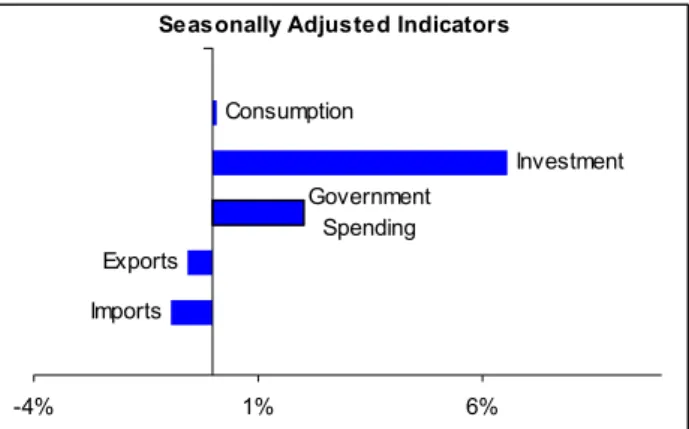
Figure 1: GDP components: Change from the previous quarter
Seasonally Adjusted Indicators
Imports Exports Government Spending Investment Consumption -4% 1% 6%
Source: Turkstat, Betam. Quarterly indicators are seasonally adjusted and calendar day corrected
Figure 2: contributions to real GDP Growth (2011 – Second Quarter)
Seasonally Adjusted Indicators
Imports Exports Inventory Investment Government Spending Investment Consumption -1% 0% 1% 2% 3% Total Grow th: %2.2
Source: Turkstat, Betam. Quarterly indicators are seasonally adjusted and calendar day correcte
Growth is driven by private investment
To analyze the contributions of GDP components to growth, Betam seasonally adjusts and calendar day corrects each component of GDP separately.
Growth Review:
2011, 2
nd
Quarter
www.betam.bahcesehir.edu.tr
2
Figure 1 and Figure 2 show the change in GDPcomponents and their contributions to growth in the 2nd quarter in regard to the previous quarter.1
The greatest contribution to growth came from the increase in private investment. Investment increased by 6.7 percent quarterly and it contributed 1.5 percentage points to quarterly real GDP growth. Thus, a large fraction of the increase in GDP resulted from the increase in private investment.
Consumption decelerated
In the second quarter of 2011, the increase in private investment demand was as low as 0.1 percent and contributed only 0.06 percentage points to real GDP growth. Low consumption demand is the main reason for the economic slowdown in the 2nd quarter. Deceleration in consumption also caused an increase in inventory investment. Note that the change in inventory investment contributed 0.3 percentage points to growth in the 2nd quarter
Government expenditures increased
In the 1st quarter of 2011, government expenditures decreased by 1.9 percent quarterly and subtracted 0.3 percentage points from the quarterly real GDP growth. In the second quarter, government expenditures increased by 2.0 percent and contributed 0.3 percentage points to real GDP growth. The figures point out that the government sought to loosen the spending to a certain degree in the election period. In the coming quarters, contributions from government expenditures should remain limited in order to reduce the already high current account deficit.
Net exports contribution is positive
In the 2nd quarter, exports decreased by 0.6 percent and subtracted 0.1 percentage points from the quarterly real GDP growth. The primary reason of this negative contribution is the ongoing turmoil in
1
T
he sum of contributions of GDP components points to a 2,2 percentage increase in real GDP growth from the the 4th quarter to the 1st quarter. We should note that this figure is different from Turkstat’s figure of 1,3 percent. The difference is due to Betam’s deseasonalization of the GDP components separately. The details on the methodoly is given below in Box1.Middle East in the 2nd quarter of 2011. Besides, significant slowdown in European economy had a negative impact on the exports in the 2nd quarter. Nevertheless, we believe that the significant depreciation of Turkish Lira in recent months will help increase the exports in the coming quarters. Imports, on the other hand, are gradually decreasing in parallel with the slowing economy. In the second quarter, imports decreased by 0.9 percent and contributed to growth by 0.3 percentage points. We expect imports to continue to decline in the coming quarters and help abbreviate the current account deficit problem.
Short-run growth
Betam, in its Economic Outlook and Forecast Briefs (June, July and August 2011), had forecasted 0.1 percent QoQ growth from the 1st quarter of 2011 to the 2nd quarter of 2011 and 6.4 percent YoY growth. Turkstat announced the QoQ growth rate as 1.3 percent and YoY growth rate as 8.8 percent. Betam’s forecast error is due, to a large extent, to the unexpected increase in investment demand. Betam’s annual current account deficit forecast was 9.3 percent of GDP for the 1st quarter and according to Turkstat releases, it is officially 9.2 percent. Betam will announce its first forecast for the 3rd quarter of 2011 in “Economic Outlook and Forecast Brief (September) which will be published this week. Figure 3 : Quarter-on-quarter real GDP growth
Seasonally Adjusted Indicators
-8% -6% -4% -2% 0% 2% 4% 6% 2007( 1) 2007( 2) 2007( 3) 2007( 4) 2008( 1) 2008( 2) 2008( 3) 2008( 4) 2009( 1) 2009( 2) 2009( 3) 2009( 4) 2010( 1) 2010( 2) 2010( 3) 2010( 4) 2011( 1) 2011( 2)
www.betam.bahcesehir.edu.tr
3
Box 1: Calculation of quarterly GDP growth and contributions.
Sub-components of GDP are grouped into 3 categories:
1. Final domestic demand consist of final consump-tion expenditure of resident households (Con-sumption), sum of government final consumption and investment expenditure (Government ex-penditure), investment expenditure of private sector (Investment)
2. Net foreign demand for goods and services rep-resents the difference between exports and imports of goods and services.
3. Change in inventories (stocks) shows how stocks changes with compared to previous quarter (for details look Box 2)
In order to find quarterly GDP growth, the following formulation is used for all sub components of GDP separately:
Since X represents 'Change in GDP component' Contribution of X to growth can be calculated as follows:
= (Xt– Xt-1) / GDPt-1
Differences between the methodologies used by Betam and TurkStat in seasonally adjusting the real GDP
TurkStat seasonally adjusts and calendar day corrects total GDP series but not its components separately. However, each component of GDP may show different seasonal characteristics. Therefore, Betam eliminates the effects of seasonality and calendar day from the components separately and constructs the adjusted GDP series as the sum of the adjusted components. These two methodologies yield quantitatively different results and both of them are used frequently in the related literature.
Box 2: Change in inventories (stocks) and its contribution to growth
'Stock change' shows that how stocks change compared to previous period
Stock change t = Stock t – Stock t-1
Therefore increase (decrease) in inventories is caused by increase (decrease) in the difference between two period rather than increase (decrease) in stocks. However, TurkStat estimates the change in stocks is as residual between production and expenditure accounts. Moreover this sub-component also includes statistical discrepancy.
Let's say the difference between production and expenditure account εt-1, 'stock change' in time t is as
follows:
Stock changet = Stock t – Stock t-1 + εt-1
Finally, contribution of change in 'Stock change' can be found as follows:
Contribution of 'Stock change t = (Stock t – Stock t-1) / GDP t-1
or
Contribution of 'Stock change t = ((Stock t – Stock t-1 + εt )