Cardiovascular Topics
Anatomical and functional changes after aortic valve
replacement with different sizes of mechanical valves
Gokhan Ilhan, Sahin Bozok, Berkan Ozpak, Hakan Kara, Serkan Yazman, Serdar Bayrak, Ibrahim
Ozsoyler, Ali Gurbuz
Abstract
Objective: To date, there is no consensus on the selection of type and size of prosthetic valve for aortic valve replacement (AVR). The aim of this study was to compare anatomical and functional changes occurring in the left ventricle after AVR with different sizes of mechanical valves.
Methods: A total of 92 patients with serious aortic valve stenosis, who underwent AVR between March 2001 and June 2008 using mechanical valves of different sizes, were retrospectively analysed. The sizes of the mechanical valves were 19, 21, 23 and 25 mm. All patients were assessed pre-operatively, and at six months and in the first, third and fifth years postoperatively. The left ventricle was assessed with electrocardiography, echocardiography and telecardiography and compared in the four patient groups, constituted accord-ing to the mechanical valve size used.
Results: In all groups, left ventricular mass and mass index, transvalvular aortic gradient, thicknesses of the
interventri-cular septum and posterior wall, and left ventriinterventri-cular end-systolic and end-diastolic diameters had decreased signifi-cantly post surgery. Left ventricular ejection fraction and exercise capacity had increased significantly (p < 0.001). The most noteworthy anatomical and functional improve-ments were seen in patients who had received 23- and 25-mm mechanical valves.
Conclusion: Mechanical valve replacement should not be performed with small size valves because of the higher residual gradient.
Keywords: aortic valve stenosis, heart valve prosthesis implanta-tion, heart ventricles
Submitted 18/10/16, accepted 24/6/18
Cardiovasc J Afr 2018; 29: online publication www.cvja.co.za DOI: 10.5830/CVJA-2018-037
Aortic stenosis results from narrowing of the aortic valve orifice, which blocks the outflow from the left ventricle. Increased intra-cavitary pressure causes elevated left ventricular pressure and amplifies myocardial wall stress, which subsequently leads to left ventricular concentric hypertrophy. Therefore, compensatory left ventricular hypertrophy (LVH) is an adaptive mechanism against elevated intra-cavitary pressure.1
LVH is an independent factor for cardiovascular mortality, and gradual thickening of the ventricle wall diminishes its compliance and is reflected as increased left ventricular end-diastolic pressure. In advanced stages of the disease, decreases in cardiac output, ejection fraction and transaortic gradient are observed.2
Surgical treatment for aortic stenosis aims to correct the valvular pathology and relieve the pressure load on the left ventricle, resulting in reversal of the pathological anatomical changes and restoration of function.3 Regression of LVH and
other related anatomical changes after aortic valve replacement (AVR) appears to affect long-term survival rates significantly.4
To date, there is no consensus on the selection of type and size of prosthetic valve for AVR. Ideally, a prosthetic valve should have a long duration and should be similar to the original valve. The aim of this study was to compare anatomical and functional changes occurring in the left ventricle after AVR with different sizes of mechanical valves.
Department of Cardiovascular Surgery, Faculty of Medicine, Recep Tayyip Erdogan University, Rize, Turkey
Gokhan Ilhan, MD
Department of Cardiovascular Surgery, Faculty of Medicine, Usak University, Usak, Turkey
Sahin Bozok, MD, [email protected]
Department of Cardiovascular Surgery, Çorlu State
Hospital, Tekirdağ, Turkey
Berkan Ozpak, MD
Department of Cardiovascular Surgery, Ada Hospital, Giresun, Turkey
Hakan Kara, MD
Department of Cardiovascular Surgery, Training and Research Hospital, Mugla Sitki Kocman University, Mugla, Turkey
Serkan Yazman MD
Department of Cardiovascular Surgery, Faculty of Medicine, Dokuz Eylul University, Izmir, Turkey
Serdar Bayrak, MD
Department of Cardiovascular Surgery, Atatürk Training and Research Hospital, Izmir Katip Celebi University, Izmir, Turkey
Ibrahim Ozsoyler, MD Ali Gurbuz, MD
Methods
The study was conducted in accordance with the principles of the Helsinki Declaration. It was approved by the local institutional review board (17/08). Informed consent was obtained from all patients with regard to serious aortic stenosis for AVR operation.
This cohort study was performed in the cardiovascular surgery department of a tertiary care centre on 98 patients with serious aortic stenosis. They underwent AVR surgery between March 2001 and June 2008. The inclusion criterion was severe symptomatic aortic stenosis.
Exclusion criteria were a previous history of coronary or other cardiac valvular surgery, left ventricular ejection fraction < 30%, contra-indication for the placement of a bioprosthetic valve, and unwillingness to participate in the study. A total of six patients were excluded since four died due to cardiac and multiple organ failure in the postoperative period, and two cases were lost to follow up.
Patients were operated on using Bileaflet (St Jude Medical, St Paul, MN, USA) and Carbomedics (Sorin Group, Milan, Italy) mechanical valvular prostheses and they were divided into four groups according to the size of the valves. Demographic and clinical data were recorded, and pre- and postoperative functional capacities were determined with regard to New York Heart Association (NYHA) functional class.5 Pre-operative
evaluations consisting of echocardiography, electrocardiography and telecardiography were performed to determine the anatomical and functional condition of the left ventricle.
Left ventricular ejection fraction (LVEF), aortic valve area (AVA), peak aortic valve gradient (PAG), mean aortic valve gradient (MAG), left ventricular end-systolic and end-diastolic diameters (LVESD, LVEDD), thickness of the posterior wall (PWT) and interventricular septum (IVST), as well as left ventricular mass (LVM) and mass index (LVMI) were measured. Durations of aortic cross-clamp, cardiopulmonary bypass, intensive care unit stay and hospitalisation were noted.
Patients were re-assessed postoperatively regarding clinical and echocardiographic findings in the sixth month, and first, third and fifth years. Four patient groups were created according to the mechanical valve sizes used. Comparisons of pre- and postoperative results, as well as postoperative changes, were carried out both within and between groups.
Transthoracic echocardiography was performed using a 3-MHz transducer of the SyncMaster 550b Vivid 3 device (Samsung Electronics Co Ltd, San Jose, CA, USA). Continuous-wave, pulsed-wave and colour Doppler as well as M-mode images were obtained from two-dimensional views, according to the criteria defined by the American Echocardiography Society guidelines.6
Left parasternal, apical, subcostal and suprasternal images were routinely taken pre-operatively. Anatomical variables were measured and noted.
M-mode echocardiography was used to assess end-systolic and end-diastolic diameters in addition to the thickness of the interventricular septum. The average of three heart beats was used for patients in sinus rhythm, while six beats were taken into account for cases with atrial fibrillation. Aortic valve area was calculated using the continuity equation.7
Estimation of LVM was done using the modified Devereux and Reichek formulae:8
LVM (g) = 0.8 × 1.04 × [(LVEDD + IVS + PWT)3 – LVEDD3] + 0.6
where LVEDD = end-diastolic diameter of the left ventricle, IVS = interventricular septum, PWT = posterior wall thickness.8
Then left ventricular mass index (LVMI, g/m2) was obtained
with the following formula: LVM/body surface area.
Trans-valvular pressure gradients were calculated via the simplified Bernoulli equation using values obtained from Doppler echocardiography measurements (continuous wave, pulsed wave and colour modes). The average pressure gradient was the average of all gradients during the whole flow period, and it was calculated from the area below the flow curve.9
Ejection fraction of the left ventricle was assessed by the modified Simpson’s method.10
Electrocardiography: the majority of patients with aortic stenosis exhibit voltage changes due to left ventricular pressure load. Patients operated on with different-sized mechanical valves were compared with regard to ECG criteria.11
Telecardiography: the size and shape of the heart, as well as the position of the great vessels and pulmonary vascularisation should be considered in the evaluation of congenital and acquired cardiac diseases. Cardiothoracic ratio is the maximal cardiac diameter divided by the maximal horizontal thoracic diameter (inner edge of ribs/edge of pleura).11 A normal measurement
should be less than 0.5. Cardiothoracic ratios were compared pre- and postoperatively.
All patients were operated on under standard general anaesthesia techniques. A central venous line was provided by placing an 8.5-F percutaneous catheter into the right internal jugular vein (Swan-Ganz catheter, 7-F Multiflex thermodilution catheter, Abbott Critical Care Systems, North Chicago, IL, USA). Monitoring of the central venous, right atrial, right ventricular, pulmonary arterial and pulmonary artery wedge pressures was done.
For anticoagulation, heparin was administered at a dose of 300 U/kg. After a median sternotomy, arterial cannulation was performed via the ascending aorta, while venous cannulation was accomplished with a ‘two-stage’ cannula through the right atrial appendix. Moderate hypothermia (rectal temperature: 28–30°C) was provided. Hypothermic blood cardioplegia, applied directly antegradely or retrogradely through the coronary sinus, was used for protection of the myocardium. An oblique aortotomy was performed in all patients. Advanced calcification was observed in 20 patients who underwent decalcification.
Bileaflet mechanical valves were implanted as the central axes of the valves were parallel to the septum and separated 2/0 Ticron pledgeted sutures (Covidien Ltd, Dublin, Ireland) were used for this purpose. Pledgets were placed in the sub-annular plane in 24 patients who had a weak aortic annulus or who underwent decalcification.
The Nicks procedure for aortic root enlargement was performed in 10 patients with a narrow aortic root. Prosthetic valve no 19 was used in four patients, while no 21 and 23 valves were preferred in two and four patients, respectively. In three patients in whom no 19 and 23 prosthetic valves were used, pledgets were placed outside the aortic wall in the non-coronary annular region. Composite graft replacement using the Buton–Bentall technique was performed in three patients due to post-stenotic dilatation. An aortotomy was repaired using two pledged 4/0 non-absorbable monofilament continuous sutures. Numbers 19, 21, 23 and 25 prosthetic valves were therefore used in eight (8.6%), 38 (41.3%), 40 (43.4%) and six (6.5%) patients, respectively.
For postoperative care, oral anticoagulants (warfarin sodium) were administered routinely in addition to subcutaneous low-molecular-weight heparin, starting from the first postoperative day. Prothrombin time and INR values were maintained in a range of 1.5–2.0 times the control values. Patients were re-evaluated regarding clinical and echocardiographic findings in the sixth month, and the first, third and fifth years.
Statistical analysis
Analysis of data was carried out using Statistical Package for Social Sciences Program version 14.0 (SPSS Inc, Chicago, IL, USA). Level of significance was set at p < 0.05. Clinical parameters are expressed as mean ± standard deviation. Comparison of ratios between groups was assessed with chi-squared, Pearson’s chi-squared and Fisher’s exact tests. The t-test and Mann–Whitney U-test were performed for analysing average values of the groups. Pre- and postoperative changes in the same group were evaluated with the t-test and Wilcoxon signed rank test. Correlation between variables was done with Spearman’s correlation test.
Results
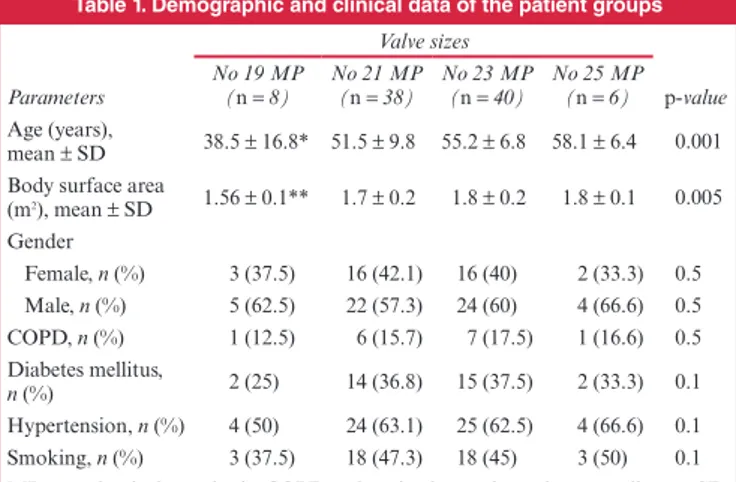
When we compared baseline demographic data, patients that received no 19 prosthetic valves were younger, thinner and had a smaller body surface area than patients receiving nos 21, 23 and 25 valves. Gender, New York Heart Association score and other demographic variables did not exhibit any significant difference between the groups (Table 1).
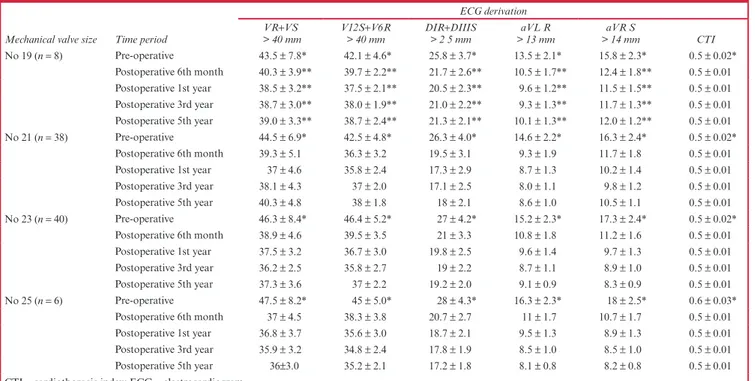
Aortic valve area and mean diameter of the aortic annulus was significantly lower in patients receiving no 19 valves. The four groups did not seem to differ regarding left ventricular ejection fraction, maximum and mean flow gradients, end-systolic and end-diastolic left ventricular diameters, thicknesses of the interventricular septum and posterior wall and left ventricular mass index. Similarly, electrocardiography and telecardiography measurements did not reveal any significant differences between the groups (Tables 2, 3).
There were no significant differences between the four groups with regard to surgical data such as duration of aortic
cross-clamp, cardiopulmonary bypass, and intensive care unit and hospital stay (Table 2). In all groups postoperatively, the controls did not yield any significant differences within each group and between groups regarding heart rate, arterial tension and left atrial diameter (p = 0.12).
Assessment of results within each group postoperatively demonstrated that patients operated on using no 19 prosthetic valves had improved ejection fraction and effort capacity. Moreover, LVESD, LVEDD, PWT, IVST, PAG, MAG, LVM and LVMI had decreased significantly. These changes were most obvious for LVM and LVMI in all groups postoperatively (p = 0.001, for all postoperative periods) (Table 4).
For patients operated on with nos 21, 23 and 25 prosthetic valves, both ejection fraction and effort capacity were increased postoperatively. There were also significant reductions in MAG, IVST, PWT, LVESD, LVEDD, LVM and LVMI. Interestingly, reductions in LVM and LVMI were less obvious after the third year postoperatively. The most dramatic changes in LVM and LVMI occurred in the sixth month postoperatively; however, this became less evident in the following years (Table 4).
When the patient groups operated on with different-sized mechanical prosthetic valves were assessed together, the most obvious reductions in LVM, LVMI, MGR, PGR, IVST, PWT, LVESD and LVEDD were noted in patients who received nos 23 and 25 valves. The least obvious changes occurred in the group operated on with no 19 valves. Similarly, the most noteworthy improvements in ejection fraction and effort capacity were observed in patients in whom nos 23 and 25 valves were inserted.
Table 1. Demographic and clinical data of the patient groups
Valve sizes
p-value
Parameters No 19 MP (n = 8) No 21 MP(n = 38) No 23 MP(n = 40) No 25 MP (n = 6) Age (years),
mean ± SD 38.5 ± 16.8* 51.5 ± 9.8 55.2 ± 6.8 58.1 ± 6.4 0.001 Body surface area
(m2), mean ± SD 1.56 ± 0.1** 1.7 ± 0.2 1.8 ± 0.2 1.8 ± 0.1 0.005 Gender Female, n (%) 3 (37.5) 16 (42.1) 16 (40) 2 (33.3) 0.5 Male, n (%) 5 (62.5) 22 (57.3) 24 (60) 4 (66.6) 0.5 COPD, n (%) 1 (12.5) 6 (15.7) 7 (17.5) 1 (16.6) 0.5 Diabetes mellitus, n (%) 2 (25) 14 (36.8) 15 (37.5) 2 (33.3) 0.1 Hypertension, n (%) 4 (50) 24 (63.1) 25 (62.5) 4 (66.6) 0.1 Smoking, n (%) 3 (37.5) 18 (47.3) 18 (45) 3 (50) 0.1 MP = mechanical prosthesis; COPD = chronic obstructive pulmonary disease; SD = standard deviation.
*p = 0.001, statistically significant difference in terms of age between the group with no 19 prosthesis and the other groups.
**p = 0.005, statistically significant difference in terms of body surface area between the group with no 19 prosthesis and the other groups.
Table 2. Pre-operative, operative and postoperative variables in the patient groups
Valve sizes p-value Time periods and variables No 19 MP (n = 8) No 21 MP (n = 38) No 23 MP (n = 40) No 25 MP (n = 6) Pre-operative LVEF (%) 56.6 ± 3.5 54.5 ± 3.2 53.6 ± 3.5 54.8 ± 4.5 0.15 Aortic valve area
(cm2) 0.9 ± 0.1* 1.0 ± 0.1 1.1 ± 0.1 1.1 ± 0.2 0.001 Annulus diameter (mm) 22.8 ± 1.3** 24.2 ± 1.1 25.7 ± 0.7 27.2 ± 0.9 0.001 PAG (mmHg) 78.6 ± 5.5 80.3 ± 5.2 83.5 ± 4.5 85.2 ± 4.7 0.2 MAG (mmHg) 38.8 ± 4.5 49.7 ± 5.0 47.8 ± 6.0 48.5 ± 5.8 0.18 LVEDD (mm) 54.2 ± 4.6 55.8 ± 5.2 56.5 ±6.3 57.8 ± 6.0 0.08 LVESD (mm) 35.5 ± 3.5 37.2 ± 3.3 38.1 ± 3.3 39.5 ± 4.0 0.1 IVST (mm) 14.6 ± 1.9 15.5 ± 1.8 15.7 ± 2.2 15.9 ± 2.0 0.09 LVMI (g/m2) 216.0 ± 24.4 224.7 ± 36.4 226.1 ± 45.3 235 ± 53.6 0.5 Intra-operative Cross-clamp duration (min) 70.3±3.7 63±4.6 59.7±4.2 62.2±4.3 0.06 Cardiopulmonary bypass duration (min) 96.5 ± 3.9 84.1 ± 4.9 82.6 ± 4.2 80.7 ± 3.6 0.08 Post-operative
ICU stay (hours) 44 ± 7.1 38.5 ± 5.4 37.4±3.2 39.6 ± 4.5 0.73 Duration of
hospitalisation
(days) 6.8 ± 1.2 7.2 ± 1.3 7.0 ± 1.1 6.9 ± 1.1 0.51 MP = mechanical prosthesis; LVEF = left ventricular ejection fraction; PAG = peak aortic gradient; MAG = mean aortic gradient; LVESD = left ventricular end-systolic diameter; LVEDD = left ventricular end-diastolic diameter; IVST = interventricular septum thickness; LVMI = left ventricular mass index; ICU = intensive care unit. *p = 0.001, statistically significant difference in terms of aortic valve area between the group with no 19 prosthesis and the other groups.
**p = 0.001, statistically significant difference in terms of annulus diameter between the group with no 19 prosthesis and the other groups.
Cases operated on with no 19 valves displayed a less prominent improvement (Table 4).
The functional improvements and anatomical changes were observed most clearly in the sixth month postoperatively. These
changes were less evident after the first year in patients receiving no 19 prosthetic valves. Correspondingly, improvements seemed to be less clear after the third year for cases operated on with no 23 valves (Table 4).
Table 4. Functional and anatomical changes observed after AVR in patient groups operated on with different sized prostheses
Mechanical
valve size Time period
Functional and anatomical changes EF
(%) (mmHg)PAG (mmHg)MAG LVESD (mm) LVEDD (mm) (mm)IVST (mm)PWT (g/mLVMI 2)
NYHA Score No 19 (n = 8) Pre-operative 56.6 ± 3.5* 78.6 ± 5.5* 38.8 ± 4.5* 35.5 ± 3.5* 54.2 ± 4.6* 14.6 ± 1.9* 13.8 ± 1.7* 216.0 ± 24.4* 2.9 ± 0.4* Postoperative 6th month 60 ± 3 36.2 ± 2.5 22.2 ± 2.1 32.7 ± 3.2 50.3 ± 5.0 12.8 ± 1.5 12.5 ± 1.2 162.8 ± 19.1 2.1 ± 0.3 Postoperative 1st year 62.5 ± 4 30.3 ± 2.1† 19.4 ± 2.3† 30.1 ± 3.0† 47.5 ± 2.3† 12.3 ± 1.3† 11.8 ± 1.0† 139.1 ± 12.9† 2.0 ± 0.3 Postoperative 3rd year 61.3 ± 5 31.6 ± 3.2† 20.5 ± 1.9† 30.9 ± 2.5† 48.0 ± 3.0† 12.6 ± 1.2† 12.0 ± 1.3† 141.8 ± 14.7† 1.9 ± 0.2 Postoperative 5th year 60 ± 3.2 33.5 ± 4.0† 21 ± 4.5† 31.7 ± 3.7† 48.5 ± 4.5† 12.7 ± 1.3† 12.3 ± 1.1† 147.5 ± 17.3† 2.0 ± 0.4 No 21 (n = 38) Pre-operative 54.5 ± 3.2* 80.3 ± 5.2* 49.7 ± 5.0* 37.2 ± 3.3* 55.8 ± 5.2* 15.5 ± 1.8* 14.5 ± 1.8* 224.7 ± 36.4* 3.2 ± 0.3* Postoperative 6th month 60.8 ± 2.6 32.2 ± 2.2 22.4 ± 1.9 34.5 ± 2.5 51.3 ± 4.0 13.8 ± 1.7 12.7 ± 1.5 164.7 ± 32.5 1.9 ± 0.2 Postoperative 1st year 62 ± 4.5 26.3 ± 2.6 18.4 ± 2.5 32.4 ± 3.0 48.7 ± 3.7 12.9 ± 1.5 12.3 ± 1.3 141.1 ± 26.8 1.7 ± 0.2 Postoperative 3rd year 62 ± 4 23.0 ± 1.9 16.5 ± 1.5 31.2 ± 2.3 48.0 ± 4.3 12.4 ± 1.3 11.8 ± 1.2 130.5 ± 18.7 1.6 ± 0.4 Postoperative 5th year 61 ± 3 25.2±2.6‡ 17±3.2‡ 31.3±3.2‡ 48.5±3.5‡ 12.6 ± 1.1‡ 11.9 ± 1.0‡ 135.8 ± 20.5‡ 1.6 ± 0.3 No 23 (n = 40) Pre-operative 53.6 ± 3.5* 83.5 ± 4.5* 47.8 ± 6.0* 38.1 ± 3.3* 56.5 ± 6.3* 15.7 ± 2.2* 14.8 ± 1.7* 226.1 ± 45.3* 3.2 ± 0.3* Postoperative 6th month 60.5 ± 3 34.2 ± 2.9 23.2 ± 2.7 35.3 ± 2.2 51.7 ± 5.4 13.8 ± 1.8 12.9 ± 1.3 163.0 ± 35.3 1.8 ± 0.3 Postoperative 1st year 62.3 ± 4 28.5 ± 2.3 17.4 ± 1.5 33.4 ± 2.5 49.8 ± 4.7 12.7 ± 1.6 12.3 ± 1.4 139.7 ± 28.7 1.5 ± 0.2 Postoperative 3rd year 62.5 ± 3.5 26 ± 3.5 15.2 ± 1.8 32.8 ± 3.1 48.4 ± 3.5 12.3 ± 1.3 11.8 ± 1.2 126.8 ± 23.5 1.3 ± 0.3 Postoperative 5th year 62.2 ± 3.2 21 ± 2.7 14.1 ± 2.5 31.2 ± 3.0 47.5 ± 3.0 11.8 ± 1.1 11.5 ± 1.3 117.6 ± 21.6 1.2 ± 0.4 No 25 (n = 6) Pre-operative 54.8 ± 4.5* 85.2 ± 4.7* 48.5 ± 5.8* 39.5 ± 4.0* 57.8 ± 6.0* 15.9 ± 2.0* 15.1 ± 2.0* 235 ± 53.6* 3.2 ± 0.2* Postoperative 6th month 61.7 ± 3 33.4 ± 2.6 22.6 ± 2.2 36.3 ± 2.5 52.0 ± 5.4 14.0 ± 1.5 13.1 ± 1.2 164.3 ± 38.7 1.8 ± 0.3 Postoperative 1st year 63 ± 4 24.5 ± 2.8 16.0 ± 2.1 33.2 ± 2.0 49.5 ± 4.5 13.0 ± 1.5 12.3 ± 1.3 137.8 ± 33.5 1.5 ± 0.4 Postoperative 3rd year 64 ± 5 22.5 ± 3.0 14.7 ± 1.6 31.5 ± 3.0 48.7 ± 4.3 12.5 ± 1.2 11.9 ± 1.2 127.2 ± 30.7 1.3 ± 0.3 Postoperative 5th year 63.3 ± 2.8 19.3 ± 2.4 13.2 ± 2.5 30.2 ± 2.7 47.3 ± 3.5 11.8 ± 1.0 11.5 ± 1.3 113.8 ± 25.4 1.2 ± 0.2 EF = ejection fraction; PAG = peak aortic gradient; MAG = mean aortic gradient; LVESD = left ventricular systolic diameter; LVEDD = left ventricular end-diastolic diameter; IVST = interventricular septum thickness; PWT = posterior wall thickness; LVMI = left ventricular mass index; NYHA = New York Heart Associa-tion.
*Statistically significant difference between all groups with regard to pre- and postoperative values.
†p = 0.005, significant difference between patients with no 19 prosthesis and patients receiving other sizes in terms of pre- and postoperative values. ‡p = 0.05, significant difference between patients receiving no 21 prosthesis and patients receiving no 23 and no 25 prostheses.
Table 3. Electrocardiogram and cardiothoracic index values of patients operated on with different sized mechanical valves
Mechanical valve size Time period
ECG derivation VR+VS
> 40 mm V12S> 40 mm+V6R DIR> 2 5 mm +DIIIS > 13 mmaVL R > 14 mmaVR S CTI
No 19 (n = 8) Pre-operative 43.5 ± 7.8* 42.1 ± 4.6* 25.8 ± 3.7* 13.5 ± 2.1* 15.8 ± 2.3* 0.5 ± 0.02* Postoperative 6th month 40.3 ± 3.9** 39.7 ± 2.2** 21.7 ± 2.6** 10.5 ± 1.7** 12.4 ± 1.8** 0.5 ± 0.01 Postoperative 1st year 38.5 ± 3.2** 37.5 ± 2.1** 20.5 ± 2.3** 9.6 ± 1.2** 11.5 ± 1.5** 0.5 ± 0.01 Postoperative 3rd year 38.7 ± 3.0** 38.0 ± 1.9** 21.0 ± 2.2** 9.3 ± 1.3** 11.7 ± 1.3** 0.5 ± 0.01 Postoperative 5th year 39.0 ± 3.3** 38.7 ± 2.4** 21.3 ± 2.1** 10.1 ± 1.3** 12.0 ± 1.2** 0.5 ± 0.01 No 21 (n = 38) Pre-operative 44.5 ± 6.9* 42.5 ± 4.8* 26.3 ± 4.0* 14.6 ± 2.2* 16.3 ± 2.4* 0.5 ± 0.02* Postoperative 6th month 39.3 ± 5.1 36.3 ± 3.2 19.5 ± 3.1 9.3 ± 1.9 11.7 ± 1.8 0.5 ± 0.01 Postoperative 1st year 37 ± 4.6 35.8 ± 2.4 17.3 ± 2.9 8.7 ± 1.3 10.2 ± 1.4 0.5 ± 0.01 Postoperative 3rd year 38.1 ± 4.3 37 ± 2.0 17.1 ± 2.5 8.0 ± 1.1 9.8 ± 1.2 0.5 ± 0.01 Postoperative 5th year 40.3 ± 4.8 38 ± 1.8 18 ± 2.1 8.6 ± 1.0 10.5 ± 1.1 0.5 ± 0.01 No 23 (n = 40) Pre-operative 46.3 ± 8.4* 46.4 ± 5.2* 27 ± 4.2* 15.2 ± 2.3* 17.3 ± 2.4* 0.5 ± 0.02* Postoperative 6th month 38.9 ± 4.6 39.5 ± 3.5 21 ± 3.3 10.8 ± 1.8 11.2 ± 1.6 0.5 ± 0.01 Postoperative 1st year 37.5 ± 3.2 36.7 ± 3.0 19.8 ± 2.5 9.6 ± 1.4 9.7 ± 1.3 0.5 ± 0.01 Postoperative 3rd year 36.2 ± 2.5 35.8 ± 2.7 19 ± 2.2 8.7 ± 1.1 8.9 ± 1.0 0.5 ± 0.01 Postoperative 5th year 37.3 ± 3.6 37 ± 2.2 19.2 ± 2.0 9.1 ± 0.9 8.3 ± 0.9 0.5 ± 0.01 No 25 (n = 6) Pre-operative 47.5 ± 8.2* 45 ± 5.0* 28 ± 4.3* 16.3 ± 2.3* 18 ± 2.5* 0.6 ± 0.03* Postoperative 6th month 37 ± 4.5 38.3 ± 3.8 20.7 ± 2.7 11 ± 1.7 10.7 ± 1.7 0.5 ± 0.01 Postoperative 1st year 36.8 ± 3.7 35.6 ± 3.0 18.7 ± 2.1 9.5 ± 1.3 8.9 ± 1.3 0.5 ± 0.01 Postoperative 3rd year 35.9 ± 3.2 34.8 ± 2.4 17.8 ± 1.9 8.5 ± 1.0 8.5 ± 1.0 0.5 ± 0.01 Postoperative 5th year 36±3.0 35.2 ± 2.1 17.2 ± 1.8 8.1 ± 0.8 8.2 ± 0.8 0.5 ± 0.01 CTI = cardiothoracic index; ECG = electrocardiogram.
*p = 0.05, statistically significant difference between pre-operative and postoperative periods with regard to ECG findings.
Electrocardiographic criteria signifying left ventricular hypertrophy and reduction of cardiothoracic index were most notably seen in patients who received nos 21, 23 and 25 mechanical valves. By contrast, the least remarkable improvement was observed in cases operated on with no 19 mechanical valves (Table 3).
Discussion
This study was performed to compare the functional and anatomical changes in patients who underwent AVR with different-sized mechanical valves. Our results demonstrated that improvements and anatomical changes were observed most notably in patients that received nos 21, 23 and 25 valves.
Aortic stenosis causes left ventricular hypertrophy as an adaptive response to increasing pressure. Persistence of this load may impede myocardial contractility and pump function. Aortic valve replacement may relieve the pressure overload and result in reversal of anatomical and functional changes due to aortic stenosis. These improvements can be linked to factors such as the timing of surgery, type and size of the mechanical prosthesis, and valvular pathology.12 However, complete regression of myocardial
hypertrophy may not occur since the hypertrophic myocytes may have undergone irreversible changes.13 Our results indicate
that patients with higher residual gradients and increased left ventricular end-diastolic pressures experienced a less remarkable decrease in left ventricular mass.
Irreversible myocardial depression and fibrosis, which develops as a consequence of long-term aortic stenosis must be borne in mind before deciding on surgery. Symptomatic patients who suffer from angina pectoris, dyspnoea or syncope benefit more significantly from AVR and have prolonged survival after surgery.14 Even for asymptomatic patients, the risk of sudden
death and irreversible left ventricular dysfunction may be prevented with surgery.15
Type and size of the prosthetic valve as well as other peri-operative factors may influence anatomical and functional changes after AVR. De Paulis et al. reported a significant reduction in LVM in patients operated on due to aortic stenosis.16
Bioprostheses without stents and aortic allografts are expected to provide a more remarkable reduction in LVH and left ventricular function.16
Maselli et al. suggested that residual gradient and high pressure in the left ventricle were responsible for the unsatisfactory reduction in left ventricular mass after AVR.17
In the same study, homograft valves yielded more significant reductions in LVMI.17 In contrast to these reports, Christakis et
al. could not demonstrate any impact of the type of prosthesis on regression of LVM.18 Prosthetic valves without stents
provided optimal regression on LVM within one year of the operation.19
A better haemodynamic performance was achieved using prostheses without stents than with bioprostheses and stents.18
Gonzalez-Juanatey et al. reported that larger prostheses resulted in a more apparent reduction in LVH.20 Similar to
this study, our results indicate that most significant changes in LVM occurred in the sixth month postoperatively. Variations in the amount of regression in LVM in our patients receiving nos 19, 21, 23 and 25 prostheses were 25, 26.7, 27.8 and 30.2%, respectively.
Botzenhardt et al. demonstrated mean pressure gradients of 11.5 ± 3.8 mmHg for no 21 and 12.7 ± 5.0 mmHg for no 25 valves.21 However, they realised that haemodynamic performance
was not primarily influenced by valve size but more by sizing strategy, and therefore the selection of a given valve size according to the patient’s anatomy. Since the relationship would be similar for all valve sizes, it was not surprising to observe similar pressure gradients with different valve sizes.
A residual gradient after AVR may cause persistence of LVH and lead to increased mortality rates in the late period.22 Lund
et al. postulated that LVMI was closely associated with survival after AVR.23 If the effective surface area of the prosthesis is less
than a normal valve, a mismatch between patient and prosthesis occurs, and this may be an important determinant of residual gradient and persistent LVH.24
The role of the surgeon and the sizing strategy adopted appear to be very important in exploiting or failing to exploit the haemodynamic characteristics of the prosthesis.25 For selection
of the appropriate valve size, most authors advocate the use of valves larger than no 21.26 Smaller valves may lead to a high
transvalvular gradient, even at rest. Selecting a larger valve bears a greater risk of causing damage, specifically to the aorta around the aortotomy. When selecting a larger prosthesis, it may be necessary to take the valve off the holder and tilt it for proper introduction into the root.27,28
We determined that patients who received no 19 valves experienced less regression of LVM, especially in the third and fifth postoperative years. In all groups, changes were more obvious in the sixth postoperative month, whereas these changes became less notable after the first year.
Regression of LVM mostly happens in the early postoperative period after AVR, and persistence of LVH and deterioration of left ventricular diastolic function may be one of the underlying causes of sudden death. Our findings revealed that all groups displayed a significant improvement in ejection fraction in the sixth postoperative month. However, changes were more obvious in cases that received nos 23 and 25 prosthetic valves.
Cardiac hypertrophy on ECG displays a correlation between voltage criteria and LVMI.29,30 In parallel to our results mentioned
above, voltage criteria exhibited the most prominent changes with valve nos 23 and 25, and the least change occurred in patients receiving no 19 valves.
The amount of regression of LVM after AVR is related to degenerative changes in the myocardium and decrease in left ventricular reserve. These factors must be kept in mind before deciding on surgical intervention for aortic stenosis. Moreover, in addition to size and type of prosthesis, the aetiology of aortic stenosis and timing of surgery must be considered.
The main limitation of our study was the distribution of patients in the study groups. The four patient groups were determined by the different valve sizes, and almost 80% of the patients were in the two groups with valve sizes nos 21 and 23.
Conclusion
The results of this study indicate that mechanical valve replacement should not be performed with small size valves because of the higher residual gradient. Instead, mechanical valve replacement with larger sized valves, together with aortic root enlargement procedures appears to be a more appropriate option.
References
1. Carabello BA, Zile MR, Tanaka R, Cooper G. Left ventricular hyper-trophy due to volume overload versus pressure overload. Am J Physiol 1992; 263: H1137–44.
2. Harpole DH, Jones RH. Serial assessment of ventricular performance after valve replacement for aortic stenosis. J Thorac Cardiovasc Surg 1990; 99: 645–650.
3. Monrad ES, Hess OM, Murakami T, Nonogi H, Corin WJ, Krayenbuehl HP. Time course of regression of left ventricular hypertrophy after aortic valve replacement. Circulation 1988; 77: 1345–1355.
4. Ali A, Patel A, Ali Z, Abu-Omar Y, Saeed A, Athanasiou T, et al. Enhanced left ventricular mass regression after aortic valve replacement in patients with aortic stenosis is associated with improved long-term survival. J Thorac Cardiovasc Surg 2011; 142: 285–291.
5. The Criteria Committee of the New York Heart Association.
Nomenclature and Criteria for Diagnosis of Diseases of the Heart and Great Vessels. 9th edn. Boston: Little, Brown & Co, 1994: 253–256.
6. Baumgartner H, Hung J, Bermejo J, Chambers JB, Evangelista A, Griffin BP, et al. Echocardiographic assessment of valve stenosis: EAE/ ASE recommendations for clinical practice. J Am Soc Echocardiogr 2009; 22: 1–23.
7. Skjaerpe T, Hegrenaes L, Hatle L. Noninvasive estimation of valve area in patients with aortic stenosis by Doppler ultrasound and two dimen-sional echocardiography. Circulation 1985; 72: 810–818.
8. Devereux RB, Alonso DR, Lutas EM, Gottlieb GJ, Campo E, Sachs I, et al. Echocardiographic assessment of left ventricular hypertrophy: comparison to necropsy findings. Am J Cardiol 1986; 57: 450–458. 9. Callahan MJ, Tajik AJ, Su-Fan Q, Bove AA. Validation of
instanta-neous pressure gradients measured by continuous wave Doppler in experimentally induced aortic stenosis. Am J Cardiol 1985; 56: 989–993. 10. Folland ED, Parisi AF, Moynihan PF, Jones DR, Feldman CL, Tow
DE. Assessment of left ventricular ejection fraction and volumes by real-time, two-dimensional echocardiography. A comparison of cinean-giographic and radionuclide techniques. Circulation 1979; 60: 760–766. 11. Drelinski GR. Identification of left ventricular hypertrophy: Chest
roentgenography, echocardiography and electrocardiography. Am J Med 1983; 75(3A): 47–50.
12. Kurnik PB, Innerfield M, Wachspress JD, Eldredge WJ, Waxman HL. Left ventricular mass regression after aortic valve replacement measured by ultrafast computed tomography. Am Heart J 1990; 120: 919–927. 13. Lund O, Kristensen LH, Baandrup U, Hansen OK, Nielsen TT,
Emmertsen K, et al. Myocardial structure as a determinant of pre and postoperative ventricular function and long-term prognosis after valve replacement for aortic stenosis. Eur Heart J 1998; 19: 1099–1108. 14. Zarco P. Aortic stenosis. Eur Heart J 2003; 24: 133–135.
15. Antonini-Canterin F, Zuppiroli A, Popescu BA, Granata G, Cervesato E, Piazza R, et al. Effect of statins on the progression of bioprosthetic aortic valve degeneration. Am J Cardiol 2003; 92: 1479–1482.
16. De Paulis R, Sommariva L, Colagrande L, De Matteis GM, Fratini S, Tomai F, et al. Regression of left ventricular hypertrophy after aortic valve replacement for aortic stenosis with different valve substitutes. J
Thorac Cardiovasc Surg 1998; 116: 590–598.
17. Maselli D, Pizio R, Bruno LP, Di Bella I, De Gasperis C. Left
ventricu-lar mass reduction after aortic valve replacement: Homografts, stentless and stented valves. Ann Thorac Surg 1999; 67: 966–971.
18. Christakis GT, Joyner CD, Morgan CD, Fremes SE, Buth KJ, Sever JY,
et al. Left ventricular mass regression early after aortic valve
replace-ment. Ann Thorac Surg 1996; 62: 1084–1089.
19. Jin XY, Gibson DG, Yacoub MH, Pepper JR. Perioperative assessment of aortic homograft, Toronto stenless valve, and stented valve in the aortic position. Ann Thorac Surg 1995; 60: S395–401.
20. González-Juanatey JR, García-Acuña JM, Vega Fernandez M, Amaro Cendón A, Castelo Fuentes V, García-Bengoechea JB, et al. Influence of the size of aortic valve prostheses on hemodynamics and change in left ventricular mass: Implications for the surgical management of aortic stenosis. J Thorac Cardiovasc Surg 1996; 112: 273–280.
21. Botzenhardt F, Eichinger WB, Guenzinger R, Bleiziffer S, Wagner I, Bauernschmitt R, et al. Hemodynamic performance and incidence of patient-prosthesis mismatch of the complete supraannular Perimount magna bioprosthesis in the aortic position. Thorac Cardiovasc Surg 2005; 53: 226–230.
22. Levy D, Garrison RJ, Savage DD, Kennel WB, Castelli WP. Prognostic implication of echocardiographically determined left ventricular mass in the Framingham heart study. N Eng J Med 1990; 322: 1561–1566. 23. Lund O, Erlandsen M, Dorup I, Emmertsen K, Flo C, Jensen FT.
Predictable changes in left ventricular mass and function during ten years after valve replacement for aortic stenosis. J Heart Valve Dis 2004;
13: 357–368.
24. Cakici M, Durdu S, Inan B, Yazicioglu L, Sirlak M, Eryilmaz S, et al. Changes in left ventricular function and geometry after aortic valve replacement in patients with severe aortic stenosis. Turk Gogus Kalp
Dama 2013; 21(2): 284–293. Doi: 10.5606/tgkdc.dergisi.2013.6999.
25. Tasca G, Vismara R, Fiore GB, Mangini A, Romagnoni C, Pelenghi S, et al. Fluid-dynamic results of in vitro comparison of four peri-cardial bioprostheses implanted in small porcine aortic roots. Eur J
Cardiothorac Surg 2015; 47: e62–67.
26. Sutton M, Plappert T, Spiegel A, Raichlen J, Douglas P, Reichek N, et
al. Early postoperative changes in left ventricular chamber size,
architec-ture, and function in aortic stenosis and regurgitation and their relation to intraoperative changes in afterload: A prospective two-dimensional echocardiographic study. Circulation 1987; 76: 77–89.
27. Diab M, Faerber G, Bothe W, Lemke S, Breuer M, Walther M, Doenst T. Sizing strategy is a major determinant of postoperative pressure gradients in commonly implanted stented tissue valves. Eur J
Cardiothorac Surg 2013; 44: e289–294.
28. Bozok S, Kestelli M, Sahin A, Kara H, Gunes T, Ozpak T, et al. Surgical method for facilitation of aortic valve replacement: Intraoperative applica-tion of external pressure for increasing the transverse axis of aortic annulus.
World J Cardivasc Surg 2015; 5: 108–113. Doi: 10.4236/wjcs.2015.510017.
29. Carroll JD. Regression of myocardial hypertrophy: Electrocardiographic echocardiographic correlation after aortic valve replacement in patient with chronic aortic regurgitation. Circulation 1982; 65: 980–987. 30. Gokalp O, Besir Y, Iner H, Yilik L, Gurbuz A. What are the parameters
showing improvement after the prosthetic valve implantation for aortic stenosis? Turk Gogus Kalp Dama 2017; 25: 164–165. Doi: 10.5606/tgkdc. dergisi.2017.13939.