UHOD
Three Dimensional Conformal Radiotherapy and
Androgen Deprivation Therapy in Patients with
Clinically Localized Prostate Cancer; Hacettepe
University Experience
Yurday OZDEMIR1,2, Fadil AKYOL1, Gokhan OZYIGIT1, Pervin HURMUZ1,
Cem ONAL2, Ugur SELEK3, Erdem KARABULUT4
1 Hacettepe University Faculty of Medicine, Department of Radiation Oncology, Ankara 2 Başkent University Faculty of Medicine, Department of Radiation Oncology, Adana
3 Koç University Faculty of Medicine, Department of Radiation Oncology, İstanbul 4 Hacettepe University Faculty of Medicine, Department of Biostatistics, Ankara, TURKEY
ABSTRACT
The aim of this study is to evaluate the treatment results of three dimensional conformal radiotherapy (3DCRT) and androgen dep-rivation therapy (ADT) in patients with clinically localized prostate cancer (CLPC). Between June 1998 and December 2011, 577 patients with the diagnosis of CLPC were treated. ADT was started 3 months prior to radiotherapy (RT). 3DCRT was delivered to prostate and the seminal vesicles (SV) to a total dose of 70Gy. Additionally, patients with lymph node (LN) positivity received 50.4Gy RT to pelvic LN’s. Median follow up time was 65 months. Five-ten years overall survival (OS), cause specific survival (CSS), PSA relapse-free survival (PSA-RFS) and distant metastasis-free survival (DMFS) rates were 92-74%, 97-91%, 77-55% and 94-88%, respectively. OS was negatively affected from LN positivity (p< 0.001). In the subgroup of patients with GS≥ 8, there was no signifi-cant difference between < 1 years and ≥ 1 years of ADT in terms of CSS, PSA-RFS and DMFS. OS was better in patients with < 1 years of ADT (p= 0.01). Five year OS (p= 0.02), CSS (p= 0.05), PSA-RFS (p= 0.01) and DMFS (p= 0.07) rates were inferior in the high risk group patients that used ADT ≥ 1 year. Acute and late RTOG grade III/IV gastrointestinal system toxicity rates were 1.7% and 5% and acute and chronic RTOG grade III/IV genitourinary system toxicity rates were 1.4% and 5%, respectively. 3DCRT and ADT combination is an effective treatment modality with acceptable toxicities in patients with clinically localized prostate cancer.
Keywords: Prostate cancer, Conformal radiotherapy, Androgen deprivation therapy ÖZET
Lokalize Prostat Kanserli Olgularda Üç Boyutlu Konformal Radyoterapi ve Total Androjen Blokajı; Hacettepe Üniversi-tesi Deneyimi
Bu çalışmanın amacı, üç boyutlu konformal radyoterapi (3BKRT) ve total androjen blokajı (TAB) Lokalize prostat kanserli olgularımızdaki tedavi sonuçlarımızı değerlendirmek. Haziran 1998 ve Aralık 2011 tarihleri arasında lokalize prostat kanseri tanısıyla 577 olgu tedavi edildi. TAB tedavisine radyoterapiden (RT) 3 ay sonar başlandı. 3BKRT olarak prostat ve seminal veziküllere toplam 70 Gy uygulandı. Ek olarak lenf nodu (LN) tutulumu olan olgularda pelvic LN’larına 50.4 Gy uygulandı. Ortanca izlem süresi 65 aydır. Beş-on yıllık genel sağkalım (GS), hastalığa özgü sağkalım (HSS), PSA-relapssız sağkalım (PSA-RFS) ve uzak metastazsız sağkalım (DMFS) oranları sırasıyla %92-74, %97-91, %77-55 ve %94-88 bulundu. LN tutulumu GS’ı olumsuz etkilemiştir (p< 0.001). Gleason skoru ≥ 8 olan olgularda <1 yıl ile ≥ 1yıl TAB kullanımı arasında HSS, PSA-RFS ve DMFS açısından fark yoktu. Ancak <1 yıl TAB kullananlarda GS daha iyiydi (p= 0.01). Yüksek riskli grupta olup ≥ 1yıl TAB kullanan hastalarda 5 yıllık GS (p= 0.02), HSS (p= 0.05), PSA-RFS (p= 0.01) ve DMFS (p= 0.07) daha düşük bulundu. Erken ve geç dönem RTOG grad III/IV gastrointestinal sistem toksisite oranları %1.7 ve %5 bulundu. Erken ve geç dönem RTOG grad III/IV genitoüriner sistem toksisite oranları %1.4 ve %5 bulundu. Lokalize prostat kanseri tedavisinde 3BKRT ve TAB tedavisi etkili ve güvenli bir tedavi biçimidir.
INTRODUCTION
Treatment options for patients with clinically lo-calized prostate cancer include active surveillance, radical prostatectomy or radiotherapy (RT) with or without androgen deprivation treatment (ADT). The treatment decision is made according to risk group of the patient. Although there is no rand-omized study comparing RT with surgery various studies demonstrated that RT is equally effective with surgery in the treatment of clinically localized prostate cancer. Its effect improves when the dose delivered to target is increased. Three dimensional conformal radiotherapy (3DCRT) techniques pro-vide the delivery of higher doses to the target while sparing the adjacent normal structures. Addition-ally, RT and ADT have been shown to improve overall survival (OS), PSA relapse free survival (PSA-RFS) and distant metastasis free survival (DMFS)1-3 compared to RT alone. Thus RT with
ADT is the standard of care for localized prostate cancer in intermediate and high risk patients. In this study we aimed to evaluate our treatment results in patients with clinically localized prostate cancer and identify the factors that had might affect the prognosis of the patients.
PATIENTS AND METHODS
Between June 1998 and June 2011, 577 patients with the diagnosis of clinically localized prostate adenocarcinoma were treated according to our institutional treatment protocol. ADT consisted of LHRH analogue plus antiandrogen. ADT was started 3 months prior to RT and was continued according to the D’Amico risk group of the pa-tient at the initial diagnosis. The work up studies included initial PSA (iPSA), Gleason Score (GS), transrectal USG or prostat MRI, abdominopelvic computerized tomography (CT) and Tc-99m bone scintigraphy.
Clinical target volume was defined as the prostate gland and the entire seminal vesicles (SV). Total dose of 70 Gy was delivered to 95% isodose. Thus, the dose at the International Commission of Ra-diation Units and Measurement (ICRU) point was 73.6 Gy. Twenty nine patients with LN positivity received RT to pelvis (50.4 Gy) plus prostate and
SV (70 Gy). ADT was used ≥ 1 year in 38% of the patients. We used 7 fields to deliver the dose to the prostate and SV. The doses for adjacent normal structures were kept below the tolerance limits of each organ; V70<35% and V40<50% for bladder, V70<20% and V40<40% for rectum, and V50<5% for femoral heads.
The patients were followed up every 3 months for the first 2 years, every 6 months for the next 3 years and annually thereafter. Follow up included routine physical examination, hemogram, liver function tests, PSA and transrectal USG.
OS, prostate cancer specific survival (CSS), PSA-RFS, DMFS were assessed in relation to GS (GS 2-6, GS 7, GS 8-10), iPSA (PSA≤ 10, 10< PSA≤ 20, PSA> 20), total percentage of cancer contain-ing cores (TPC), percent of positive cores (PPC) (and perineural invasion (PNI) status. TPC was defined as the division of total tumor percentage of cancer containing cores with number of total cores, multiplied by 100. PPC was defined as the number of biopsy cores with cancer cells divided by the total number of cores, multiplied by 100.4
The patients were grouped as TPC< %50 or ≥%50 and PPC≤ %50 or >%50. PNI was defined as the presence of prostate cancer cells within the spaces along the prostatic nerves.5 Patients with T1-2a and
PSA≤ 10 ng/ml and GS 2-6 were categorized as low risk, T2b and 10< PSA≤ 20 and GS 7 as in-termediate risk and T2c-T4 or PSA> 20 ng/ml and GS 8-10 as high risk groups according to D’Amico classification.6 Acute and late treatment related
toxicities were also evaluated using RTOG Acute Radiation Morbidity Scoring Criteria and RTOG/ EORTC Late Radiation Morbidity Scoring Schema.
Statistics
SPSS 16.0 (SPSS Inc., Chicago, IL) version was used for the statistical analysis. The value of p< 0.05 was used to determine statistical significance. Time to last follow-up, biochemical failure and dis-tant metastases were calculated starting from the fi-nal date of 3DCRT. Kaplan-Meier test was used to estimate all survival probabilities and hazard rates. Evaluation of prognostic factors was done by Log-rank test for univariate analysis and Cox regression for multivariate analysis.
RESULTS
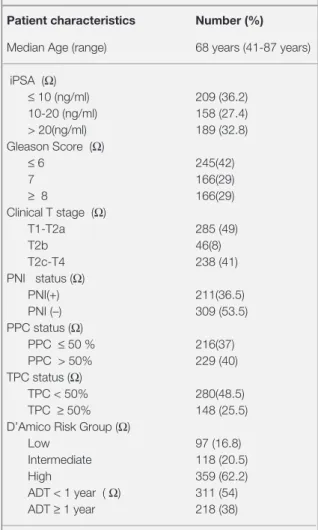
Median follow up time was 65 months (range, 3-169 months). There were 29 patients with lymph node (LN) involvement and 8 of them had patho-logical confirmation of LN positivity. The charac-teristics of the patients were summarized in Table 1. PNI status was reported in 520 (90%) patients and it was positive in 36.5% of the cases. PPC and TPC status were reported in 445(77%) and 428 (74%) patients, respectively. The percentage of patients with PPC> 50% was 40% and TPC≥ 50% was 25.5%. The characteristics of patients ac-cording to PPC and TPC status were listed in Table 2. Both high PPC and TPC were correlated with higher PSA, GS, clinical T stage, higher risk group, PNI positivity and increased ADT duration (p< 0.001). Patients with PPC> %50 and TPC≥ %50 were tended to be younger than patients with PPC ≤ %50 and TPC< %50 (p< 0.004 and p<0.001, re-spectively). PNI positivity didn’t correlate with pa-tient age (p= 0.28).
Overall Survival
Five and 10 years OS rates for entire cohort were 92% and 74% respectively. According to T stage of the patients, there was no difference in OS. Five and 7 year OS rates in LN (+) and LN (-) groups were 69 and 55% and 97 and 92%, respectively (p< 0.001). When the patients were analyzed according to the GS groups, 5-10 year OS rates were 93 and 82% in GS ≤ 6 group; 95 and 72% in GS 7 group. The patients with GS ≥8 had 5 and 10 year OS rates of 87 and 59% that were significantly lower than GS ≤ 6 (p= 0.008) and GS 7 (p= 0.027) groups. There was no significant difference in OS between GS ≤ 6 and GS 7 patient groups (p= 0.89). Five and 10 year OS rates in the PSA ≤ 10 ng/ml, PSA 10-20 ng/ml and PSA > 20 ng/ml groups were 95 and 84%, 87 and 69%, 91 and 65%, respectively. OS rates in the PSA ≤ 10 ng/ml group were sig-nificantly higher than PSA 10-20 ng/ml (p= 0.002) and PSA > 20 ng/ml groups (p= 0.008). However there was no difference in OS between the latter two groups (p= 0.64). OS rates in low risk patients were higher than intermediate (p= 0.005) and high risk patients (p= 0.002). PNI (+) patients had 5-10 year OS rates of 89 and 60% compared to 94 and
79% in PNI (-) patients (p= 0.06). Presence of TPC ≥ 50% and PPC > 50% were not a predictor for OS (p= 0.9 and p= 0.1, respectively). In the mul-tivariate analyses only LN positivity significantly decreased OS (p= 0.01).
Prostate Cancer Specific Survival
Twenty four patients died because of prostate can-cer. CSS at 5 and 10 years were 97% and 91%. On univariate analysis, CSS rates in T2c-T3b groups were worse than T1-T2a groups (p= 0.004) but not different from T2b patients (p= 0.48). LN positive
Table 1. The characteristics of 577 patients Patient characteristics Number (%)
Median Age (range) 68 years (41-87 years) iPSA (Ω) ≤ 10 (ng/ml) 209 (36.2) 10-20 (ng/ml) 158 (27.4) > 20(ng/ml) 189 (32.8) Gleason Score (Ω) ≤ 6 245(42) 7 166(29) ≥ 8 166(29) Clinical T stage (Ω) T1-T2a 285 (49) T2b 46(8) T2c-T4 238 (41) PNI status (Ω) PNI(+) 211(36.5) PNI (–) 309 (53.5) PPC status (Ω) PPC ≤ 50 % 216(37) PPC > 50% 229 (40) TPC status (Ω) TPC < 50% 280(48.5) TPC ≥ 50% 148 (25.5)
D’Amico Risk Group (Ω) Low 97 (16.8) Intermediate 118 (20.5)
High 359 (62.2)
ADT < 1 year ( Ω) 311 (54) ADT ≥ 1 year 218 (38)
Abbreviations: PPC= percent of tumor positive cores; TPC=total percentage of cancer containing cores; iPSA= initial prostate specific antigen; PNI= perineural invasion; ADT= androgen deprivation therapy; (Ω) = Not available in all patients due to missing data
patients had worse CSS than LN negative patients (p= 0.008). GS, PSA, D’Amico risk groups, TPC, PPC and PNI were all significantly associated with CSS rates (Table 3 and Figure 1). Patients with GS ≥ 8 had significantly poor survival than GS 7 (p= 0.015) and GS ≤ 6 patients (p< 0.001). Survival was worse in patients with GS 7 compared to GS ≤ 6 patients (p= 0.08). CSS in patients with PSA ≤ 10 ng/ml was better than the subsequent PSA groups (p= 0.01 and p< 0.001, respectively). Patients with PSA 10-20 ng/ml had better CSS compared to pa-tients with PSA > 20 ng/ml (p= 0.04). D’Amico high risk patients had worse CSS rates than low and intermediate risk patients (Table 3). Higher TPC and PPC and presence of PNI were all related to poor CSS (Figure 1).
PSA Relapse Free Survival
One hundred thirty five PSA relapses were report-ed. Five and 10 years PSA-RFS rates were 77%
and 55% and median PSA relapse free period was 54.5 months. We found a significant difference be-tween T1a-T2a and T2c-T3b groups in favour of T1a-T2a group (p= 0.003). Five year PSA-RFS rates in the LN positive and LN negative patients were 52% and 78%, respectively (p= 0.001). The 5 and 10 year PSA-RFS rates in three GS groups were shown in Table 4. There was no significant difference in terms of PSA-RFS between GS ≤ 6 and GS 7 groups (p= 0.15). Patients with GS ≥ 8 had significantly worse PSA-RFS than patients with either GS ≤ 6 (p < 0.001) or GS 7 (p= 0.002). PSA-RFS is affected from the increasing PSA levels. 5-10 year PSA-RFS rates in PSA≤ 10 ng/ ml, PSA 10-20 ng/ml and PSA > 20 ng/ml groups were; 88% and 74%, 79% and 46%, and 62% and 40%, respectively. PSA-RFS rate in the PSA > 20 ng/ml group was significantly worse compared to PSA 10-20 ng/ml group (p= 0.007) and PSA ≤ 10 ng/ml group (p< 0.001).
Table 2. Patient characteristics by PPC and TPC status
PPC ≤ %50 PPC>%50 p TPC<%50 TPC≥%50 p n (%) n (%) n (%) n (%) Mean Age 68.3 66.3 <0.004 68.2 65.5 <0.00 iPSA Group ≤10 (ng/ml) 110 (%53) 54 (%24) 132 (%50) 28 (%19) 10-20 (ng/ml) 51 (%24) 74 (%33) <0.00 73 (%27) 49 (%33) <0.00 >20 (ng/ml) 47 (%23) 97 (%43) 62 (%23) 70 (%48) Gleason Score ≤6 115 (%53.5) 62 (%27) 149 (%53) 20 (%14) 7 63 (%29.3) 69 (%30) <0.00 82 (%29) 43 (%29) <0.00 ≥8 37 (%17.2) 98 (%43) 49 (%18) 85 (%57) PNI (+) 53 (%25) 135 (%62) <0.00 88 (%32) 104 (%74) <0.00 PNI (–) 160 (%75) 83 (%38) 186 (%68) 37 (%26) Clinical Stage T1-T2a 132 (%61) 80 (%35) 168 (%60) 38 (%26) T2b 18 (%9) 18 (%8) <0.00 19 (%7) 13 (%9) <0.00 T2c-T4 65 (%30) 128 (%57) 93 (%33) 65 (%65) D’Amico Risk Low 56 (%26) 15 (%6) 68 (%24) 4 (%3) Intermediate 56 (%26) 32 (%14) <0.00 70 (%25) 12 (%8) <0.00 High 103 (%48) 182 (%80) 142 (%51) 131 (%89) ADT < 1 year 142 (%70) 89 (%41) <0.00 173 (%65) 53 (%38) ADT ≥ 1 year 62 (%30) 128 (%59) 92 (%35) 87 (%62) <0.00 Abbreviations: PPC= percent of positive cores; TPCC=total percentage of cancer containing cores; iPSA=initial prostate specific antigen; PNI= perineural invasion; ADT= androgen deprivation therapy
Figure 1. Prostate cancer specific survival curves according to (a) initial prostate specific antigen (vPSA), (b) Gleason score (GS), (c) D’Amico risk groups, (d) total percentage of cancer containing cores (TPC), (e) percent of positive cores (PPC), (f) perineural
invasion (PNI) status.
(a) (b) 1,0 0,8 0,6 0,4 0,2 0,0 1,0 0,8 0,6 0,4 0,2 0,0 1,0 0,8 0,6 0,4 0,2 0,0 1,0 0,8 0,6 0,4 0,2 0,0 1,0 0,8 0,6 0,4 0,2 0,0 1,0 0,8 0,6 0,4 0,2 0,0 0 12 24 36 48 60 72 84 96 108 120 Time (months) 0 12 24 36 48 60 72 84 96 108 120 Time (months) 0 12 24 36 48 60 72 84 96 108 120 Time (months) 0 12 24 36 48 60 72 84 96 108 120 Time (months) 0 12 24 36 48 60 72 84 96 108 120
Time (months) 0 12 24 36 48 60 72 84 96 108 120Time (months)
Prostate specific survival
Prostate specific survival
Prostate specific survival
Prostate specific survival
Prostate specific survival
Prostate specific survival
(c) (d) (e) (f) vPSA Group ≤10 10-20 >20 ≤10 censored 10-20 censored >20 censored ≤6 7 ≥8 ≤6 censored 7 censored ≥8 censored Gleason score
D’Amico Risk Group Low Intermediate High Low-censored Intermediate-censored High-censored < %50 ≥ %50 < %50 censored ≥ %50 censored TPC p= 0.002 ≤ %50 > %50 ≤ %50 censored > %50 censored PPC p= 0.008 PNI (+)PNI (–) p= 0.005 PNI (+) censored PNI (–) censored Perineural invasion
Five year PSA-RFS rates in the low, intermediate and high risk disease groups were 93%, 77% and 72%, respectively. Patients in the high risk disease group had worse PSA-RFS compared to low risk (p< 0.001) and intermediate risk groups (p< 0.001). Five-10 year PSA-RFS rates were 60% and 42% in the TPC≥ 50% group and 86% and 68% in the TPC< 50% group (p< 0.001); 65% and 44% in the PPC> 50% group and 89% and 85% in the PPC≤50% group, respectively (p< 0.001). PNI sta-tus was also predictive in terms of PSA-RFS (p= 0.005).
In the multivariate analysis, iPSA levels (p < 0.001), LN status (p= 0.001), TPC (p= 0.04) and PPC (p= 0.05) were found to be significantly af-fecting the PSA-RFS. Additionally, patients with LN positive disease had 3.8 times increase in the rate of PSA relapse compared to LN negative pa-tients. Compared to patients with PSA ≤ 10 ng/ ml; PSA relapse rates were increased 2 times in patients with PSA 10-20 ng/ml and 3.5 times in pa-tients with PSA>20 ng/ml.
Distant Metastasis Free Survival
There were 37 distant metastases. Fifty percent of the patients had no metastases until 65.9 months in their follow up. The patients with T2c-T3b had more distant metastases compared to T1a-T2a pa-tients (p= 0.007). Five and 10 year DMFS rates in the LN positive and LN negative groups were 82% and 66.5% and 96% and 95%, respectively (p< 0.001).
Five and 10 year DMFS rates according to GS are shown in Table 4. Patients in GS ≥ 8 group had sig-nificantly worse DMFS compared to patients in GS 7 (p= 0.001) and GS ≤ 6 groups (p= 0.001). Patients with PSA ≤ 10 ng/ml had 5 and 10 year DMFS rates of 98% and 97%; patients with PSA 10-20 ng/ml had 5 and10 year DMFS rates of 95% and 90% (p= 0.05). Patients with PSA > 20 ng/ml had 5 and 10 years DMFS rates of 89% and 77%, respectively. Thus, patients with PSA > 20 ng/ml had worse DMFS compared to patients with PSA ≤ 10 ng/ml (p< 0.001) and PSA 10-20 ng/ml (p=0.05) Patients in the low and intermediate risk groups did not have significant difference in DMFS (p=
0.15). However, patients in the high risk group had worse DMFS rates compared to intermediate risk (p= 0.04) and low risk groups (p= 0.004).
Five and 10 year DMFS in the TPC ≥ 50% group were 88% and 66% compared to 98% in the TPC < 50% group (p< 0.001). Five-10 year DMFS in the PPC > 50% group were 90%-81% in compared to 98% in PPC ≤ 50% group (p<0.001). Patients with PNI had worse DMFS than PNI negative patients (p= 0.03).
In the multivariate analysis, LN positivity (p= 0.001) and TPC ≥ %50 (p= 0.05) were shown to increase the risk of distant metastasis. Patients with GS ≥ 8 had significantly risk of distant metastasis compared to patients with GS ≤ 6 (p= 0.01).
Androgen Deprivation Therapy
Seventy nine percent of patients that used ≥ 1 year ADT and 53% of the patients that used < 1 year ADT were in the D’Amico high risk group. Al-though 44% and 47% of the patients that used long term ADT were the patients with GS ≥ 8 and PSA > 20 ng/ml; these rates were only 19% and 24% in < 1 year ADT used patients, respectively. Only 11% and 61% of the group used ADT for ≥ 2 years and ≥ 1 year respectively
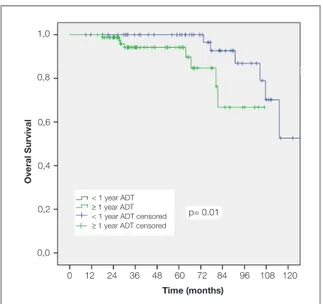
In the whole group 5 and 10 years OS rates in patients that used ADT < 1 year were 99.5% and %90.6 compared to 94% and 90% in group of patients that used ADT ≥ 1 year (p= 0.03). In the subgroup of patients with GS≥ 8, there was no sig-nificant difference between < 1 years and ≥ 1 years of ADT in terms of CSS (p= 0.3), PSA-RFS (p= 0.15) and DMS (p= 0.4). However OS was better in patients with <1 year ADT (Figure 2) (p= 0.01). Five and 10 years OS rates were 100% and 53% in short term ADT used group; 94% and 66% in long term ADT used group.
In the high risk patients, 5 years OS (p= 0.02), CSS (p= 0.05), PSA-RFS (p= 0.01) and DMFS (p= 0.07) rates were better in patients that used ADT< 1 years.
Toxicity
RT related acute toxicities were evaluated using RTOG Acute Radiation Morbidity criteria and late toxicities were evaluated using RTOG/EORTC Late Radiation Morbidity scoring schema.7 The
data about toxicity of gastrointestinal and genito-urinary systems were available 83% and 85% of the patients, respectively. The treatment was well tolerated with few grade 3 toxicities. Acute grade 3 genitourinary and gastrointestinal toxicities were reported in 1.4% and 1.7% of cases. Twenty five late grade 3 gastrointestinal toxicities were re-ported (5%). These patients had gastrointestinal (GIS) haemorrhage that was required argon laser therapy. Only 1 patient had faecal incontinence as grade 3 toxicity. Twenty eight (6%) patients had RTOG grade 3 genitourinary (GUS) toxicities due to radiation stricture that needed minimally inva-sive procedures (urethral dilation, catheterization, transurethral resection of prostate or cystoscopy). Twelve of those 28 patients had also urinary in-continence. Two patients had both GIS and GUS Grade 3 toxicity. There was no grade 4 GIS or GUS toxicity.
DISCUSSION
The classic prognostic factors for prostate cancer are clinical TNM stage, histological grade, GS and iPSA.8 These parameters are used to categorize
patients into some risk groups and decide the ap-propriate treatment. In this study we prospectively evaluated the treatment results of our patients with prostate cancer in terms of OS, CSS, PSA-RFS and DMFS in each classical risk status and also we studied the other factors like TPC, PPC and PNI that have not been routinely used in predictive al-gorithm.
It was shown that higher GS is associated with greater likelihood of having non-organ confined disease, as well as a worse outcome after treatment of localized disease.9 In our study, the patients with
GS ≥ 8 had tendency to be in clinical T2c-T3b stage compared to be in clinical T1-2a stage. In GS ≥ 8 group, the percentage of the patients with PSA > 20 ng/ml and with PSA ≤ 10 ng/ml were 45% and 23%, respectively. These patients had decreased rate of OS, CSS, PSA-RFS and DMFS than GS ≤ 6 and GS 7 patients in our study.
In LN positive patients, there is evidence to sup-port attempts to control primary tumor10 and a
sys-temic review concluded that in T3 and/or LN posi-tive diseases the local therapy is an essential part of the optimal treatment.11 When RT is combined
with ADT in LN positive patients, retrospective data suggest excellent biochemical control rates at 5 and 10 years.12 In RTOG 85-32 trial, LN positive
patients that received whole pelvic RT (WPRT) with combined hormonal treatment, had better biochemical control rates at 5 and 9 years com-pared to WPRT only; 54% and 10% versus 33% and 4%, respectively. In our trial, although all of the outcomes were worse in LN positive patients compared to LN negative counterparts (p= 0.001), there were only 5 deaths because of prostate can-cer in LN positive patients. This may be explained by the pelvic RT, long ADT duration and short fol-low up time in this group of LN positive patients. Twenty seven of 29 LN positive patients in our study received ADT of ≥1 year. Observational se-ries of external RT for LN positive prostate cancer
Figure 2. Overall survival in Gleason 8-10 patients according
to the ADT duration.
< 1 year ADT
≥ 1 year ADT < 1 year ADT censored ≥ 1 year ADT censored 1,0 0,8 0,6 0,4 0,2 0,0 0 12 24 36 48 60 72 84 96 108 120 Time (months) Overal Survival p= 0.01
patients have suggested favourable outcomes after local therapy, with 10 -year CSS rates in the range of 60% and 85%.13,14 In our study due to low
num-bers of LN positive patients, we only report 5 year CSS rates of 80%. However we know that more patients and more follow-up time are required to compare our results with the other trials.
After radical prostatectomy (RP) or RT, there is limited data supporting the utility of biopsy sur-rogates of prostate volume like PPC and TPC for prediction of prognosis.15 The relation between
PPC and biochemical relapse free survival (BFS) was explored after ADT16, RP16-18, after WPRT4,19,20
and brachyterapy.21-24 Although the prognostic
sig-nificance of PPC couldn’t be demonstrated in some studies22, Yushen et al reported the prognostic
val-ue of PPC in intermediate and high risk patients with regard to CSS, BFS and DMFS.25 Freedland et
al reported that PPC in biopsy was an independent predictor of biochemical relapse and adverse path-ological findings like higher T stage, higher GS and positive surgical margin following RP.26 Briganti et
al reported that PPC has a predictive value for esti-mating the lymphatic invasion in addition to PSA, clinical T stage and GS.27 In Huang’s study, higher
PPC was associated with younger age, unfavour-able risk factors like higher T stage, GS and PSA, presence of PNI and more aggressive treatment. Association of PPC with distant metastases (DM) and correlation of PPC with OS were reported in high risk patients.28
More quantitative assessments of biopsy tumor volume, such as percentage of tumor volume (PCV) have been studied in the context of RP, brachytherapy, androgen deprivation therapy, Ex-ternal RT or combined treatments. These studies all suggested that the PCV is a more discriminating prognostic variable than the PPC.29
In our study, higher PPC (>50%) and higher TPC (≥ 50%) were all correlated with higher GS, PSA, T stage, prolonged ADT and presence of PNI (p< 0.00). Also we found that younger patients had tendency to have higher PPC and higher TPC. We could not find any relation between the age of pa-tients and PNI. On univariate analysis we found a negative correlation between the extent of cores (PPC, TPC and PNI) and CCS, BFS and DMFS.
On multivariate analysis, we evaluated PPC, TPC, PNI, GS, PSA, T stage, risk groups and we ob-tained significant association between PSA-RFS and PPC (p= 0.025) and PSA> 20 ng/ml (p= 0.002) patients. When we exclude PPC from the analysis, TPC also significantly affects the PSA-RFS (p< 0.001). We found that TPC≥ 50% patients had higher GS, PSA, T stage, PNI positivity and are in high risk group compared to PPC >%50 patients. But why couldn’t we find the predictive value of TPC when they were both calculated in same Cox analysis? We think that although the patients with TPC≥ 50% had poorer factors but could not be able to indicate significance in Cox analysis, the predictive value of PPC should have been more valuable. This is contrary to Vance’s study29 where
they reported TPC as a prognostic factor for CSS, PSA-RFS and DMFS. However in their study PPC failed to show an advantage in multivariate analy-sis. In that study they evaluated the TPC volumes in four quartiles including < 2.5%, < 10%, < 25% and ≥ 25% TPC. They reported that the NCCN high risk patients with TPC< %25 had better clini-cal outcomes than the high risk group with TPC ≥ 25%. Similarly the patients with Gleason score 8-10 and high TPC had worse outcomes than the patients with Gleason score 8-10 and low TPC. In our study we grouped TPC into TPC < 50% and TPC ≥ 50%. Although we found the similar effect of TPC, our large ranges of 50% were probably less reliable to make more precise prognostic clas-sification in comparison to Vance’s study.
In RTOG 92-02 randomized trial that studied op-timal duration of ADT, patients received 4 months of goserelin acetate and flutamid 2 months before and after RT. RT was applied to the prostate and pelvic LNs and then prostate was boosted to a total dose of 65-70 Gy. Patients then were randomized to no further therapy or 2 years goserelin acetate. Ten years of updated results of the study showed that CSS, PSA-RFS, local control and DMFS were all in favour of long term ADT. They also found OS advantage specific to GS 8-10 group that used long term ADT.30 In EORTC phase III trial RT
ver-sus RT plus ADT was compared. External RT was delivered as in RTOG 92-02 study and hormonal therapy consisted of goserelin acetate for 3 years beginning on the first day of RT. In the updated
results OS, PSA-RFS and DMFS were statistically better in the combined therapy than only RT arm.31
These trials showed that the addition of ADT to conventional dose RT resulted in clear improve-ment in treatimprove-ment outcomes like OS, BFS and DMFS.
It is also known that a BED of ≥150 Gy resulted in a 92% freedom from biochemical failure versus 62% with BED<150 Gy. The role of ADT with optimal dose escalation should be defined. In our study, high risk patients that used ADT< 1 years had bet-ter 5 years OS (p= 0.02), CSS (p= 0.05), PSA-RFS (p= 0.01) and DMFS (p= 0.07). Forty-four percent of patients using long term ADT were the patients with Gleason score 8-10. When we compared our study with RTOG and EORTC trials, the duration of hormonal therapy might be shorter and also only 6% of the patients had pelvic RT. Our RT dose was higher than their conventional RT doses. Stock et al reported excellent results with 9-12 months of ADT combined with high doses of external RT plus brachytherapy.32 The role of 6 months of ADT with
high doses of RT is being investigated in RTOG 0815 randomized trial.33
Radiation induced proctitis includes symptoms like rectal pain, diarrhea, rectal bleeding, increased fre-quency of movements and urgency. The frefre-quency of proctitis after 3D CRT of localized prostate can-cer is 5-20%.34,35 In a multicenter trial where 450
patients were treated by 3D CRT, the rate of Grade 2 and Grade 3 late rectal side effects was reported to be 21% and 3%, respectively.36 Zelefsky
report-ed Grade 3 proctitis which requirreport-ed blood transfu-sion or laser coagulation only in 15 patients (1%). It should be considered that they used either inten-sity modulated radiotherapy (IMRT) or 3DCRT in their trial and they stated a significant decline in the incidence of Grade ≥ 2 GI toxicities with IMRT.37
In our study 5% of the patients had Grade 3 late rectal toxicity which is higher than Zelefskys’s tri-al. The possible reason of high Grade 3 toxicity in our study may be the RT modality as we treated all patients with 3DCRT only. The other treatment re-lated toxicity is faecal incontinence that is thought to be caused by radiation exposure of the ano-rec-tum. The precise mechanism is not known and the relationship between dose volume parameters and the severity of faecal incontinence symptoms has
not been fully established.38 AIRO PROS 0102 trial
reported a rate of 10.9% Grade ≥1 faecal inconti-nence.39 In our study, faecal incontinence was
re-ported only in one patient. This low rate may arise from the missing data or insufficient feedback be-cause of socio-cultural level of patients.
In this study we reported out treatment results in the 3DCRT era. 3DCRT and ADT combination is an effective treatment modality with acceptable toxicities in patients with prostate cancer. However it is known that IMRT has the ability to deliver higher radiation doses to the target while sparing the normal adjacent structures. Thus we now treat prostate cancer patients with IMRT to a total dose of 76 Gy. Additionally, it is clear that PPC, TPC and PNI are independently important as prognostic markers for prostate cancer. These factors should also be incorporated to formal risk group classifi-cation to select the appropriate treatment for pa-tients. Using smaller cut off points for TPC and PPC may increase the sensibility of these markers in assessing the prognosis.
REFERENCES
1. Pilepich MV, Winter K, John MJ, et al. Phase III radiation therapy oncology group (RTOG) trial 86-10 of androgen dep-rivation adjuvant to definitive radiotherapy in locally advanced
carcinoma of the prostate. Int J Radiat Oncol Biol Phys 50:
1243-1252, 2001.
2. Laverdiere J, Nabid A, De Bedoya LD, et al. The efficacy and sequencing of a short course of androgen suppression on freedom from biochemical failure when administered with ra-diation therapy for T2-T3 prostate cancer. J Urology 2004, 171: 1137-1140, 2004.
3. Denham JW, Steigler A, Lamb DS, et al. Short-term neojuvant androgen deprivation and radiotherapy for locally ad-vanced prostate cancer: 10-year data from the TROG 96.01 randomised trial. Lancet Oncol 12: 451-459, 2011.
4. D’Amico AV, Schultz D, Silver B, et al. The clinical utility of the percent of positive prostate biopsies in predicting biochemi-cal outcome following external-beam radiation therapy for patients with clinically localized prostate cancer. Int J Radiat Oncol Biol Phys 49: 679-684, 2001.
5. Bastacky SI, Walsh PC, Epstein JI. Relationship between perineural tumor invasion on needle biopsy and radical pros-tatectomy capsular penetration in clinical stage B adenocar-cinoma of the prostate. Am J Surg Pathol 17: 336-341, 1993.
6. D’Amico AV, Whittington R, Malkowicz SB, et al. Biochemical outcome after radical prostatectomy, external beam radiation therapy, or interstitial radiation therapy for clinically localized prostate cancer. JAMA 280: 969-974, 1998.
7. Cox JD, Stetz J, Pajak TF. Toxicity criteria of the Radiation Therapy Oncology Group (RTOG) and the European Organi-zation for Research and Treatment of Cancer (EORTC). Int J Radiat Oncol Biol Phys 31: 1341-1346, 1995.
8. Dirix P, Joniau S, Van den Bergh L, et al. The role of elective pelvic radiotherapy in clinically node-negative prostate can-cer: a systematic review. Radiother Oncol 110: 45-54, 2014. 9. Ellis CL, Partin AW, Han M, Epstein JI. Adenocarcinoma of
the prostate with Gleason score 9-10 on core biopsy: cor-relation with findings at radical prostatectomy and prognosis. J Urol 190: 2068-2073, 2013.
10. Messing EM, Manola J, Yao J, et al. Immediate versus de-ferred androgen deprivation treatment in patients with node-positive prostate cancer after radical prostatectomy and pel-vic lymphadenectomy. Lancet Oncol 7: 472-479, 2006. 11. Verhagen PC, Schroder FH, Collette L, Bangma CH. Does
lo-cal treatment of the prostate in advanced and/or lymph node metastatic disease improve efficacy of androgen-deprivation therapy? A systematic review. Eur Urol 58: 261-269, 2010. 12. Crehange G, Chen CP, Hsu CC, et al. Management of
pros-tate cancer patients with lymph node involvement: a rapidly evolving paradigm. Cancer treat rev 38: 956-967, 2012. 13. Pilepich MV, Winter K, Lawton CA, et al. Androgen
suppres-sion adjuvant to definitive radiotherapy in prostate carcinoma--long-term results of phase III RTOG 85-31. Int J Radiat On-col Biol Phys 61: 1285-1290, 2005.
14. Robnett TJ, Whittington R, Malkowicz SB, et al. Long-term use of combined radiation therapy and hormonal therapy in the management of stage D1 prostate cancer. Int J Radiat Oncol Biol Phys 2002, 53: 1146-1151.
15. Epstein JI. Prognostic significance of tumor volume in radi-cal prostatectomy and needle biopsy specimens. J Urol 186: 790-797, 2011.
16. Normand G, Celhay O, Briffaux R, et al. Percentage of posi-tive biopsy cores at the onset of hormone therapy for prostate cancer: prognostic significance. Urol Int 83: 160-165, 2009. 17. D’Amico AV, Whittington R, Malkowicz SB, et al. Clinical
util-ity of the percentage of positive prostate biopsies in defining biochemical outcome after radical prostatectomy for patients with clinically localized prostate cancer. J Clin Oncol 18: 1164-1172, 2000.
18. Freedland SJ, Aronson WJ, Terris MK, et al. The percent-age of prostate needle biopsy cores with carcinoma from the more involved side of the biopsy as a predictor of prostate specific antigen recurrence after radical prostatectomy: re-sults from the Shared Equal Access Regional Cancer Hospital (SEARCH) database. Cancer 98: 2344-2350, 2003.
19. Spalding AC, Daignault S, Sandler HM, et al. Percent posi-tive biopsy cores as a prognostic factor for prostate cancer treated with external beam radiation. Urology 69: 936-940, 2007.
20. Wong WW, Schild SE, Vora SA, Halyard MY. Association of percent positive prostate biopsies and perineural invasion with biochemical outcome after external beam radiotherapy for localized prostate cancer. Int J Radiat Oncol Biol Phys 60: 24-29, 2004.
21. Kestin LL, Goldstein NS, Vicini FA, Martinez AA. Percentage of positive biopsy cores as predictor of clinical outcome in prostate cancer treated with radiotherapy. J Urol 168: 1994-1999, 2002.
22. Pe ML, Trabulsi EJ, Kedika R, et al. Effect of percentage of positive prostate biopsy cores on biochemical outcome in low-risk PCa treated with brachytherapy or 3D-CRT. Urology 73: 1328-1334, 2009.
23. Merrick GS, Butler WM, Galbreath RW, et al. Relationship between percent positive biopsies and biochemical outcome after permanent interstitial brachytherapy for clinically organ-confined carcinoma of the prostate gland. Int J Radiat Oncol Biol Phys 52: 664-673, 2002.
24. Rossi PJ, Clark PE, Papagikos MA, et al. Percentage of posi-tive biopsies associated with freedom from biochemical re-currence after low-dose-rate prostate brachytherapy alone for clinically localized prostate cancer. Urology 67: 349-353, 2006.
25. Qian Y, Feng FY, Halverson S, et al. The percent of positive biopsy cores improves prediction of prostate cancer-specific death in patients treated with dose-escalated radiotherapy. Int J Radiat Oncol Biol Phys 81: e135-142, 2011.
26. Freedland SJ, Aronson WJ, Terris MK, et al.Percent of
pros-tate needle biopsy cores with cancer is significant independ-ent predictor of prostate specific antigen recurrence follow-ing radical prostatectomy: results from SEARCH database. J Urol 2003, 169: 2136-2141.
27. Briganti A, Karakiewicz PI, Chun FK, et al. Percentage of positive biopsy cores can improve the ability to predict lymph node invasion in patients undergoing radical prostatectomy and extended pelvic lymph node dissection. Eur Urol 51: 1573-1581, 2007.
28. Huang J, Vicini FA, Williams SG, et al. Percentage of posi-tive biopsy cores: a better risk stratification model for prostate cancer? Int J Radiat Oncol Biol Phys 83: 1141-1148, 2012. 29. Vance SM, Stenmark MH, Blas K, et al. Percentage of
can-cer volume in biopsy cores is prognostic for prostate cancan-cer death and overall survival in patients treated with dose-es-calated external beam radiotherapy. Int J Radiat Oncol Biol Phys 83: 940-946, 2012.
30. Horwitz EM, Bae K, Hanks GE, et al. Ten-year follow-up of radiation therapy oncology group protocol 92-02: a phase III trial of the duration of elective androgen deprivation in lo-cally advanced prostate cancer. J Clin Oncol 26: 2497-2504, 2008.
31. Bolla M, Van Tienhoven G, Warde P, et al. External irradiation with or without long-term androgen suppression for prostate cancer with high metastatic risk: 10-year results of an EORTC randomised study. Lancet Oncol 11: 1066-1073, 2010. 32. Ko EC, Liu JT, Stone NN, Stock RG. Association of early PSA
failure time with increased distant metastasis and decreased survival in prostate brachytherapy patients. Radiother Oncol 110: 261-267, 2014.
33. Cheney MD, Chen MH, Zhang D, et al. Greatest percentage of involved core length and the risk of death from prostate cancer in men with highest Gleason score >/= 7. Clin Geni-tourin Cancer 12: 234-240, 2014.
34. Nichol A, Chung P, Lockwood G, et al. A phase II study of lo-calized prostate cancer treated to 75.6 Gy with 3D conformal radiotherapy. Radiother Oncol 76: 11-17, 2005.
35. Rancati T, Fiorino C, Gagliardi G, et al. Fitting late rectal bleeding data using different NTCP models: results from an Italian multi-centric study (AIROPROS0101). Radiotherapy and oncology : journal of the European Society for Therapeu-tic Radiology and Oncology 73: 21-32, 2004.
36. Goldner G, Tomicek B, Becker G, et al. Proctitis after exter-nal-beam radiotherapy for prostate cancer classified by Vi-enna Rectoscopy Score and correlated with EORTC/RTOG score for late rectal toxicity: results of a prospective multi-center study of 166 patients. Int J Radiat Oncol Biol Phys 67: 78-83, 2007.
37. Zelefsky MJ, Levin EJ, Hunt M, et al. Incidence of late rectal and urinary toxicities after three-dimensional conformal ra-diotherapy and intensity-modulated rara-diotherapy for localized prostate cancer. Int J Radiat Oncol Biol Phys 70: 1124-1129, 2008.
38. Maeda Y, Hoyer M, Lundby L, Norton C. Faecal incontinence following radiotherapy for prostate cancer: a systematic re-view. Radiother Oncol 98: 145-153, 2011.
39. Tomatis S, Rancati T, Fiorino C, et al. Late rectal bleeding after 3D-CRT for prostate cancer: development of a neural-network-based predictive model. Phys Med Biol 57: 1399-1412, 2012.
Correspondence
Dr. Fadıl AKYOL
Hacettepe Üniversitesi Tıp Fakültesi Radyasyon Onkolojisi Anabilim Dalı 06100, Sihhiye, ANKARA / TURKEY Tel: (+90-312) 305 29 00