Abstract
In this study, the statistics properties of the aftershock sequence and coulomb stress changes due to the mainshock of the 𝑀𝑤= 6.3, 9 April 2013 Shonbeh earthquake have been studied. The spatial distribution of aftershocks and focal mechanism event with 𝑀𝑤≥5.0 declared a NW–SE striking rupture with oblique thrust fault mechanism. The b-value is estimated as 0.77± 0.05 and the mainshock occurred in a highly stressed region and sequence comprised larger magnitude aftershocks due to the presence of large size asperities within the rupture zone. Also the high p-value (1.16 ± 0.05), implying fast decay rate of aftershocks, evidences high surface heat flux. A value of the spatial fractal dimension (𝐷𝑐) equal to 2.60 ± 0.02 indicates random spatial distribution and source in a two-dimensional plane that is being filled-up by fractures. Moreover, the evaluated coseismic Coulomb stress using the variable slip model for depth range 0–20 km reveals a ‘butterfly’ pattern and most of the aftershocks fall (95%) in the region of enhanced Coulomb stress.
Keywords: Shonbeh Earthquake, aftershock sequence, statistics properties, Coulomb stress changes, spatial distribution,
1. Introduction
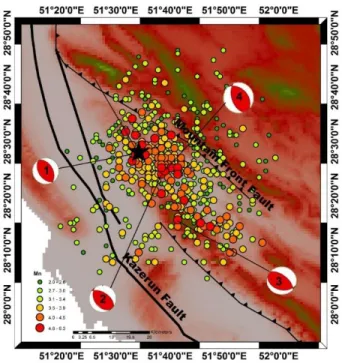
The Shonbeh earthquake 𝑀𝑤=6.3 (IGUT) occurred on 9 April 2013 at 11:52 UTC (16:22 local time). The mainshock was at a depth of 11.3 km with the epicenter located in the sparsely populated Borazjan region in South of Iran. This event occurred in Eastern side of Kazerun fault which known SE Zagros (Fig.1).
Accepted Date: 12.11.2015 Corresponding author: Hiwa Mohammadi, PhD
Shiraz University, Department of Earth Sciences, Iran E-mail: [email protected]
The Zagros Fold-and-Thrust Belt is one of the most seismically active regions of the world. It seems earthquakes in the Zagros belt are limited to the upper continental crust with depths less than 20 km, with no evidence for a seismically active subduction slab dipping NE beneath Central Iran (MAGGI et al. 2000a,b; JACKSON et al. 2002; TALEBIAN and JACKSON 2004; TATAR et al. 2004; ENGDAHL et al. 2006). The majority of seismicity in the Zagros happens within the late
Neoproterozoic basement longitudinal reverse and
transverse right-lateral strike-slip master faults, separated from the top sedimentary cover folds along the Upper Vendian–Lower Cambrian Hormoz Salt decollement, with
smaller events happening throughout the belt
(BERBERIAN 1976, 1981, 1995; BERBERIAN and NAVAI 1977, 1978; BERBERIAN et al. 1977; BERBERIAN and PAPASTAMATIOU 1978; MAGGI et al., 2000a,b; TALEBIAN and JACKSON 2004).
However, the intensity of the mainshock was VII-VIII on the modified Mercalli Intensity (MMI) scale in and around the mainshock epicenter (USGS). However, the earthquake killed at least 37 and hurt more than 950 people and also the event ruined 100 houses, left 1000 homeless, and damaged 500 more houses in nearby villages (ESMAEILII et al. 2013). The most precise location is the estimate from the Institute of Geophysics at University of Tehran (IGUT), based on their permanent seismic stations. IGUT determined this event at 28.467N and 51.568E. In the present study, we employed the Institute of Geophysics, University of Tehran (IGUT) data. The Shonbeh aftershocks sequence consists of more than 602 earthquakes
of 2.0≤𝑀𝑁≤ 6.3 documented by IGUT from April 9, 2013
till December 31, 2013 (Fig.2). The focal mechanism solution obtained by IGUT shows mostly reverse component with very slightly right-lateral strike-slip component. The focal mechanism of the mainshock and aftershocks with 𝑀𝑤 ≥ 5.0 are presented in Fig. 2 via beach balls and listed in Table 1. All the aftershocks 𝑀𝑤≥5.0 show oblique thrust fault mechanism. The focal
The 𝑀
𝑤6.3 Shonbeh (Bushehr) mainshock, and its aftershock sequence: Tectonic
implications and seismicity triggering
HIWA MOHAMMADI1*, YUSUF BAYRAK2
1
Shiraz University, Department of Earth Sciences IRAN
mechanisms of the Shonbeh mainshock and its aftershocks confirm that this area is under compressional regime and the thrust faults that resulted to this regime are effective in the neotectonics of the region.
Routinely, it has been accepted that aftershocks commonly happen after large earthquakes and it is assumed that they are motivated by stress transfer during an event. When an event happens there are neighbor regions where the stress is raised. Also They as well as display an outcome of intricate triggering mechanisms which move in a highly heterogeneous system of non-linearly cooperation faults accommodated in a visco-elastic medium (BEN-ZION 2008). In other words, relaxation of these stresses causes aftershocks (RYBICKI 1973; MENDOZA and HARTZELL 1988; KING et al. 1994; HARDEBECK et al. 1998). Thus, a profound conception of physics and mechanisms of aftershocks is thus of crucial importance. The present study proposes preparing detailed and precise statistical inferences about the Shonbeh aftershocks sequence. In this respect, Statistical evolution of the aftershock data was further carried out (b-value, p-value, 𝐷𝑐-value and slip rate) in an effort to make light to the seismotectonic properties of the area. Also, Coulomb stress changes due to the mainshock coseismic slip were evaluated so as to explicate the aftershock activity.
2. Tectonics
The NW-SE striking Zagros fold-and-thrust belt is a region of active continental collision. This belt agrees with to a continental accretionary prism within the Arabian plate,
which accordance about 10 mm/yr of NNE trending shortening, between Eurasian and Arabian (TATAR et al. 2002). Also, this orogenic belt estimates at 1500 km long with a 250-400 km wide. It extends from eastern Turkey to the Oman Gulf, where it ends out at the Makran subduction zone. To the East, the E-W-striking Makran belt is the emerged part of an accretionary prism resulting from the subduction of the Oman Gulf oceanic lithosphere under the Iranian platelet (BYRNE et al. 1992; MCCALL 1997). Thus, continental collision between the Eurasian and Arabian plates has happened along the Zagros Suture Zone and continual subduction among the Eurasian and Arabian plates has resulted in the foundation of the Makran ranges in the SE of the Iranian Plateau (JACOB and QUITTMEYER 1979). However, Zagros has separated from Makran by Zendan-Minab fault system in the Western part.
Figure 2. Epicentral location of Shonbeh earthquake sequence (mainshock (Black star) and aftershocks) occurred during the period of April 9–December 31, 2013.
Figure 1. Tectonic and geomorphological map of the SE Zagros
Moreover, Zagros includes about 6–14 km of sedimentary rocks covering the Precambrian metamorphic basement with a thick sequence of Late Upper Vendian– ower Cambrian Hormoz Salt deposits acting as a decollement zone (JAMES and WYND 1965; STOCKLIN, 1968; BERBERIAN 1976, 1995; BERBERIAN and KING 1981).
Almost half of the GPS-derived convergence rate between the Arabian plate and Central Iran (10±4 mm/year) is embedded in the
Zagros by north–south crustal shortening and strike-slip faults oblique to the strike of the belt (BERBERIAN 2014). The convergence rate is regressive from 9±2 mm/year in the southeastern Zagros to 7±2 mm/year near the longitude of Kazerun in central Zagros and to 4.5±2 mm/year in the northwest (TATAR et al. 2002; NILFOROUSHAN et al. 2003; VERNANT et al. 2004).
However, Zagros Fold-and-Thrust Belt is detached into two discrete along-strike blocks via the north–south-trending Kazerun Fault (Fig. 1). The Kazerun fault zone is one of the most prominent features in the Zagros; it obliquely truncates the northwest–southeast trending Zagros Fold-and-Thrust Belt. As previously mentioned, the Shonbeh mainshock has occurred in Eastern side of Kazerun Fault which known SE of Zagros. It should be noted that the eastern side of the Kazerun fault zone, has its own tectonics and seismicity that differ from those of the other parts of the Zagros Fold-and-Thrust belt as a result of the hydrocarbon fields, many salt diapirs, the major strike-slip faults stretched obliquely to the main trend of the Zagros and the anticlines pierced by the salt diapirs and penetrated by active blind faults (SARKARINEJAD et al 2012). Another significant structure which has an important role in present seismicity, topography and geometry of folds of Zagros Fold-and-Thrust is Mountain Front Fault (MFF). The MFF is forcefully segmented (MOLINARO et al. 2005; MOUTHEREAU et al. 2006) by dextral transfer zones (e.g., the Izeh-Hendijan Fault, the Kharg-Mish Fault and the Kazerun Fault) that well-developed as a partner inherited basement normal faults (mainly oriented N–S). The MFF coincides with the 1500 m contour and the major zone of earthquake activity in the southwest of the Simply Folded Belt (ZAMANI and AGH-ATABAI, 2009).
1. Statistical properties of the aftershock sequence Many statistical methods have been employed to research on the seismic characteristics in time, space, and
size of earthquakes and aftershock sequence (UTSU 1961; BATH 1965; RANALLI 1969; PAPAZACHOS 1971;
DRAKATOS and LATOUSSAKIS 1996, 2001;
DRAKATOS 2000; TELESCA et al. 2001;
SHCHERBAKOV and TURCOTTE 2004; YADAV et al. 2011, 2012; BAYRAK et al. 2013). In the following subsections, we inspect the physical properties of the Shonbeh earthquake sequence on the basis of generally admitted and extensively used empirical and statistical laws.
3.1. Frequency–magnitude scaling relationship One of the power-law relations commonly applied in seismicity studies is the frequency-magnitude earthquake
distribution, FMD (ISHIMOTO and IIDA 1939;
GUTENBERG and RICHTER 1942),
𝑙𝑜𝑔10𝑁𝑚= 𝑎𝑚− 𝑏𝑀 (1)
which predicts the distribution of earthquakes with respect to magnitude. In Eq. (1), M is magnitude, a and b are constants and N is number of earthquakes equal to or larger than M. The parameter 'b' is very significant in seismology for its affiliation with various geotectonic characteristics of a region (MOGI 1967; SCHOLZ 1968). Its significance for dealing problems of earthquake predict (WYSS 1973; PAPAZACHOS 1975) or quantifying seismicity (ALLEN et al. 1965) has widely been employed by
the seismologists for the last many years. On a local scale, the b-value has been reported to exhibit a comparatively broad range of variation (0.3 to 2.5 more; e.g. SCHOLZ 1968; UTSU 1971; SMITH 1981; IMOTO 1991; WIEMER et al. 1998; JAUME and SYKES 1999, NUANNIN 2006). These changes have been illustrated to arise from one or more of the subsequent factors: tectonic setting, crustal heterogeneity, focal depth, predominant stress state, incomplete catalog data, pore pressure, geothermal gradient,
petrological/environmental/geophysical specifications,
clustering of events, and/or method of calculation. Except the latter, all of these elements appear to be connected, directly or indirectly, with the impressive condition of stress (EL-ISA and EATON 2013). However, the b-value is in most cases close to unity for long time periods and large areas. Locally, the b-value not merely indicates the relative ratio of the number of large and small earthquakes in the region, but it is also associated to the stress situation over the region (MOGI 1962). It seems b-value larger than 1.0 depicts regions of low applied stress and crustal heterogeneity, whereas values lower than 1.0 depicts high differential stress and crustal homogeneity (WIEMER and KATSUMATA 1999; WIEMER and WYSS 2002; YADAV 2009; YADAV et al. 2011).
One of the most suitable theoretical ideas related to b-value variations is that an earthquake fault includes of locked segments that resist asperities where stress is concentrated (GÖRGÜN et al. 2009; LEI 2003; SCHORLEMMER and WIEMER 2005; WIEMER and KATSUMATA 1999; ZHAO and WU 2008).
However, there are different methods used to compute the b-value, in the present research we assessment b-value based on the method of the maximum likelihood, where the process is implicit by Eq. (1). The Maximum likelihood (ML) method is the most rugged and widely accepted method in which b-value is calculated using the formula (AKI 1965).
𝑏 = 1
𝑙𝑜𝑔10[𝑀̅̅̅̅̅̅̅̅̅̅̅̅̅̅̅̅̅̅̅̅̅̅̅−(𝑀𝑚𝑖𝑛−𝛥𝑀2 )]
(2)
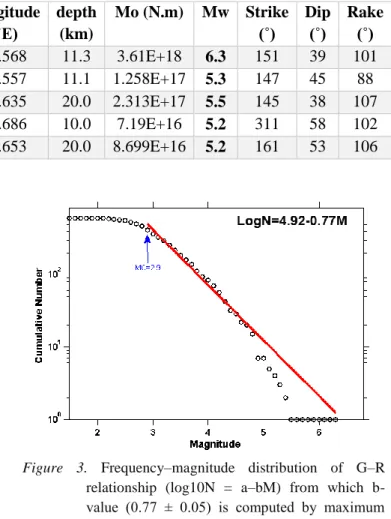
Where 𝑀𝑚𝑖𝑛 is the minimum magnitude or threshold magnitude or magnitude of completeness (𝑀𝑐) for the earthquakes, 𝑀̅ is the mean magnitude and ΔM is the magnitude resolution. The minimum magnitude of completeness (𝑀𝑐) is an important parameter in seismicity studies. This is the threshold magnitude for complete reporting of earthquake magnitude. Estimation of 𝑀𝑐 can be made by the assumption of Gutenberg–Richter’s power-law distribution against magnitude (WIEMER and WYSS 2002). The threshold magnitude (𝑀𝑚𝑖𝑛) for Shonbeh sequence was found equal to 2.9 with 90% goodness of fit level (Fig. 3). The a and
b-values for Shonbeh sequence were establish equal to 4.92 and 0.77± 0.05, respectively. The b-value is lower than the global mean value of 1.0, which indicates that the Shonbeh sequence consists of larger magnitude aftershocks and high differential crustal stress in the regime (WIEMER and KATSUMATA 1999; WIEMER and WYSS 2002).
3.2.
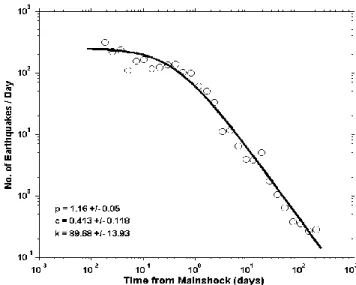
Decay rate of aftershock activity — Omori-Utsu lawIt is broadly realized that the decay rate of aftershock activity with time is ruled by the modified Omori law or Omori-Utsu law (UTSU et al. 1995).
𝑵(𝒕) =(𝑪+𝒕)𝑲 𝒑 (3)
Figure 3. Frequency–magnitude distribution of G–R relationship (log10N = a–bM) from which b-value (0.77 ± 0.05) is computed by maximum likelihood estimation method. (𝑀𝐶 = 2.9 shows the magnitude of completeness).
where t shows the elapsed time since the mainshock; K, c and p are constants. K depends on the whole number of earthquakes in the sequence, c on the rate of activity in the earliest part of the sequence and p is associated to the power law decay of aftershocks. Among these parameters, p is the most considerable and important. It variation is among 0.6– 1.8 (WIEMER and KATSUMATA 1999; OLSSEN 1999). The aftershock decay is idea to reflect the stress rearrangement pursuing the stress variations due to the mainshock (BEN-ZION 2008). Stress readjustment can be Table 1. Source parameters and focal mechanism solutions of mainshock and aftershocks 𝑀𝑤≥5.0 in the Shonbeh earthquake sequence shown in Fig 2.
ID
Date
Time
Latitude
(˚N)
Longitude
(˚E)
depth
(km)
Mo (N.m) Mw Strike
(˚)
Dip
(˚)
Rake
(˚)
Main Shock
20130409 11:52:49
28.467
51.568
11.3
3.61E+18
6.3
151
39
101
1-Aftershock
20130409 12:05:41
28.456
51.557
11.1
1.258E+17
5.3
147
45
88
2-Aftershock
20130410
1:58:28
28.396
51.635
20.0
2.313E+17
5.5
145
38
107
3-Aftershock
20130410
7:10:40
28.264
51.686
10.0
7.19E+16
5.2
311
58
102
considered to reflect the intricate relaxation processes
(STEIN and WYSESSION 2003), and structural
heterogeneity in the source volume (KISSLINGER and JONES 1991; UTSU et al. 1995) associated to the tectonic structure of the region. However, it is not obvious which physical items are important in governing the p-value. It seems p is individualistic of the threshold magnitude, 𝑀𝑐. But c-value mostly shows powerful adherence on 𝑀𝑐. (UTSU 2002). This is most plausible due to missing data shortly after the main shock when multiple small aftershocks are not discernible on records.
The cause of disorderly of the p-value in the crust is weakly understood. It may be attributed to different items. For example, KISSLINGER and JONES (1991) argued a conceivable effect of the regional crustal heat flow in the source volume and LIU (1984) propounded that p<1 is routinely for normal aftershock sequences, while p>1 is seen for aftershock sequences prior another larger main shock. MOGI (1962) referred the variation of p to stress, structural heterogeneities and temperature in the crust (p increases with increasing temperature). Therefore, a great number of notice is paid in the calculation of the p-value
using the maximum likelihood as advised by
NYFFENGGER and FROLICH (1998, 2000).
The maximum likelihood method is used to calculate the values of constant K, p and c of Eq. (3) for this sequence and illustrated in Fig. 4.
Figure 4. Decay rate of aftershock activity versus time after the mainshock for events with magnitude greater or equal to mc by using the modified Omori law. The parameters of the relation p, k and c and their standard deviations are given on the graph.
A p-value 1.16 ± 0.05 was calculated for this sequence, which is higher value compared to the usual values of the order of 1.0. Also, this high p-value shows evidences a quick decay of aftershock activity and evidences high surface heat flux.
3.3 Spatial aftershock distribution
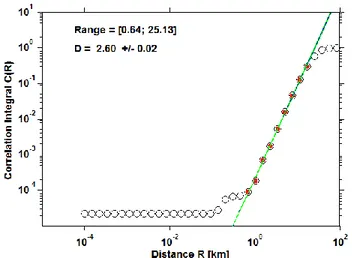
Concepts of fractal dimensions can be applied to study self-similarity of phenomena and processes of fault tectonics and seismicity. Especially, Seismicity is a good sample of an intricate phenomenon that can be accounted using fractal theory (TURCOTTE 1997). The fractal distributions are the only distributions that do not consist a specification length scale, and thus, are appropriate to scale invariant phenomena. The fractal dimension (𝐷𝑐) values are computed using the correlation dimension. The correlation
dimension as specified by GRASSBERGER and
PROCACCI (1983) measures the spacing of the set of points, which in this case are the earthquake epicenters and is given as
𝐷𝑐 = lim𝑟⇢0[𝑙𝑜𝑔𝐶(𝑟)/𝑙𝑜𝑔𝑟] (4) where C(r) is the correlation function. The correlation function measures the spacing or clustering of a set of points, here the earthquake epicenters, and is given by the relation:
𝐶(𝑟) = 2𝑁𝑅<𝑟/𝑁(𝑁 − 1) (5)
where 𝑁𝑅<𝑟is the number of pairs (Xi, Xj) with a smaller distance than r. If the epicenter distribution has a fractal structure, the following relation is obtained:
𝐶(𝑟) ∼ 𝑟𝐷 (6)
where D is a fractal dimension, more strictly, the correlation dimension (GRASSBERGER and PROCACC 1983). Using this relation, the fractal dimension of spatial distribution of the earthquakes is estimated. By plotting C(r) against r on a double logarithmic coordinate, the fractal dimension D is obtained from the slope of the graph. The distance r between two events, (𝛩1, 𝜙1) and (𝛩2, 𝜙2), is calculated by using a spherical triangle as given by HIRATA (1989):
𝑟 = 𝑐𝑜𝑠−1 [𝑐𝑜𝑠𝛩1𝑐𝑜𝑠𝛩2 + 𝑠𝑖𝑛𝛩1𝑠𝑖𝑛𝛩2𝑐𝑜𝑠 (𝜙1 − 𝜙2) (7)
The slope is obtained by fitting a least-square line in the scaling region.
We calculated spatial fractal dimension for the Shonbeh sequence from the double-logarithmic plot of the correlation integral and distance between hypocenters (Fig. 5), and found it to be equal to 2.60 ± 0.02. The Dc -value
larger than 2, although the three dimensional space was considered, declares that the events are randomly distributed into the fault zone crustal volume, whilst much of this volume seems free from hypocenters.
Figure 5. Fractal dimension (𝐷𝑐-value) from correlation integral for the Shonbeh earthquake sequence. The standard deviation and the scaling range are displayed in the plot.
3.3.
Slip ratio estimationThe rate of slip released throughout a seismic sequence may be partially attributed to the mainshock and also to the aftershock activity. Routinely, a fraction of whole slip happens in primary fault system creating the largest (and also smallest) event and the rest happens on the secondary faults (KHATTRI 1995). The ratio of slip happened on the primary fault to the whole slip is identified as the slip ratio, which can be evaluate using spatial fractal dimension as
𝑆𝑃
𝑆 = 1 − 2
−(3−𝐷) (8)
where 𝑆𝑝 is the slip on primary fault and S is the total slip (KHATTRI 1995; DIMRI et al 2005). In the case of Dc=3, the whole rate of slip is escaped on the secondary (smaller) faults, whilst in the case of Dc=0, the whole slip released on the primary fault. In Shonbeh sequence, with Dc=2.60, the slip ratio is found equal to 0.24. In other words, 24% of the whole slip accommodates the primary rupture during the Shonbeh sequence.
4.
Coseismic Coulomb stress changes and triggering of seismic activityThe classical methods of seismic risk evaluation are generally founded on the empirical analysis of statistical methods (AKI 1981; STEIN 2003). In other words, these models do not consist dynamic mechanism of earthquake occurrences, thus these models of seismic risk evaluation are not extremely reliable. In order to become better the validity of assessing the tendency of earthquake assessment and seismic hazard, the mechanism of earthquake incident and triggering process must be brought into regard. When an earthquake happens, regional strain stored by tectonic movement is released via the rupture of mainshock. However, stored stress does not disappear instantly, but re-distributes via the procedure of stress transfer, which could trigger consecutive earthquakes as forecasted by the stress triggering theory (STEIN 2003). According to this theory, the increased (positive) coulomb stress due to coseismic displacement on faults enhances the coulomb stress in some areas and triggers seismic activities. In contradiction, decreased coulomb stress in regions of stress shadow may dissemination the stress on faults and dispirit earthquake activities. In recent years, a number of prior works have successfully employed the Coulomb Failure Stress model to explain the aftershock distribution (DENG and SYKES 1997a, b; KING et al. 1994; STEIN 1999, 2003; YADAV et al. 2010; YADAV et al. 2012; BAYRAK et al 2013), triggering of moderate to strong earthquakes (DENG and SYKES 1996; HARRIS et al. 1995; JAUME and SYKES 1996) and earthquake sequence (NALBANT et al. 1998; STEIN et al. 1994; XIONG et al. 2010).
However, in its most elementary form, the Coulomb failure stress change, Δ𝐶𝐹𝐹 (also written ΔCFS) is
Δ𝐶𝐹𝐹 = 𝛥τ+µ′ (𝛥𝜎
𝑛+ 𝛥𝑃) (9) where τ is the shear stress, and µ′is the apparent coefficient of friction and 𝜎𝑛 is the normal stress. The change in shear stress 𝛥τ is positive in direction of the slip of the following earthquake (the receiver fault); 𝜎𝑛is positive for increasing unclamping normal stress. The equation implies that regional faults that lie in areas of positive Δ𝐶𝐹𝐹 are brought closer to failure, whereas faults that lie in areas of negative Δ𝐶𝐹𝐹 are brought further away from failure (FREED 2005).
Commonly, coulomb stress variations among 0.1 and 1 bar are adequate to trigger the subsequent earthquakes. Nevertheless, on that point is no threshold for stress
triggering (ZIV and RUBIN 2000). In other words, earthquake activity may be promoted when stress is increased on a fault by as slight as 0.1 bars (STEIN 1999). Small increases in stress due to earlier earthquake activity (e.g., HARRIS 1998; STEIN 1999; KING and COCCO 2001; STEACY et al. 2005), an increase in pore pressure from fluid injection or reservoir impoundment (e.g., NUR and BOOKER 1972; ZOBACK and HARJES 1997; GAHALAUT and HASSOUP 2012), dynamic stress changes due to passing seismic waves (e.g., GOMBERG et al. 2001, 2003), or even tidal stress (e.g., COCHRAN et al. 2004; STROUP et al. 2007, 2009; CRONE et al. 2011) can trigger earthquakes. STIEN (2004) found that tidal stress change is of the order of 0.01 bar and is capable of earthquake triggering. It is only the delay and advance in triggering, which appertains upon the amount of stress change (YADAV et al. 2012). The 1-bar stress rise contributed by the neighbor earthquakes may indicate about 150–250 year of typical stress accumulation (KING et al. 1994).
However, the friction coefficient on a fault is not easy to calculate instantly as well, hence, the empirical values have been elicited in some past studies (KING et al. 1994). The friction coefficient limits among 0.0 - 0.8, and the middle value 0.4 is routinely used (KING et al. 1994; PARSONS et al. 1999) for common faults by supposing earthquake ruptures as rectangular dislocation surfaces in an elastic half-space. By the way, I used the shear modulus (G) 3.2 × 10⁵ bar, Poisson ratio (ν) 0.25, Young modulus (E) 8 × 10⁵. All computations were taken out using the Coulomb 3.3 software (TODA et al. 2011).
The focal mechanism of the Shonbeh mainshock is reverse faulting with a very slight right-lateral component, with strike = 151°, dip = 39° and rake = 101°. The well-known empirical relationships developed by WELLS and COPPERSMITH (1994) have been applied to evaluate the subsurface rupture length (=16.4km) and subsurface rupture width (=9.77 km). The reverse component slip and right-lateral strike-slip component was computed as 63.9 cm and 12.4 cm, respectively using the relation 𝑀0 = µAD, assuming a shear modulus (l) of 3.2 * 105 bars (STEIN et al. 1994). Therefore, we calculated coseismic Coulomb stress changes due to the mainshock to analyze the correlation between increased Coulomb stress regions and locations of aftershock activity. The coseismic coulomb stress changes were determined on an optimally - oriented plane of reverse fault.
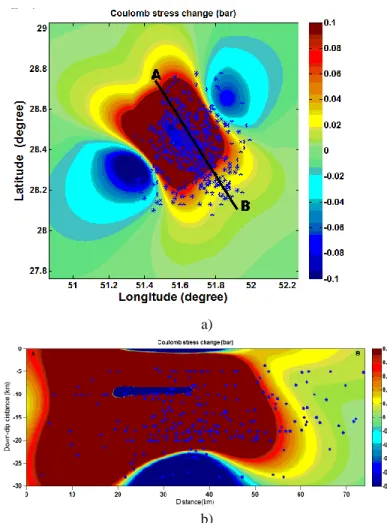
The resultant coulomb stress modeling for the Shonbeh mainshock for depth range 0–20 km is shown in
Fig.6a. At first glimpse, the calculated coulomb stress changes for the Shonbeh earthquake presents a ‘butterfly’ type with positive (enhanced) coulomb stress as the extensions of the butterfly.
a)
b)
Figure 6. a) Combined coseismic coulomb stress changes (in bars) due to the mainshock (𝑀𝑊 6.3) which
occurred on April 9, 2013, within depth range of 0–20 km for effective coefficient of friction 0.4 and it is resolved on optimally-oriented fault plane for reverse. The locations of aftershocks occurred during the period April 9–December 31, 2013 are shown with blue stars. It is observed that maximum number of aftershocks fall in the region of positive coulomb stress. b) The cross-sectional view of Coulomb stress along line AB.
This kind of stress distributions (‘dog-bone’) are also seen by TODA et al. (2002) and BAYRAK et al (2013). It is shown that most of the Shonbeh aftershocks happened in positive coulomb stress regions, suggesting that these
shocks were triggered due to the transfer of positive coulomb stress by the mainshock. Moreover, the best located aftershocks (Blue Stars) are also presented in this figure, being more plentiful in stress positive areas of more than 0.1 bar. In other words, in Fig.6a we can see that over than 95% of aftershocks which occurred on April 9, 2013– December 31, 2013 placed in positive lobe of stress. Also as shown in Fig.6a we can see that a few of aftershocks drop in decreased lobe of stress.
HARRIS and SIMPSON (1996) concluded that a few aftershocks or triggered earthquakes should happen in such regions if the coulomb hypothesis is valid. Also, it is deduced that aftershock cloud is placed in enhanced coulomb stress region and nearby the ledges of fault rupture due to accumulation of slip; the stress field has been settled along line AB which is parallel to rupture and pictured in Fig. 6b along with aftershock activity. It is documented that coseismic slip of the Shonbeh earthquake triggered much of the aftershocks at these locations exclusively.
5.
Results and ConclusionIn the present research, seismogenesis and earthquake triggering during the Shonbeh sequence have been researched using statistical models and coseismic coulomb stress modeling. For this objective, b-value, p-value, 𝐷𝑐 -value, slip ratio and coulomb stress transfer have been computed. For this analyze, we used aftershocks data from IGUT catalog during the period April 9–December 31, 2013.It should be noted, the causative fault related with the Shonbeh sequence has a NW–SE strike, as documented by both, spatial aftershock distribution and fault plane solution determined for the events with 𝑀𝑤≥5.0. However, It seems causative fault of this event is parallel with MFF.
Elucidation of the b-value of earthquake frequency–
magnitude distributions has received substantial
consideration in recent decades. The b-value of the Gutenberg–Richter frequency magnitude calculated in this research using the maximum likelihood estimation. To extract credible b-value estimates, events with magnitude above the threshold magnitude of completeness 𝑀𝑐 were pick out, using the maximum curvature method. The magnitude above which all events have been recorded, 𝑀𝑐, is significant and meaningful value for seismicity- based researches because it is essential to use the maximum number of events to make certain high quality, which leads often to underestimation of 𝑀𝐶 (WIEMER and WYSS 2002). With a completeness magnitude (𝑀𝐶) of 2.9, as found for the whole sequence, the b-value was calculated
equal to 0.77±0.5. This b-value suggests that the region is exhibited by high differential stress and the production of high aftershock activity. The low b-value also corresponds to the occurrence of larger size aftershocks, which resulted due to the presence of large size asperities in the rupture zone. The decay properties of Shonbeh aftershock sequence is studied in terms of p-value of modified Omori law. The p-value is observed as low as 1.16±0.05, which is higher than the mean value (1.0). The higher p-value implies faster decay of aftershock activity. The fractal dimension 𝐷𝑐 has been derived using the integral correlation and used to appreciate the slip ratio on the primary fault segment for each aftershock sequence. The fractal dimension (𝐷𝑐 ) adequate to 2.60 ± 0.02 reveals that events are randomly distributed into a two-dimensional fault plane that’s being stuffed up by fractures. Also, the slip ratio has been evaluated with the result of fractal dimension and seen that 24% of the entire slip happened on the primary fault whereas large part of slip happened on secondary fault systems which depicts that aftershocks happened on highly fractured rock mass.
Several researcher (e.g. TODA and STEIN 2002; GAHALAUT et al. 2003; KARAKOSTAS et al. 2003, 2004; GAHALAUT et al. 2004; RAJPUT et al. 2005; GAHALAUT 2008; YADAV et al. 2011, 2012; CHOULIARAS et al. 2013; BAYRAK et al. 2013) considered the aftershock triggering owing to transfer of coulomb stress variations. However, triggering does not state that the coseismic stress variations associated with one earthquake is enough to produce another earthquake at an originally stress-free location. It state that stress at the situation of the second earthquake formerly is near adequate to failure so that the first earthquake can ‘trigger’ the second one or move the fault into the failure regime by showing a little positive increase in coulomb stress (PAPADIMITRIOU and SYKES 2001; PAPADIMITRIOU 2002). In the present research, we employed coseismic coulomb stress modeling for the Shonbeh earthquake using a variable slip model which reveals a ‘butterfly’ type of stress distribution with earthquake rupture collapsing in the
positive (enhanced) Coulomb stress region. The
intercommunity among aftershock distribution and
increased Coulomb stress region indicates that more 95% aftershocks have been triggered by transfer of increased Coulomb stress due to coseismic slip of mainshock.
Acknowledgments
We acknowledge IGUT, for providing their data for analysis. The Computer programs, Coulomb 3.3 (TODA et
al. 2011) and Zmap (WIEMER 2001) were used in different processing steps.
REFERENCES
AKI, K., 1965. Maximum likelihood estimate of b in the formula log N = a − bM and its confidence limits. Bull. Earthq. Res. Inst., Univ. Tokyo 43, 237–239.
AKI, K., (1981), A probabilistic synthesis of precursory phenomena. In: Simpson, D.W., Richards, P.G. (Eds.), Earthquake Prediction: An International Review. AGU, Washington, DC, pp. 566–574.
ALLEN, C., AMAND, P., RICHTER, P., and
NORDQUIST, J., (1965), Relation between seismicity and geological structure in the southern California region, Bull. Seismol. Soc. Am. 55, 752-797.
BATH, M., (1965), Lateral inhomogeneties in the upper mantle. Tectonophysics. 2, 483– 514.
BAYRAK, Y., YADAV, R.B.S., KALFAT, D.,
TSAPANOS, T.M., ÇINAR, H., SINGH, A.P., BAYRAK, E,. YILMAZ Ş., ÖCAL, F., and KORAVOS, G., (2013), Seismogenesis and earthquake triggering during the Van (Turkey) 2011 seismic sequence. Tectonophysics. 601 (2013) 163–176.
BERBERIAN, M., (1976), Contribution to the
Seismotectonics of Iran (Part II). In: Berberian, M. (Ed.), vol. 39. Geol. Surv. Iran. 518 pp. (in English).
BERBERIAN, M., (1981), Active faulting and tectonics of Iran. In: Gupta, H.K., Delany, F.M. (Eds.), Zagros-Hindu Kush-Himalaya: Geodynamic Evolution, Am. Geophys. Union, Geodynamics Series.vol. 3, pp. 33–69.
BERBERIAN, M., (1995), Master ‘Blind’ thrust faults hidden under the Zagros folds: active basement tectonics and surface morphotectonics. Tectonophysics. 241, 193–224.
BERBERIAN, M., (2014) “Earthquake and Coseismic surface faulting on the Iranian Plateau; A HISTORICAL, SOCIAL, AND PHYSICAL APPROACH. 1st Edition” Elsevier, PUBLISHING JUNE 2014, ISBN :9780444632920, 770pp.
BERBERIAN, M., and NAVAI, I., (1977), Naghan (Chahar Mahal Bakhtiari, High Zagros, Iran) earthquake of April 6, 1977; a preliminary field report and a seismotectonic discussion. In: Berberian, M. (Ed.), Contribution to the Seismotectonics of Iran, Part III. Geol. Min. Surv. Iran. vol. 40, pp. 51–78.
BERBERIAN, M., and NAVAI, I., (1978), Naghan (Chahar Mahal Bakhtiari-High Zagros, Iran) earthquake of 6 April 1977; A preliminary field report and a seismotectonic discussion. Annali Geofis. 31, 5–27.
BERBERIAN, M., and PAPASTAMATIOU, D., (1978), Kurgu (north Bandar Abbas, Iran), earthquake of March 21, 1977; a preliminary field report and a seismotectonic discussion. Bull. Seismol. Soc. Am. 68 (2), 411–428.
BERBERIAN, M., and KING, G.C.P., (1981), Towards a paleogeography and tectonic evolution of Iran. Can. J. Earth Sci. 18 (2), 210–265.
BERBERIAN, M., PAPASTAMATIOU, D., and
QORAISHI, M., (1977), Khurgu (north Bandar Abbas-Iran) earthquake of March 21, 1977: a preliminary field report and a seismotectonic discussion. In: Berberian, M. (Ed.), Contribution to the Seismotectonics of Iran, Part III. Geol. Min. Surv. Iran, vol. 40, pp. 7–50 (in English).
BEN-ZION, Y., (2008), Collective behavior of earthquakes and faults: Continuum-discrete transitions, progressive evolutionary changes, and different dynamic regimes. Rev Geophys 46: RG4006.i:10.1029/2008rg000260.
BYRNE, D.E., SYKES, L.R., and DAVIS, D.M., (1992), Great thrust earthquakes and aseismic slip along the palte boundary of the Makran subduction zone. J. Geophys. Res. 97, 449–478.
CHOULIARAS, G., DRAKATOS, G., PAVLOU, K., and MAKROPOULOS, K., (2013), Stress distribution and seismicity patterns of the 2011 seismic swarm in the Messinia basin, (South-Western Peloponnesus), Greece. Nat Haz Earth Sys Sci 13, 45–51.
COCHRAN, E. S., VIDALE, J.E., and TANAKA, S., (2004), Earth tides can trigger shallow thrust fault earthquakes, Science. 306, 1164–1166.
CRONE, T. J., TOLSTOY, M., and STROUP, D.F., (2011), Permeability structure of young ocean crust from poroelastically triggered microearthquakes.
Geophys. Res. Lett. 38, L05305,
doi:10.1029/2011GL046820.
DENG, J., and SYKES, L.R., (1996), Triggering of 1812 Santa Barbara earthquake by a great San Andreas shock: implications for future seismic hazards in southern California. Geophys Res Letts. 23. 1155– 1158.
DENG, J., and SYKES, L.R., (1997a), Evolution of the stress field in southern California and triggering of moderate-size earthquakes: a 200-year perspective. J Geophys Res. 102, 9859–9886.
DENG, J., and SYKES, L.R., (1997b), Stress evolution in southern California and triggering of moderate-, small-, and micro-size earthquakes. J Geophys Res. 102, 24,411–24,435.
DIMRI, V.P., VEDANTI, N., and CHATTOPADHYAY, S., (2005), Fractal analysis of aftershock sequence of the Bhuj earthquake: a wavelet-based approach. Current Science. 88 (10), 1617–1620.
DRAKATOS, G., (2000), Relative seismic quiescence before large aftershocks. Pur Appl Geophys. 157, 1407–1421.
DRAKATOS, G., and LTOUSSAKIS, J., (1996), Some features of aftershock patterns in Greece. Geophys J Int. 126, 123–134.
EL-ISA, Z.H., and EATON, W.D., (2013), Spatiotemporal variations in the b-value of earthquake magnitude– frequency distributions: Classification and causes. Tectonophysics. 615–616 (2014) 1–11.
ENGDAHL, E.R., JACKSON, J.A., MYERS, S.C., BERGMAN, E.A., and PRIESTLEY, K., (2006), Relocation and assessment of seismicity in the Iran region. Geophys. J. Int. 167, 761–778.
ESMAEILII, B., ZARE, M., ANSARI, A., ASHPOUR, SH., and SHAHVAR, M., (2013), The Mw 6.4 Shonbeh (Bushehr), Iran Earthquake, April 2013.
http://eeri.org/cohost/Special-Earthquake-Reports/M6.4_Iran_Earthquake/index.html FREED, A.M., (2005), Earthquake triggering by static,
dynamic, and postseismic stress transfer. Ann Rev Earth Plant Sci. 33, 335–367.
GAHALAUT, V.K., (2008), Coulomb stress change due to 2005 Kashmir earthquake and implications for future seismic hazards. J Seismol 12, 387–394.
GAHALAUT, K., and HASSOUP. A., (2012), Role of fluids in the earthquake occurrence around Aswan reservoir, Egypt. J. Geophys. Res. 117, B02303, doi:10.1029/2011JB008796.
GAHALAUT, V., KALPNA, K., and RAJU, P.S., (2003), Rupture mechanism of the 1993 Killari earthquake, India: constraint from aftershocks and static stress change. Tectonophysics. 369, 71–78.
GAHALAUT, V.K., ALPNA, SINGH, S.K., (2004), Fault interaction and earthquake triggering in the Koyna–Warna region, India. Geophys Res Letts. 31, L11614.
GOMBERG, J., P. A. REASENBERG, P. BODIN, and Harris, R.A., (2001), Earthquake triggering by seismic waves following the Landers and Hector Mine earthquakes. Nature. doi:10.1038/35078053.
Gomberg, J., P. BODIN, and REASENBERG. P.A., (2003), Observing Earthquakes Triggered in the Near Field by Dynamic Deformations. Bull o Seismol Soc Am. 93, 118–138.
GöRGüN, E., ZANG, A., BOHNHOFF, M., MILKEREIT, C., and DRESEN, G., (2009), Analysis of Izmit aftershocks 25 days before the November 12th 1999 Düzce earthquake, Turkey. Tectonophysics. 474, 507–515.
GRASSBERGER, P., and PROCACCIA, I., (1983), Measuring the strangeness of strange attractors. Physics. D 9, 189–208.
GUTENBERG, B., and RICHTER, C.F., (1942),
Earthquake magnitude, intensity, energy and acceleration. Bull Seismolo Soc Am. 32, 163– 191.
HARDEBECK, J. L., NAZARETH, J.J., and HAUKSSON, E., (1998), The static stress change triggering model: Constraints from two southern California aftershocks sequences. J Geophys Res. 103, 24,427–24,437.
HARRIS, R.A., (1998), Introduction to special section: stress triggers, stress shadows and implications for seismic hazard. J Geophys Res. 103 (10), 24347– 24358.
HARRIS, R.A., and SIMPSON, R.W., (1996), In the shadow of 1857-effect of the great Ft. Tejon earthquake on subsequent earthquakes in southern California. Geophys Res Letts. 23, 229–232.
HARRIS, R.A., SIMPSON, R.W., and REASENBERG, P.A., (1995), Influence of static stress changes on earthquake locations in southern California. Nature. 375, 221–224.
HIRATA, T., (1989), A correlation between the b-value and the fractal dimension of earthquakes. J. Geophys. Res. 94, 7507–7514.
IMOTO, M., (1991), Changes in the magnitude–frequency b-value prior to large (M 6.0) earthquakes in Japan. Tectonophysics. 193 (4), 311–325.
ISHIMOTO, M., and IIDA, K., (1939), Observations of earthquakes registered with the microseismograph constructed recently. Bull. Earthq. Res. Inst. 17, 443–478.
JACKSON, J., PRIESTLEY, K., ALLEN, M., and BERBERIAN, M., (2002), Active tectonics of the South Caspian Basin. Geophys. J. Int. 148 (2), 214–245.
JACOB, K.H., and QUITTMEYER, R.C., (1979), The Makran region of Pakistan and Iran: 431 trench-arc system with active plate subduction. In: Farah, A., De Jong, K.A. (Eds.). Geodynamics of
pakistan.Geol. Surv. Pakistan, Quetta, pp.
305±315.
JAMES, G.A., and WYND, J.G., (1965), Stratigraphic nomenclature of Iranian Oil Consortium Agreement area. Am. Assoc. Pet. Geol. Bull. 49 (12), 2182–2245.
JAUME, S.C., and SYKES, L.R., (1996), Evolution of moderate seismicity in the San Francisco Bay region, 1850 to 1993: seismicity changes related to the occurrence of large and great earthquakes. J Geophys Res. 101, 765–789.
JAUME, S., and SYKES, L., (1999), Evolving towards a critical point: a review of accelerating seismic moment/energy release prior to large and great earthquakes. Pure Appl. Geophys. 155 (2), 279– 306.
KARAKOSTAS, V.G., PAPADIMITRIOU, E.E.,
KARAKAISIS, G.F., PAPAZACHOS, C.B.,
SCORDILIS, E.M., VARGEMEZIS, G., and AIDONA, E., (2003), The 2001 Skyros, Northern Aegean, Greece, earthquake sequence: off-fault aftershocks, tectonic implications and seismicity triggering. Geophys Res Letts. 30 (1). http://dx.doi.org/10.1029/2002GL015814.
KARAKOSTAS, V.G., PAPADIMITRIOU, E.E., and PAPAZACHOS, C.B., (2004), Properties of the 2003 Lefkada Ionian Islands, Greece, earthquake seismic sequence and seismicity triggering. Bull Seismol Soc Am. 94, 1976–1981.
KING, G.C.P., STEIN, R.S., and LIN, J., (1994), Static stress changes and the triggering of earthquakes. Bull Seismolo Soc Am. 84, 935–953.
KING, G.C.P., and COCCO, M., (2001), Fault interaction by elastic stress changes: new clues from earthquake sequences. Adv Geophys. 44:1–38.
KISSLINGER, C., and JONES, L.M., (1991), Proprieties of aftershocks in Southern California. J. Geophys. Res. 103 (24), 453-24,465.
KHATTRI, K.N., (1995), Fractal description of seismicity of India and inferences regarding earthquake hazard. Current Science. 69, 361–366.
LEI, X., (2003), How do asperities fracture? An experimental study of unbroken asperities. Earth Plan Sci Letts. 213, 347–359.
LIU, Z.R., (1984), Earthquake frequency and prediction. Bull. Seismol Soc Am. 74, 255–265.
MAGGI, A., JACKSON, J.A., PRIESTLEY, K., and BAKER, C., (2000a), A re-assessment of focal depth distributionin southern Iran, the Tien Shan and northern India; do earthquakes really occur in the continental mantle?. Geophys. J. Int. 143, 629– 661.
MAGGI, A., JACKSON, J.A., MCKENZIE, D., and PRIESTLEY, K., (2000b), Earthquake focal depths, effective elastic thickness, and strength of the continental lithosphere. Geology. 28, 495–498.
MCCALL, G.J.H., (1997), The geotectonic history of the Makran and adjacent areas of southern Iran. J. Asian Sci. 15, 517–531.
MENDOZA, C., and HARTZELL, S.H., (1988), Aftershock patterns and main shock faulting. Bull. Seismol Soc Am. 78, 1438-1449,
MOGI, K., (1962), Study of elastic shocks caused by the fracture of heterogeneous materials and its relations to earthquake phenomena. Bull Earthq Res. 40 (1), 125–173.
MOGI, K., (1967), Earthquakes and fractures.
Tectonophysics .5 (1), 35–55.
MOLINARO, M., LETURMY, P., GUEZOU, J.C., de LAMOTTE, D.F., and ESHRAGHI, S.A., (2005), The structure and kinematics of the southeastern Zagros fold-thrust belt, Iran: from thin-skinned to thick-skinned tectonics. Tectonics. 24, TC3007, 19 pp.
MOUTHEREAU, F., LACOMBE, O., MEYER, B., (2006), The Zagros Folded Belt (Fars, Iran): constraints from topography and critical wedge modelling. Geophys J Int. 165, 336–356.
NALBANT, S.S., HUBERT, A., and KING, G.C.P., (1998), Stress coupling between earthquakes in northwest Turkey and the north Aegean Sea. J Geophys Res. 103, 24,469–24,486
NILFOROUSHAN, F., MASSON, F., VERNANT, P., VIGNY, C., MARTINOD, J., ABBASSI, M., NANKALI, H., HATZFELD, D., BAYER, R.,
TAVAKOLI, F., ASHTIANI, A.,
DOERFLINGER, E., DAIGNIERES,
M.,COLLARD, P., and CHERY, J., (2003), GPS network monitors the Arabia-Eurasi collision deformation in Iran. J Geod. 77, 411–422.
NUANNIN, P., (2006) The Potential of b-value Variations as Earthquake Precursors for Small and Large Events. Uppsala University (Ph.D. thesis).
NUR, A., and BOOKER, J. R., (1972), Aftershocks caused by pore fluid flow?. Science. 175, 885–887.
NYFFENGGER, P., and FROLICH, C., (1998),
Recommandations for determining p values for aftershock sequence and catalogs. Bull. Seismol. Soc. Am. 88 (5), 1144–1154.
NYFFENGGER, P., and FROLICH, C., (2000), Aftershock occurrence rate decay properties for intermediate and deep earthquake sequences. Geophys. Res. Lett. 27 (8), 1215– 1218.
OLSSEN, R., (1999), An estimation of the maximum b values in the Gutenberg–Richter relation. Geodynamics. 27, 547–552.
PAPAZACHOS, B.C., (1971), Aftershock activity and aftershock risk in the area of Greece. Annali di Geofisica. 24, 439–456.
PAPAZACHOS, B.C., (1975), Foreshocks and earthquake prediction. Tectonophysics. 28, 213–226.
PAPADIMITRIOU, E.E., (2002), Mode of strong earthquake recurrence in the central Ionian Islands (Greece): possible triggering due to Coulomb stress changes generated by the occurrence of previous strong shocks. Bull Seismolo Soc Am. 92, 3293–3308.
PAPADIMITRIOU, E.E., and SYKES, L.R., (2001), Evolution of stress field in the Northern Aegean Sea (Greece). Geophys J Int. 146, 747–759.
PARSONS, T., STEIN, R. S., SIMPSON, R. W., and REASENBERG, P., (1999), Stress sensitivity of fault seismicity: A comparison between limited-offset oblique and major strike-slip faults. J. Geophys. Res. 104, 20,183–20,202.
RAJPUT, S., GAHALAUT, V.K., and SAHU, V.K., (2005), Coulomb stress changes and aftershocks of recent Indian earthquakes. Current Science 88 (6), 576–588.
RANALLII, G., (1969), A statistical study of aftershock sequences. Annali di Geofisica. 22, 359–397.
RYBICKI, K., (1973), Analysiso f aftershockso n the basiso f dislocationt heory, Phys. Earth Planet. Inter. 7, 409-422,
SARKARINEJAD, KH., Mehdi Zadeh, R., and Webster, R., (2012), Two-dimensional spatial analysis of the seismic b-value and the Bouguer gravity anomaly in the southeastern part of the Zagros Fold-and-Thrust Belt, Iran: Tectonic implications. J Asian Earth Sci. 62 (2013) 308–316.
SHCHERBAKOV, R., and TURCOTTE, D.L., (2004), A modified form of Bath’s law. Bull. Seismol. Soc. Am. 94, 1968–1975.
SCHOLZ, C., (1968), Microfracturing and the inelastic deformation of rock in compression. J. Geophys. Res. 73 (4), 1417–1432.
SCHORLEMME, D., and WIEMER, S., (2005),
Microseismicity data forecast rupture area. Nature. 434, 1086.
SMITH, W., (1981), The b-value as an earthquake precursor. Nature 289, 136–139.
STEACY, S., GOMBERG, J., and COCCO, M., (2005), Introduction to special section: stress transfer, earthquake triggering and time-dependent seismic hazard. J Geophys Res. 110:B05S01, doi: 10.1029/ 2005JB003692.
STEIN, R.S., (1999), The role of stress transfer in earthquake occurrence. Nature. 402, 605–609.
STEIN, R.S., (2003), Earthquake conversations. Scientific American. 288, 72–79.
STEIN, R.S., (2004), Tidal triggering caught in the act. Science. 305, 1248–1249.
STEIN, R.S., and WYSESSION, M., (2003), An Introduction to Seismology, Earthquakes and Earth Structure, Blackwell Publishing, Oxford. 498 pp., ISBN 0-86542- 078-5, £39.99.
STEIN, R.S., KING, G.C.P., and Lin, J., (1994), Stress triggering of the 1994 M=6.7 Northridge, California, earthquake by its predecessors. Science. 265 (5177), 1432–1435.
STROUP, D. F., BOHNENSTIEHL, D.R.,TOLSTOY, M., WALDHAUSER, F., and WEEKLY, R., (2007), Pulse of the seafloor: Tidal triggering of microearthquakes at 9°50’N East Pacific Rise.
Geophys Res Letts. 34, L15301,
doi:10.1029/2007GL030088.
STOCKLIN, J., (1968), Salt deposits of the Middle East. Geol. Soc. Am. Spec. Pap. 88, 157–181.
STROUP, D. F., M. TOLSTOY, T. J., CRONE, A.
MALINVERNO, and WALDHAUSER, F.,
(2009), Systematic along-axis tidal triggering of microearthquakes observed at 9°50’N East Pacific Rise. Geophys. Res. Lett. 36, L18302, doi:10.1029/2009GL039493.
TALEBIAN, M., and JACKSON, J.J., (2004), A reappraisal of earthquake focal mechanisms and active shortening in the Zagros mountains of Iran. Geophys J Int. 156 (3), 506–526.
TATAR, M., HATZFELD, D., MARTINOD, J.,
WALPERSDORF, A., GHAFORI-ASHTIANI, A., and CHERY, J., (2002), The present-day deformation of central Zagros from GPS
measurements. Geophys Res Letts. 29 (19), 1927– 1930. http://dx.doi.org/10.1029/2002 GLO15427. TATAR M., HATZFELD, D., and GHAFORI-ASHTIANI,
M., (2004), Tectonics of the Central Zagros (Iran)
deduced from microearthquake seismicity.
Geophys. J. Int. 156, 255–266.
TELESCA, L., CUOMO, V., LAPENNA, V.,
VALLIANATOS, F. and DRAKATOS, G., (2001), Analysis of the temporal properties of Greek aftershock sequences. Tectonophysics. 341, 163–178.
TODA, S., and STEIN, R.S., (2002), Response of the San Andreas fault to the 1983 Coalinga-Nu-ez Earthquakes: an application of interaction-based probabilities for Parkfield. J Geophys Res. 107. http://dx.doi.org/10.1029/2001JB000172.
TODA, S., STEIN, R.S., and SAGIYA, T.,( 2002), Evidence from the 2000 Izu Islands swarm that seismicity is governed by stressing rate. Nature. 419, 58–61.
TODA. S., STEIN R.S., SEVILGEN V., and LIN. J., (2011), Coulomb 3.3 graphic rich deformation and stress-change software for earthquake, tectonic, and volcano research and teaching-user guide. U.S. Geological Survey Open-File Report. 2011-1060.
TURCOTTE, D., (1997), Fractals and Chaos in Geology and Geophysics. Cambridge University Press, New York. 416 pp.
UTSU, T., (1961), Aftershocks and earthquake statistics. J Fac Sci, Hokkaido University, Japan 7, 130–195. UTSU, T., (1971), Aftershocks and earthquake statistics
(2): further investigation of aftershocks and other earthquake sequences based on a new classification of earthquake sequences. Journal of the Faculty of Science, Hokkaido University. Series 7, Geophysics. 3 (4), 197–266.
UTSU, T., (2002), A statistical study of occurrence of aftershocks. Geophys Mag. 30, 521–605.
UTSU, T., OGATA, Y., and .MATSÖRA. R.S., (1995), The centenary of the Omori formula for a decay law of aftershock activity. J Phys Earth. 43, 1–33.
VERNANT, P., NILFOROUSHAN, F., HATZFELD, D., ABBASSI, M., VIGNY, C., MASSON, F.,
NANKALI, H., MARTINOD, J., ASHTIANI, M., BAYER, R., TAVAKOLI, F., and CHERY, J., (2004), Present-day crustal deformation and plate kinematics in the Middle East constrained by GPS measurements in Iran and northern Oman. Geophys J Int. 157, 381–398. http://dx.doi.org/10.1111/j.1365-246X.2004. 02222.x.
WELLS, D. L., and COPPERSMITH, K. J. (1994), New empirical relationships among magnitude, rupture length, rupture width, rupture area, and surface displacement. Bull. Seismol. Soc. Am., 84(4), 974–1002.
WIEMER, S. (2001), A software package to analyze seismicity: ZMAP. Seismol Res Lett. 72, 373–382.
WIEMER, S., and KATSUMATA, K., (1999), Spatial variability of seismicity parameters in aftershock zones. J Geophys Res. 104 (B6), 13, 135–151.
WIEMER, S., and WYSS, M., (2002), Spatial and temporal variability of the b-value inn seismogenic volumes: an overview. Adv Geophys. 45, 259–302.
WIEMER, S., MCNUTT, S., and WYSS, M., (1998), Temporal and three-dimensional spatial analyses of the frequency–magnitude distribution near Long Valley Caldera, California. J Geophys Res. 134 (2), 409–421.
WYSS, M.., (1973), Towards a physical understanding of earthquake frequency distribution. Geophys J Royal Astro Soc. 31, 341– 359.
XIONG, X., SHAN, B., ZHENG, Y., and WANG, R.J., (2010), Stress transfer and its implication for earthquake hazard on the Kunlun Fault, Tibet. Tectonophysics. 482, 216–225.
YADAV, R.B.S., (2009), Seismotectonic Modeling of NW Himalaya: A Perspective on Future Seismic Hazard. Ph.D. Thesis, Department of Earthquake Engineering, IIT Roorkee, India, p. 76.
YADAV, R.B.S., SHANKER, D., CHOPRA, S., and SINGH, A.P., (2010), An application of regional time and magnitude predictable model for long-term earthquake prediction in the vicinity of October 8, 2005 Kashmir Himalaya earthquake. Nat Haz. 54, 985–1014.
YADAV, R.B.S., PAPADIMITRIOU, E.E.,
KARAKOSTAS, V.G., SHANKER, D.,
RASTOGI, B.K., CHOPRA, S., SINGH, A.P., and SANTOSH, K., (2011), The 2007 Talala, Saurashtra, western India earthquake sequence: tectonic implications and seismicity triggering. J Asian Earth Sci. 40 (1), 303–314.
YADAV, R.B.S., GAHALAUT, V.K., CHOPRA, S., and SHAN, B., (2012), Tectonic implications and seismicity triggering during the 2008 Baluchistan, Pakistan earthquake sequence. J Asian Earth Sci. 45 (2), 167–178.
ZAMANI. A., and AGH-ATABAI, M., (2009), Temporal characteristics of seismicity in the Alborz and Zagros regions of Iran, using a multifractal approach. J Geodynamics. 47:271–279.
ZHAO, Y.Z., and WU, Z.L., (2008), Mapping the b-values along the Longmenshan fault zone before and after the 12 May 2008, Wenchuan, China, Ms 8.0 earthquake. Nat Haz Earth Sys Sci. 8, 1375–1385
ZIV, A., and RUBIN, A.M., (2000), Static stress transfer and earthquake triggering: no lower threshold in sight?. J Geophys Res. 105, 13631–13642.
ZOBACK, M. D., and HARJES, H.P., (1997), Injection-induced earthquakes and crustal stress at 9 km depth at the KTB deep drilling site, Germany. J Geophys Res. 102(B8), 18,477–18,491.