Feature Article
How the Ocean Personality Model
Affects the Perception of Crowds
Funda Durupınar ■ Bilkent UniversityNuria Pelechano ■ Universitat Politècnica de Catalunya Jan M. Allbeck ■ George Mason University
U˘gur Güdükbay ■ Bilkent University
Norman I. Badler ■ University of Pennsylvania
S
imulating the behavior of animated vir-tual crowds is a challenge for the computer graphics community. To achieve realistic be-havior in virtual crowds requires extensive study of the semantics underlying real crowds’ motion. Psychologists study human na-ture to identify salient behavior characteristics. There has been extensive research on incorpo-rating psychological models into the simulation of autonomous agents. Here, however, we’re not interested in a person’s person-ality, per se, but in incorporating a personality model into large groups of people. By changing the parameters, we examine how subgroups of people with differ-ent personality traits interact and, accordingly, how global crowd behavior is influenced. The user decides the percentage and distri-bution of the personality traits.Personality is a pattern of a person’s behavioral, temperamental, emotional, and mental traits. Considerable controversy exists in personality research about how many personal-ity traits there are. However, one popular model is the Five Factor, or Ocean (openness, conscien-tiousness, extroversion, agreeableness, and
neu-roticism) model.1 These five factors are orthogonal
dimensions of the personality space. Openness de-scribes the imaginative and creative aspect of hu-man character. Conscientiousness determines to what level a person is organized and careful. Ex-troversion relates to how outgoing and sociable a person is. Agreeableness is friendliness, generosity, and the tendency to get along with other people. Finally, neuroticism refers to emotional instability and the tendency to experience negative emotions. Each factor is bipolar and has several traits, which essentially are adjectives used to describe people.2
We’ve mapped these trait terms to the set of be-haviors in the HiDAC (High-Density Autonomous Crowds) crowd simulation system.3 HiDAC models
individual differences by assigning each person dif-ferent psychological and physiological traits. Users normally set these parameters to model a crowd’s nonuniformity and diversity. Our approach frees users of the tedious task of low-level parameter tuning and combines all these behaviors in dis-tinct personality factors. To verify our mapping’s plausibility, we evaluated users’ perception of the personality traits in generated animations.
The System
By combining a standard personality model with a high-density crowd simulation, our approach cre-ates plausible variations in the crowd and enables novice users to dictate these variations.4
This approach extends the HiDAC (High-Density Autonomous Crowds) system by providing each agent with a personality model based on the Ocean (openness, conscientiousness, extroversion, agreeableness, and neuroticism) personality model. Each personality trait has an associated nominal behavior. Specifying an agent’s personality leads to an automation of low-level parameter tuning.
HiDAC
HiDAC addresses the simulation of local behaviors and the global wayfinding of crowds in a dynami-cally changing environment. It directs autonomous agents’ behavior by combining geometric and psy-chological rules. Psypsy-chological attributes include impatience, panic, and leadership behaviors, which are determined by traits such as locomotion, en-ergy levels, and maximum speed. Agents have skills such as navigation in complex environments, com-munication, learning, and certain kinds of decision making. Agents also have perception so that they can react to obstacles, other agents, and dynamic changes in the environment.
To achieve realistic behavior, HiDAC handles collisions through avoidance and response forces. Over long distances, the system applies collision avoidance so that agents can steer around ob-stacles. Over shorter distances, it applies collision response to prevent agents from overlapping with each other and the environment.
Besides the usual crowd behavior, agents might display pushing behavior or show that they can wait for other agents to pass first, depending on their po-liteness and patience. Pushing behavior arises from varying each agent’s personal-space threshold. Im-patient agents don’t respect others’ personal space and appear to push their way through the crowd. Relaxed agents temporarily stop when another agent moves into their path; impatient agents don’t respond to this feedback and tend to push.
Integrating the Ocean Model into HiDAC
A crowd consists of subgroups with different per-sonalities. Variations in the subgroups’ character-istics influence emergent crowd behavior. The user can add any number of groups with shared
per-sonality traits and can edit these characteristics throughout an animation.
To model an agent’s personality p, we use a five-dimensional vector, in which a personality factor Ψi represents each dimension. To model the
fac-tors’ distribution in a group of people, we use a Gaussian distribution function N with mean μi
and standard deviation σi: p = <ΨO, ΨC, ΨE, ΨA, ΨN>,
Ψi=N
(
µ σi, i2)
, for i ∈ {O, C, E, A, N},where μ ∈ [0, 1], σ ∈ [–0.1, 0.1].
A person’s overall behavior b is a combination of different behaviors. Each behavior is a function of personality:
b = (b1, b2, …, bn)
bj = f(p), for j = 1, …, n.
Because each factor is bipolar, Ψ can have posi-tive and negaposi-tive values. For instance, a value of 1 for extroversion means that the person is highly extroverted, whereas –1 means that the person is highly introverted.
Personality-to-Behavior Mapping
We map agents’ personality factors (adjectives) onto low-level parameters and onto the built-in behaviors built-in the HiDAC model (see Table 1). A positive factor takes values in the range [0.5, 1]; a negative factor takes values in the range [0, 0.5). A factor with no sign indicates that both poles apply to that behavior. For instance, E+ for
Leadership Assertive, social, unsocial, calm, fearful E, N Trained or untrained Informed, ignorant O Communication Social, unsocial E Panic Oversensitive, fearful, calm, orderly, predictable N, C+ Impatience Rude, assertive, patient, stubborn, tolerant, orderly E+, C, A Pushing Rude, kind, harsh, assertive, shy A, E Right preference Cooperative, predictable, negative, contrary, changeable A, C Avoidance or personal space Social, distant E Waiting radius Tolerant, patient, negative A Waiting timer Kind, patient, negative A Exploring environment Curious, narrow O Walking speed Energetic, lethargic, vigorless E Gesturing Social, unsocial, shy, energetic, lethargic E
Feature Article
a behavior means that only extroversion is related to that behavior; introversion isn’t applicable. As Table 1 shows, more than one personality dimen-sion can define a behavior. The more adjectives of a certain factor that are defined for a behavior, the stronger that factor’s impact on that behavior. We assign a weight to the factor’s impact on a specific behavior. For instance, ωEL is the weight of
extro-version on leadership; it takes a value in the range [0, 1]. The sum of the weights for a specific type of behavior is 1.
Now, we show how our approach maps a per-sonality dimension to a specific type of behavior. We define the behavior parameters for an agent i as follows.
Leadership. Leaders tend to have more confidence in themselves. They remain calm during emergen-cies. Each agent has a leadership percentage deter-mined by extroversion and stability. We compute leadership behavior as
βiLeadership=ωELΨiE+ωNL
(
1−ΨNi)
,where
biLeadership∝ , bE iLeadership∝−1N, and biLeadership∈
[ ]
0 1, .Trained. Trained agents have complete knowledge about the environment. Because being trained re-quires curiosity and because trained people are in-formed, we associate this parameter with openness. Being trained is a Boolean parameter, so we use a probability function to represent it. As openness increases, the probability that the agent is trained increases: P P i i i i Trained if Trained O Trained
(
)
= =(
)
≥ Ψ b 1 0 5 0 . otherwise , wherePi (Trained) ∝ O and biTrained ∈ {0, 1}.
Communication. This parameter determines whether agents communicate. Similar to being trained, com-munication depends on the probability of agent behavior. As extroversion increases, the probability that the agent communicates increases:
P P i i i i Communication if Com E Communication
(
)
= = Ψ b 1 mmunication otherwise(
)
≥ 0 5 0 . , wherePi(Communication)∝ E and biCommunication∈
{ }
0 1, .Panic. In emergency situations, agents display panic behavior depending on their stability and conscientiousness. When they panic, their walk-ing speed increases and they don’t wait. We com-pute panic as βi ω i ω i i i i f f Panic NP N CP C C C if C = +
( )
( )
= − + ≥ Ψ Ψ Ψ 2Ψ 2 Ψ 0 00 otherwise , wherebiPanic∝ , bN iPanic∝−1C+, and biPanic∈
[ ]
0 1, .Impatience. We implement this parameter by modi-fying the route selection dynamically on the basis of environmental changes. This parameter de-pends on an agent’s politeness and assertiveness. We compute impatience as βi ω i ω i ω i i f f Impatience EI E AI A CI C =
( )
Ψ +(
−Ψ)
+(
−Ψ)
Ψ 1 1 EE E if E otherwise( )
= − ≥ 2 1 0 0 Ψi Ψi , wherebiImpatience∝E+, biImpatience∝−1A,C, and biImpatience∈
[ ]
0 1, biImpatience∈[ ]
0 1, .Pushing. HiDAC can realistically simulate a per-son’s respect for others. Agents can try to force their way through a crowd by pushing others, exhibit more respectful behavior when desired, make decisions about letting others walk first, and queue when necessary. Disagreeable agents tend to push others more because they’re harsh and im-polite. Similarly, extroverted agents display push-ing behavior because they tend to be assertive. We compute pushing as P P i i i i i Pushing if P EP E AP A Pushing
(
)
= +(
−)
= ω ω β Ψ 1 Ψ 1 uushing otherwise(
)
≥ 0 5 0 . , wherePi(Pushing) ∝ E, Pi(Pushing) ∝—1 A, and biPushing∈
{ }
0 1, .of conformity to the rules. The right-preference behavior is a probability function. If an agent is disagreeable or nonconscientious, that agent can make a right or left preference with equal proba-bility. On the other hand, an agent that prefers the right side increases the probability proportionally to the agent’s agreeableness and conscientiousness values, if these values are positive. We compute right preference as P i i i i Right if or othe A C AR A CR C
(
)
= < < + 0 5. Ψ 0 Ψ 0 Ψ Ψ ω ω rrwise if Right otherw Right =(
)
≥ βi 1 Pi 0 5 0 . iise , wherePi(Right) ∝ A, C, and biRight∈
{ }
0 1, .Personal space. Personal space determines the ter-ritory in which a person feels comfortable. Agents try to preserve their personal space when they approach other agents and when other agents approach from behind. However, the values for these two situations aren’t the same. According to research, the average personal space in West-ern cultures is 0.7 meters in front and 0.4 meters behind.5 The personal space of an agent i with
re-spect to an agent j is bi j i f i j , . , PersonalSpace E if = ∗
( )
∈ 0 8 01 3 Ψ ∗( )
∈ ∗( )
0 7 1 3 2 3 0 5 . , . , f i j f i j i if i E Ψ ffΨE i f i j ∈ ( )
2 31 , == 1 0 4 0 7 if is behindi j . / . otherwise ,, wherebi j,PersonalSpace∝−1E and bi j,PersonalSpace∈
{
0 5 0 7 0 8 .. , . , .}
Waiting radius. In an organized situation, people tend to wait for available space before moving. We call this space the waiting radius; it depends on a person’s kindness and consideration—that is, the agreeableness dimension. We compute the waiting radius as , biWaitingRadius = 0 45. iif if A A Ψ Ψ i i ∈ ∈ 1 3 2 3 0 65 2 31 . where
biWaitingRadius∝ and bA iWaitingRadius∈
{
0 25 0 45 0 65. , . , .}
.Waiting timer. If two people are heading in the same direction, each waits for the other to move first. The time they wait—that is, the duration during which they display patience toward each other—depends on their agreeableness. We compute the waiting time as
, bi i i WaitingTimer A A if if = ∈ ∈ 1 01 3 5 Ψ Ψ 11 3 2 3 50 2 31 ∈ ifΨA i where
biWaitingTimer ∝ and bA iWaitingTimer∈
{
1 5 50, ,}
.Exploring the environment. HiDAC assigns people specific behaviors. The number of actions they complete depends on their curiosity. Open people will more likely explore different experiences and perform more actions. The openness factor deter-mines the time during which a person explores the environment. The number of actions that a person completes increases by the degree of openness. We compute the exploring parameter as
biExploring=10Ψ ,iO
where
biExploring∝ and bO iExploring∈
[
0 10,]
.Walking speed. A person’s energy level determines that person’s maximum walking speed. Because extroverts tend to be more energetic and introverts more lethargic, the extroversion trait controls this parameter. We compute the walking speed as
biWalkingSpeed =ΨEi+1 ,
where
Feature Article
Gesturing. The amount of gesturing during a con-versation indicates a person’s sociability. Outgoing people use more gestures than shy people, which indicates extroversion. We compute the gesturing parameter as
biGesturing=10Ψ ,iE
where
biGesturing∝ and bE iGesturing∈
[
0 10,]
.Evaluation
To evaluate whether users will correctly perceive our suggested mappings, we conducted user studies. We created several animations to study how mod-ifying subgroups’ personality parameters affects global crowd behavior.
The Experiment’s Design
We created 15 videos presenting the emergent be-haviors of people in scenarios in which the
set-tings assigned in the Ocean model drive crowds’ behavior. The scenarios ranged from evacuation drills to cocktail parties or museum galleries.
We performed the mapping from HiDAC param-eters to Ocean factors by using trait-descriptive adjectives. To validate our system, we determined the correspondence between our mapping and the users’ perception of these trait terms in the vid-eos. Our studies involved 70 participants (21 fe-males and 49 fe-males, ages 18 to 30). We showed the videos to them on a projected display and asked them to complete a questionnaire containing 123 questions—about eight questions per video. After each video, participants had time to answer the related questions. The participants had no previ-ous knowledge of the experiment.
Questions assessed how much a person agreed with statements such as, “I think the people in this video are kind” or “I think the people with green suits are calm.” We asked questions that in-cluded the adjectives describing each Ocean fac-tor instead of asking directly about the facfac-tors. We used descriptive questions because the general public, being unfamiliar with the Ocean model, might have difficulty answering questions such as, “Do the people exhibit openness?” Although the participants were proficient in English, to pre-vent any misconceptions, we attached dictionary definitions of the adjectives to the questionnaires. Participants chose answers on a scale from 0 to 10, where 0 = totally disagree, 5 = neither agree nor disagree, and 10 = totally agree. We omitted the antonyms from the list of adjectives, for con-ciseness. The remaining adjectives were assertive,
calm, changeable, contrary, cooperative, curious, dis-tant, energetic, harsh, ignorant, kind, orderly, patient, predictable, rude, shy, social, stubborn, and tolerant.
Sample Scenarios
In the scenarios, novel, emergent formations and different behavior timings occurred.
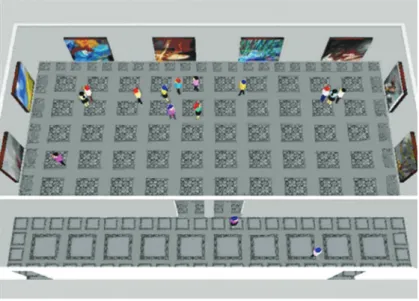
The museum scenario tested the impact of openness. A key factor determining openness is the belief in the importance of art. Figure 1 shows a screenshot from the sample animation. This sce-nario tested the adjectives curiosity and ignorance. There were three groups of people, with openness values of 0, 0.5, and 1. We mapped the number of tasks that each agent must perform to openness, with each task requiring looking at a painting. The least open agents (with blue hair) left the museum first, followed by the agents with openness values of 0.5 (with black hair). The most open agents (with red hair) stayed the longest. We asked the participants how they perceived each group. Figure 1. Openness tested in a museum. The most open people (red hair)
stayed the longest. The least open people (blue hair) left the earliest.
Figure 2. A ring formation example. Extroverts (blue suits) are inside and introverts are outside.
tion. Figure 2 shows a screenshot in which the agents in blue suits are extroverted (μ = 0.9 and
σ = 0.1) and those in grey suits are introverted
(μ = 0.1 and σ = 0.1). The ratio of introverts to extroverts in a society is 25 percent;6 we
as-signed the initial number of agents according to this ratio. At the animation’s end, introverts were outside the ring structure around the object of attraction. Because extroverts are faster, they approached the attraction point in less time. In addition, when other agents blocked their way, they tended to push them to reach their goal. The figure also shows the difference between the personal spaces of introverts and extroverts. This animation tested the adjectives social, distant,
as-sertive, energetic, and shy.
To test whether the participants could distinguish the personalities of people who create congestion, we showed them two videos of the same duration and asked them to compare the characteristics of the agents in each video. Each video consisted of two groups of people moving through each other. The first video showed people with high agreeable-ness and conscientiousagreeable-ness values (μ = 0.9 and
σ = 0.1 for both traits). The second video showed
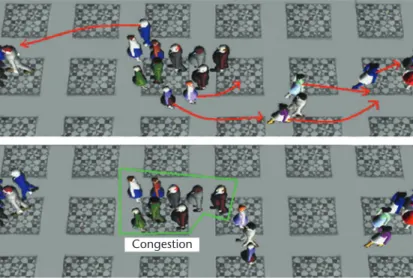
people with low agreeableness and conscientious-ness values (μ = 0.1 and σ = 0.1 for both traits). In the first video, groups managed to cross each other, whereas in the second, congestion occurred after a fixed time period. Such behaviors emerged because people who are agreeable and conscien-tious are more patient; they don’t push each other and are always predictable, because they prefer to move on the right side. Figure 3 shows how con-gestion occurred because of low conscientiousness and agreeableness. People were stuck at the center and refused to let other people move. They also were stubborn, negative, and uncooperative.
Figure 4 shows a screenshot from the anima-tion demonstrating how neuroticism, nonconsci-entiousness, and disagreeableness affect panic. We simulated 13 agents. Five of them had neuroticism values of μ = 0.9 and σ = 0.1, conscientiousness val-ues of μ = 0.1 and σ = 0.1, and agreeableness valval-ues of μ = 0.1 and σ = 0.1. The other agents, which were psychologically stable, had neuroticism val-ues of μ = 0.1 and σ = 0.1, conscientiousness valval-ues of μ = 0.9 and σ = 0.1, and agreeableness values of
μ = 0.9 and σ = 0.1. The agents in green suits are
neurotic, less conscientious, and disagreeable. As the figure shows, they tend to panic more, push other agents, force their way through the crowd,
and rush to the door. They aren’t predictable, co-operative, patient, or calm; they’re rude, change-able, negative, and stubborn.
Analysis
After collecting the participants’ answers for all the videos, we organized the data for the adjec-tives. We classified each adjective by its question number, the simulation parameter, and the par-ticipants’ answers to the corresponding question. We calculated the Pearson correlation (r) between the simulation parameters and the average of the subjects’ answers for each question. For instance,
Congestion
Figure 3. People with low conscientiousness and agreeableness cause congestion.
Figure 4. Neurotic, nonconscientious, and disagreeable agents (in green suits) display panic behavior.
Feature Article
eight questions included the adjective assertive, indicating a sample size of 8. We calculated the correlation coefficient between the parameters and the means of the participants’ answers be-tween these 16 values, eight for each group.
We grouped the relevant adjectives for each Ocean factor to assess the perception of person-ality traits. This evaluation was similar to the evaluation of adjectives, this time considering the questions for all the adjectives that corresponded to an Ocean factor. For instance, because open-ness is related to curiosity and ignorance, we took into account the answers for curious and ignorant. Again, we averaged the subjects’ answers for each question. Then, we computed the correlation with the parameters and the mean throughout all the questions involving curious and ignorant.
To estimate the probability of having obtained the correlation coefficients by chance, we computed the correlation coefficients’ significance. The signif-icance is 1 – p, where p is the two-tailed probability, taking into account the sample size and the cor-relation value. Higher corcor-relation and significance values suggest more accurate user perception.
Results and Discussion
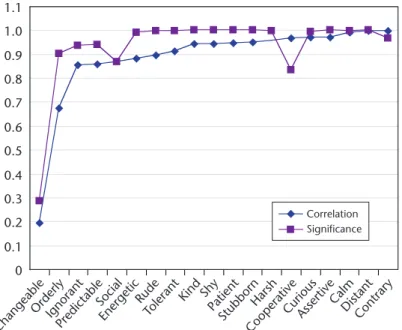
Figure 5 shows the correlation coefficients and significance values for the adjectives; Table 2 shows the exact results. As the table shows, the significance is low (<0.95) for changeable, orderly,
ignorant, predictable, social, and cooperative. For changeable and orderly, this is because of low
cor-relation values. For predictable, ignorant, social, and
cooperative, the correlation coefficients are high,
but their significance is low because of the small sample size.
From the participants’ comments, we deter-mined that changeable is especially confusing. To understand why, consider the setting in which two groups of agents crossed each other. The par-ticipants identified the nonconscientious agents as rude but perceived them as persistent in their rudeness. This perception caused the partici-pants to mark lower values for the question about changeability. The same problem held for predict-able agents. One participant’s comments suggested that if a person is in a rush, that person can be predicted to push others. However, a predictable agent has a higher correlation despite these com-ments, even though predictable implies the oppo-site of changeable. This meaning might be because of the relatively low significance for predictable. Participants perceived nonconscientious agents that cause congestion as less predictable, which indicates that changing right-preference and rude behavior decreases the perceived predictability.
Orderly is another weakly correlated adjective.
Analyzing the results for each video, we found that agents in the evacuation drill scenario were orderly although they displayed panic behavior.
0 0.1 0.2 0.3 0.4 0.5 0.6 0.7 0.8 0.9 1.0 1.1 Changeable OrderlyIgnorant Predictable Social Energetic Rude Toleran t Kind Shy Patient StubbornHarsh Cooperative
CuriousAssertiveCalmDistantContrar y Correlation Significance
Figure 5. The correlation coefficients between the parameters and the subjects’ answers for the descriptive adjectives (blue), and the significance values for the corresponding correlation coefficients (violet). Significance is low (<0.95) for changeable, orderly, ignorant, predictable, social, and cooperative.
Table 2. Correlation coefficients and significance values for the 12 adjectives.
Adjective Correlation Significance
Changeable 0.199 0.288 Orderly 0.674 0.903 Ignorant 0.853 0.936 Predictable 0.870 0.938 Social 0.872 0.869 Energetic 0.882 0.992 Rude 0.897 0.997 Tolerant 0.912 0.998 Kind 0.943 1.000 Shy 0.945 1.000 Patient 0.948 1.000 Stubborn 0.950 1.000 Harsh 0.956 0.997 Cooperative 0.967 0.834 Curious 0.971 0.994 Assertive 0.971 1.000 Calm 0.988 0.999 Distant 0.998 1.000 Contrary 0.999 0.969
In these videos, even if the agents pushed each other and moved fast, some kind of order could be observed. This order was because of the crowd’s smooth flow during evacuation. The crowd dis-played collective synchrony, in which individual-ity was lost. Although people were impatient and rude, the overall crowd behavior appeared orderly.
We assigned the same goal to the entire crowd in the evacuation simulations because we aimed to observe disorganization locally. For instance, dis-orderly agents looked rushed; they pushed other agents and they didn’t have solid preferences for selecting a direction when crossing another agent. However, they moved toward the same goal, which was to exit the building. The crowd would have ap-peared more disorderly if everyone ran in different directions and changed direction for no apparent reason.
Participants’ answers suggest that they didn’t recognize orderliness when the goal was the same for the whole crowd. On the other hand, in a sce-nario showing queuing behavior in front of a water dispenser, the participants could easily distinguish orderly versus disorderly people. Orderly agents waited at the end of the queue; disorderly agents rushed to the front. In this scenario, although the main goal was the same for all the agents (drink water), there were two distinguishable groups that acted differently.
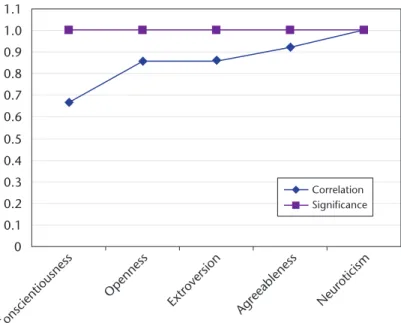
Figure 6 and Table 3 show the correlation coeffi-cients and their significance for the Ocean param-eters. We computed these values by taking into account all the relevant adjectives for each Ocean factor. As the figure and table show, all the coef-ficients have high significance, with a probability of less than 0.5 percent of occurring by chance (p < 0.005). The significance is high because we took into account all the adjectives describing a personality factor, thereby achieving a sufficiently large sample.
The correlation coefficient for conscientiousness is comparatively low, showing that the participants correctly perceived only approximately 44 percent of the traits (r2 ≈ 0.44). To understand why,
con-sider the relevant adjectives: orderly, predictable,
rude, and changeable. Low correlation values for or-derly and changeable reduce the overall correlation.
If we consider only rude and predictable, the cor-relation increases by 18.6 percent. The results sug-gest that people can observe the politeness aspect in short-term crowd behavior settings more easily than the organizational aspects. This observation also explains why the perception of agreeableness correlates highly with the actual parameters.
Figure 6 and Table 3 also show that the
partici-pants perceived neuroticism the best. In this study, we’ve considered only neuroticism’s calmness as-pect, which is tested in emergency settings and building evacuation scenarios.
O
ur results are promising; they indicate a high correlation between our parameters and the participants’ perception of them. The low correlation for some adjectives is due to the terms’ ambiguity.Unlike the low-level parameter tuning process in previous research (see the sidebar), we let our users select from higher-level concepts related to human psychology. Our approach frees users from understanding the underlying methodologies used in HiDAC. Our mapping also decreases the number of parameters to set, from 13 to 5. Us-ing a personality model let us move the user’s fo-cus to the agents’ character instead of behavioral parameters, while providing us with a somewhat widely accepted structure for describing character. Certainly, you could create an interface that lets
0 0.1 0.2 0.3 0.4 0.5 0.6 0.7 0.8 0.9 Conscientiousness Openness
Extroversion Agreeableness Neuroticism
Correlation Significance
Figure 6. The correlation coefficients between actual parameters and subjects’ answers for the Ocean factors (blue), and the two-tailed probability values for the corresponding correlation coefficients (violet). All the coefficients have high significance.
Table 3. The correlation coefficients and the significance values for the Ocean factors.
Factor Correlation Significance
Conscientiousness 0.665 1.000 Openness 0.859 0.999 Extroversion 0.860 1.000 Agreeableness 0.922 1.000 Neuroticism 0.990 0.999
Feature Article
users create subgroups based on a set of adjectives instead of personality traits, but it would increase the number of parameters to set. Also, psychology and research on autonomous agents has linked personality models to other psychological, socio-logical, and cognitive models. Integrating a per-sonality model into a crowd simulator will let us expand our simulator and explore how these other models affect crowd simulations.
We certainly could have used other psycho-logical models. Autonomous-agent research has investigated emotion models. Future research might include adding emotion to the agents, but whereas personality is a behavior pattern (ex-tended through time), emotions change accord-ing to the agent state and the situation. Emotions must evolve through the simulation and not be set by the animator. Certainly, personality
af-fects emotional tendency and provides a founda-tion. Because personality is a behavior pattern, it might help a character’s observers develop a sense of knowing that character. Thus, characters might become individuals instead of just another collec-tion of anonymous computer characters.
Acknowledgments
The research described in this article was initiated while Funda Durupınar was visiting the University of Pennsylvania’s Center for Human Modeling and Simulation. The Scientific and Technological Research Council of Turkey supported this research under Inter-national PhD Research Fellowship Programme 2214 and projects EEE-AG 104E029 and 105E065. The Spanish Government partially funded this research under grant TIN2010-20590-C01-01.
C
rowd simulation research has evolved from creating reactive techniques to implementing crowds consist-ing of more complex agents. Reactive methods are limited; they don’t present any knowledge representation, learning ability, reasoning, or individual differences in the agents. For instance, flocking systems are rule-based and specify an ani-mation as a distributed global motion with a local tendency.1On the other hand, systems with cognitive control involve reasoning and planning to accomplish long-term tasks, and they concentrate on achieving full autonomy. A notable step toward creating more intelligent agents was Xiaoyuan Tu and Demetri Terzopoulos’s artificial-life simu-lation, which equipped artificial fishes with synthetic vision and perception of the environment, as well as behavior and learning centers.2 Soraia Musse and Daniel Thalmann
proposed a crowd behavior model that implemented group interrelationships and introduced a multiresolution col-lision method specific to crowd modeling.3 Wei Shao and
Terzopoulos introduced a complex pedestrian animation system that combined rule-based and cognitive models; it incorporated perceptual, behavioral, and cognitive control components.4
Several studies have integrated emotion and personal-ity models and roles into the simulation of autonomous agents, representing the individual differences through psychological states. Arjan Egges and his colleagues studied the simulation of the personality, emotions, and moods for conversational virtual humans.5 Taihua Li and colleagues
proposed a framework that, like ours, uses the Ocean (open-ness, conscientious(open-ness, extroversion, agreeable(open-ness, and neuroticism) model of personality to define and formulate a pedagogical agent in a social learning environment.6
However, these studies focused on individual agents, not crowds.
Only recently have researchers studied the perception of crowd variety. Christopher Peters and his colleagues evaluated pedestrians’ perception.7 They determined how
the orientation and context rules for characters in static scenes affect perceived plausibility. Rachel McDonnell and her colleagues analyzed the perceptual impact of the clon-ing of virtual characters for simulatclon-ing large crowds.8
References
1. C. Reynolds, “Flocks, Herds, and Schools: A Distributed Be havior Model,” Proc. Siggraph, ACM Press, 1987, pp. 25–34.
2. X. Tu and D. Terzopoulos, “Artificial Fishes: Physics, Locomo-tion, PercepLocomo-tion, Behavior,” Proc. Siggraph, ACM Press, 1994, pp. 43–50.
3. S.R. Musse and D. Thalmann, “A Model of Human Crowd Behavior,” Proc. Eurographics Workshop Computer Animation
and Simulation, Springer, 1997, pp. 39–51.
4. W. Shao and D. Terzopoulos, “Autonomous Pedestrians,”
Graphical Models, vol. 69, nos. 5–6, 2007, pp. 246–274.
5. A. Egges, S. Kshirsagar, and N. Magnenat-Thalmann, “A Model for Personality and Emotion Simulation,” Proc.
Knowledge-Based Intelligence Information and Eng. Systems,
LNCS 2773, Springer, 2003, pp. 453–461.
6. T. Li et al., “Modelling Personality, Emotion, and Mood for a Pedagogical Agent,” Proc. 25th IASTED Int’l Multiconference:
Artificial Intelligence and Applications (AIAP 07), ACTA Press,
2007, pp. 272–277.
7. C. Peters et al., “Crowds in Context: Evaluating the Per cep-tual Plausibility of Pedestrian Orientations,” Proc. Euro graphics,
Short Papers, Eurographics Assoc., 2008, pp. 33–36.
8. R. McDonnell et al., “Clone Attack! Perception of Crowd Variety,” ACM Trans. Graphics, vol. 27, no, 3, 2008, article 26.
2. L.R. Goldberg, “An Alternative ‘Description of Personality’: The Big-Five Factor Structure,” J.
Personality and Social Psychology, vol. 59, no. 6, 1992,
pp. 1216–1229.
3. N. Pelechano, J.M. Allbeck, and N.I. Badler, “Controlling Individual Agents in High-Density Crowd Simulation,” Proc. ACM Siggraph/Eurographics
Symp. Computer Animation (SCA 07), ACM Press,
2007, pp. 99–108.
4. F. Durupınar et al., “Creating Crowd Variation with the Ocean Personality Model,” Proc. 7th
Int’l Joint Conf. Autonomous Agents and Multiagent Systems (AAMAS 08), Int’l Foundation for
Autono-mous Agents and Multiagent Systems, 2008, pp. 1217–1220.
5. E.T. Hall, The Hidden Dimension, Anchor Books, 1966.
6. K.C. McLean and M. Pasupathi, “Collaborative Narration of the Past and Extroversion,” J. Research
in Personality, vol. 40, no. 6, 2006, pp. 1219–1231. Funda Durupınar received her PhD from the Department of Computer Engineering at Bilkent University. Her research interests include crowd simulation with heterogeneous be-haviors that incorporate psychological aspects of agents. Durupınar has an MS in computer engineering from Bilkent University. Contact her at [email protected]. Nuria Pelechano is an associate professor of Llenguatges i Sistemes Informàtics at the Universitat Politècnica de
Cata-human-avatar interaction in virtual environments. Pele-chano has a PhD in computer and information science from the University of Pennsylvania. Contact her at npelechano@ lsi.upc.edu.
Jan M. Allbeck is an assistant professor of computer sci-ence at George Mason University. Her research interests are at the crossroads of animation, artifi cial intelligence, and psychology in the pursuit of simulating humans, including functional, heterogeneous crowds. Allbeck has a PhD in computer and information science from the University of Pennsylvania. Contact her at [email protected].
U˘gur Güdükbay is an associate professor in Bilkent Uni-versity’s Department of Computer Engineering. His research interests include human modeling and animation, crowd simulation and visualization, and physically based mod-eling. Güdükbay has a PhD in computer engineering and information science from Bilkent University. He’s a senior member of IEEE and the ACM. Contact him at gudukbay@ cs.bilkent.edu.tr.
Norman I. Badler is a professor of computer and informa-tion science at the University of Pennsylvania. He also di-rects the university’s SIG Center for Computer Graphics and Center for Human Modeling and Simulation. His research interests center on computational connections between lan-guage and action. Badler has a PhD in computer science from the University of Toronto. Contact him at badler@seas. upenn.edu.
Silver
Bullet
Security
Podcast
S p o n s o r e d b ywww.computer.org/security/podcasts
*Also available at iTunes
In-depth interviews with security gurus. Hosted by Gary McGraw.