The effect of soundscape on the students' perception in the high school environment
8
0
0
Tam metin
(2) INTER-NOISE 2016. perception differences between selected areas in high school environment.. 2.. METHODOLOGY. 2.1 Case Study Setting Bilkent High School is chosen which is located in east side of Bilkent University Campus in Ankara. Two different functional spaces are defined as classroom and computer laboratory. Number of sound sources and the content of lesson are main criteria to select these study areas because computer laboratory class has more interactive lesson content than regular classroom lesson. Moreover, they have different sound source environment when compared their lesson requirements. To minimize the spatial differences, classroom and computer laboratory are selected similarly in terms of area sizes and location of spaces in the plan of the school. Computer laboratory is located between corridors without connection with outside and classroom is also located among three corridors and lateral façade. Computer laboratory has 55 m 2 area having around 15 students whilst classroom has 49 m 2 area having around 15-18 students. All measurements and interviews are conducted after obtaining required permissions from the relevant authority of school. 2.2 Objective Measurements To represent the acoustic environment of high-school environment, Equivalent Continuous A-Weighted Sound Levels (LAeq), Reverberation Time (T30), and Speech Transmission Index (STI) are measured. Equivalent Continuous A-Weighted Sound Levels (LAeq) are measured in unoccupied and occupied conditions as one-class hour time intervals, using Bruel & Kjaer Sound Level Meter type 2230. During LAeq measurements, sound level meter is located in the center of both spaces at the height of 120 cm. For the reverberation time measurements, four receiver and one source points are defined as seen in Figure 1 and it is measured in an unoccupied condition as one-minute time intervals, using Bruel & Kjaer Sound Level Meter type 2230 and Bruel & Kjaer omni-directional loudspeaker at the height of 150 cm.. Figure 1 – Receiver and source point in classroom and computer laboratory plan view 2.3 Subjective Surveys As a qualitative research method, semi-structure interviews are chosen to create a conceptual framework and to evaluate interpretation of auditory sensation of stud ents, using Grounded Theory research method. Semi-structure interviews were conducted until data reached the theoretical saturation point (11). 16 classroom and 14 computer laboratory students were interviewed during class hours in two school days. Interviews ranged from 4 to 14 minutes in duration. Semi-structure interview questions are covering some topics as identification of recognized sound, an indication of positive and negative sound sources, sound preferences, sound perception and sati sfaction. The data are recorded and transcribed verbatim. Transcriptions were later coded to derive themes and categories related to each space.. 4810.
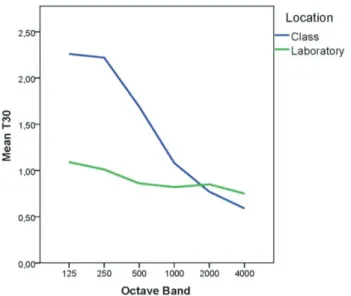
(3) INTER-NOISE 2016. 3.. RESULTS AND DISCUSSION. 3.1 Objective Results Mean value of Equivalent Continuous A-Weighted Sound Levels (LAeq) are measured as 62.6 db for classroom and 64.9 db for computer laboratory. The fluctuations between measured hours are shown in Figure 2.. Figure 2 – Equivalent Continuous A-Weighted Sound Levels in classroom and computer laboratory It can be said that speech is the most outstanding sound for working spaces and the common frequencies of speech are considered between 500 Hz to 2000 Hz in octave band (12). As indicated in literature, required reverberation time should be between 0.6 and 0.8 in mentioned frequencies (13). Reverberation Time (T30) results were found above recommended values that can be seen in Figure 3 and Table 1.. Figure 3 – Reverberation Times (T30) in classroom and computer laboratory Table 1 – Reverberation Times (T30) in classroom and computer laboratory Space. 125. 250. 500. 1000. 2000. 4000. Classroom. 2.39. 2.26. 2.23. 1.69. 1.08. 0.78. C.Laboratory. 1.1. 1.01. 0.9. 0.8. 0.85. 0.76. 4811.
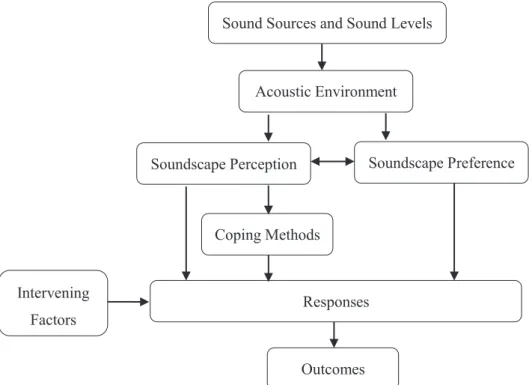
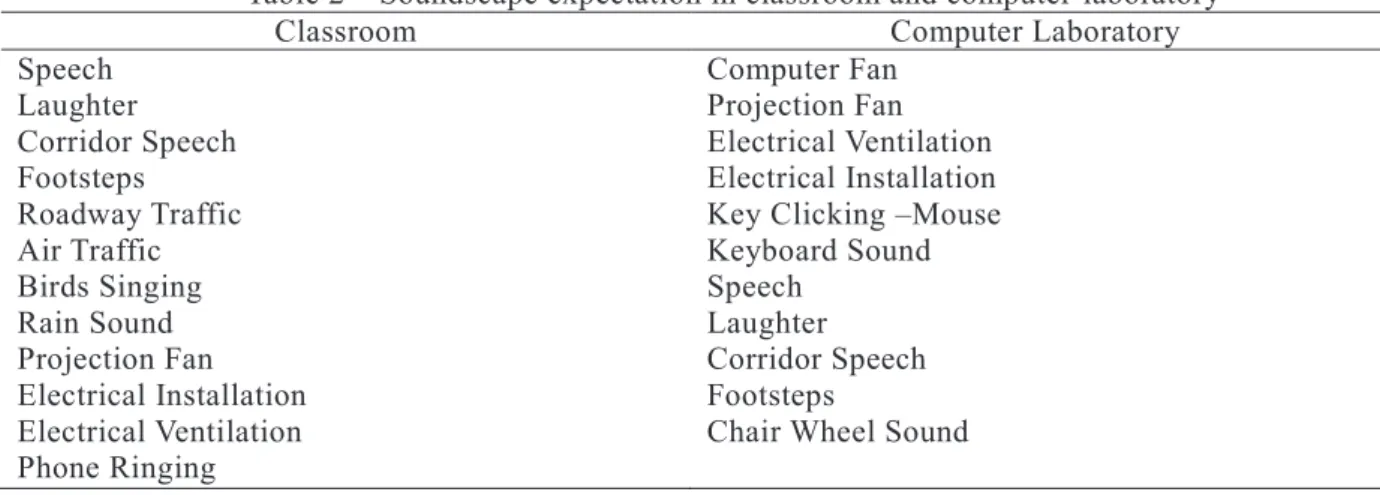
(4) INTER-NOISE 2016. The mean Speech Transmission Index (STI) values were measured quite similar as 0.63 db for classroom and 0.61 for computer laboratory. According to the Speech Intelligibility Scale, above 0.6 values are accepted as having good or excellent speech intelligibility (14). STI results of spaces show that both spaces have good speech intelligibility. 3.2 Subjective Results After transcribing the interviews, data was evaluated to derive themes and categories. In open coding step, data was divided into key terms to understand the general idea what data is about. These created key terms were questioned by making some comparisons and linkages with the e ach other in axial coding step. Merging terms generated categories and consequently sub-categories. This method helped to create a conceptual framework that will give information about the soundscape perception of students in high-school environment. This study generated one conceptual framework for both spaces as classroom and computer laboratory because results of spaces showed similar patterns within each other. Therefore, one conceptual framework was established to show perceptual understanding of students in high -school environment. Figure 4 shows the conceptual framework that is composed of eight main categories. These categories are sound sources &sound levels; acoustic environment, soundscape perception, soundscape preference, coping methods, responses, outcomes, and intervening factors. Soundscape perception is defined as a core category that forms all categories and their relationships between each other. The categories and their relationships will be analyzed in detail in next chapter, each category of the framework will be supported by CS (classroom student), and LS (laboratory student) comments to show the differences and similarities between categories. Sound Sources and Sound Levels. Acoustic Environment. Soundscape Preference. Soundscape Perception. Coping Methods. Intervening. Responses. Factors Outcomes Figure 4 – The conceptual framework for high-school environment 3.2.1 Sound Sources & Sound Levels In order to understand identification of recognized sound, students were asked to define what they expect to hear when they think their classroom or computer laboratory environment. Frequently said sound sources are listed in Table 2. When compared to the answers of students in classroom and computer laboratory, results are found different. Classroom students are said most frequently heard sound source is speech (n=13) whilst computer laboratory students said computer fan sound (n=12). Actually, this result is expected due to their different environmental conditions. To explain sound environment in detail, roadway traffic, laughter and birds singing can be given as examples of outstanding dominant sound sources in. 4812.
(5) INTER-NOISE 2016. classrooms and keyboard sound, ventilation sound, speech in computer laboratory. Moreover, sound levels are also important part of the perception of sound sources because same sound sources are perceived differently in different sound levels. Generally, students do not prefer to hear high sound levels because they interpret the high-level sound as a noise even if they like to hear in their learning environment. In addition, even if the acoustical measurements values are higher than recommended ones, some students are happy with their learning environment, and it shows that sound levels are not enough to explain the perception of the students. CS: My ideal is average. If the environment is so quiet, you feel a little sleepy but in high levels of sound, it is almost impossible to understand the lesson. Table 2 – Soundscape expectation in classroom and computer laboratory Classroom Computer Laboratory Speech Computer Fan Laughter Projection Fan Corridor Speech Electrical Ventilation Footsteps Electrical Installation Roadway Traffic Key Clicking –Mouse Air Traffic Keyboard Sound Birds Singing Speech Rain Sound Laughter Projection Fan Corridor Speech Electrical Installation Footsteps Electrical Ventilation Chair Wheel Sound Phone Ringing Students were asked to list their sound sources that do not belong to their environment. Roadway traffic (n=12) in classrooms and corridor speech (n=5) in computer laboratory are said mostly as background noise. However, students in computer laboratory mostly said that they do not perceive any background noise due to the location of computer laboratory. In addition, some students define background noise as a wanted situation. CS: I generally perceive background noise as a positive thing because it makes me feel that life goes on in outside. I feel better when I feel connection with outside. 3.2.2 Acoustic Environment In order to evaluate the perception of soundscape, it is important to understand acoustical conditions of related spaces. The acoustical measurement results of both spaces showed that although LAeq and T30 values are measured above recommended values; STI is recorded as recommended range as mentioned in the section of objective results. The statistical results can be seen in Table 3. 3.2.3 Soundscape Preference Students were asked to define their preferences for their learning environment because indication of wanted and unwanted sound sources is necessary to understand the preferred high school environment. When asked, students mostly preferred to hear music as a wanted sound in their learning environment as indicated in Table 3. However, students defined their preferences in terms of the context of lesson. For example, students generally prefer to work with music if task requires less effort or the lesson is based on applied method. Therefore, computer laboratory students preferred music more compared to classroom students in their learning environments. LS: It depends on the situation. If I need to work something very serious, I prefer quiet environment but if I am doing my performance study, I can listen classical music unless it is not in high level. Moreover, quiet environment were generally perceived differently because it does not mean that lack of negative sound results in the positive environment (15). As indicated in literature, the answers about quiet environment have both positive and negative approaches as, LS: Actually, I prefer the quiet environment but I am not trying to say that everybody should be quiet and we just hear the fan of computers. It is not also a good silence. I am talking a bout the deathly silence. I just want to hear the teacher’s speech in necessary situations. CS: I prefer to hear the teacher’s speech and a little speech and laughter. I also want to hear outside noise because I do not like quiet environment, but high levels of sound are also bad.. 4813.
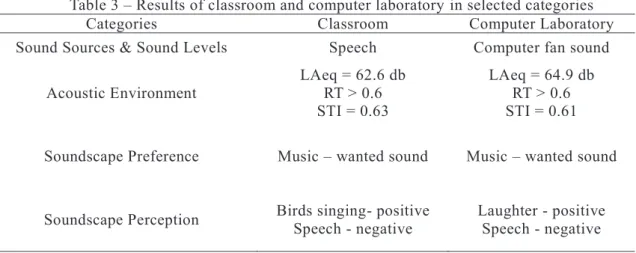
(6) INTER-NOISE 2016. 3.2.4 Soundscape Perception To understand the sound sources perception of students, students were also asked to define positive or negative sound sources in their environment. Results showed that positive or negative sound sources are determined according to the association with environment, social and cultural preference of the user and mood of the user. The most positive sound sources are birds singing (n=13) in classroom whilst laughter (n=7) in computer laboratory as seen in Table 3. Speech is found as most negative sound source if we evaluate only statistical value. However, speech is a controversial sound source to classify whether it is perceived as a positive or negative sound source. Some students are accepted speech as a part of the environment, and some students do not want to hear speech in lesson. CS: For example, speech of my friends. Sometimes it is positive and sometimes it is negative . It changes according to the lesson. We are in an important lesson such as electricity in physics. I have to learn in lesson and I do not except to talk in that moment. However, in a boring le sson, speech of my friends helps me concentrate the lesson again. Table 3 – Results of classroom and computer laboratory in selected categories Categories Classroom Computer Laboratory Sound Sources & Sound Levels. Speech. Computer fan sound. Acoustic Environment. LAeq = 62.6 db RT > 0.6 STI = 0.63. LAeq = 64.9 db RT > 0.6 STI = 0.61. Soundscape Preference. Music – wanted sound. Music – wanted sound. Soundscape Perception. Birds singing- positive Speech - negative. Laughter - positive Speech - negative. 3.2.5 Responses As seen in the conceptual process of soundscape in Figure 4, all categories actually are about the soundscape perception. After sound sources distribute space and time, our brain starts to detect and understand the acoustic environment; and creates responses towards it. This process composes our perceived environment. Classroom and computer laboratory environment does not give very diffe rent responses towards the acoustic environment. The answers of students were analyzed as positive responses, negative responses and neutral responses. Sound sources resulted in positive responses such as promoting the relaxation, interaction, comfort, attention, concentration, motivation and mood or negative responses such as distraction, disturbance, annoyance, loss of concentration, loss of productivity. CS: If the classroom is so noisy, I cannot feel motivated or cannot concentrate on the lesson because in a noisy environment, how can I be productive? I do not know. LS: In a quiet environment, I feel very relaxed and stay focused the lesson. After that moment I do not concentrate on the environment, I concentrate on my lesson. CS: If we analyze general perspective, it depends on the person. Some people become very annoyed about noise, and some people raise the noise without feeling any disturbance. For me, there is noth ing new. Apart from positive, negative and neutral responses, students used also some emotional terms to define their feelings towards sound sources. It shows that sound perception is about not only the sound levels, but also emotions. CS: I prefer to hear music while working. It is relaxing and it makes me happy. When I feel happy, I work harder. 3.2.6 Coping Methods Another important part of the conceptual model is coping methods because students who are exposed to sound sources improved some solutions to handle with the conditions because if the sounds are accepted, understood and habituated; the soundspace perception shows more positive approach. 4814.
(7) INTER-NOISE 2016. (16). Both classroom and computer laboratory students sometimes accepted sound within the environment as it is or they tried to find solutions to handle it. LS: There are always some talks and laughter in lesson, but I do not feel bad about it. I think they are part of this environment. CS: If there is so much noise, I put my head to table, and try to isolate myself from environment. After then, I try to stay focused on my lesson. 3.2.7 Outcomes Outcomes are also seen as a part of conceptual framework as a long -term consequences of soundscape perception. It may be analyzed in two sections as physical outcomes or long -term outcomes. Results showed that perceived sound resulted in physical outcomes such as headache, fatigue and long-term outcomes such as lesson failure. CS: If I cannot hear my teacher clearly, my desire to listen is decreasing. Maybe, I am thinking that I understood the lesson. Actually, I do not. I understand this situation after I failed the exams. CS: When I heard variety of sounds, I have a headache. 3.2.8 Intervening factors Physical factors have an effect on the soundscape perception and change the context in which soundscape was generated. These factors are found as some environmental factors such as lighting, heating, odor; spatial factors such as location; formal factors such as insulation and user factors such as behavioral tendency, background information and mood. The effects of these factors can contribute the perception of soundscape as positive or negative. CS: Heating is very important because the environment becomes very stuffy. In these circumstances, I cannot listen. LS: It is very stuffy because we are in the underground. We cannot take daylight, it makes me very encompassed.. CONCLUSIONS This article aimed to create a conceptual model that reflects perceptual construct of soundscape in high school environment. The study revealed eight categories that explain the factors affecting the perception of students in high school environment. In sound sources & sound level section, classroom students mostly expected to hear speech whilst computer laboratory students expected to hear computer fan sound. Moreover, students mostly preferred to hear music as a wanted sound in their learning environment. According to students’ perception, the most positive sound sources are birds singing in classroom whilst laughter in computer laboratory. Speech is found as most negative sound source in both spaces. In responses section, it is seen that sound sources resulted in positive responses such as promoting the relaxation, interaction, comfort, attention, concentration, motivation and mood or negative responses such as distraction, disturbance, annoyance, loss of concentration, loss of productivity. To handle with these responses, students sometimes improved a coping method such as habituation, isolation. Responses resulted in long-term outcomes such as lesson failure. Moreover, intervening factors such as heating, lighting, background information were also found important in soundscape perception. In addition to that, results confirmed that it cannot be evaluated by regarding the objective measurement parameters alone. Study should be analyzed within the content and interpretation of sound coexisting with objective parameters. Moreover, perceptual understanding of the soundscape depends on not only the individual perception but also the context of physical and social environment. This study is important to create the conceptual framework in high school environment and to contribute literature as a case study example on soundscape approach. This study will hopefully create awareness among future researchers to investigate other possible relationships in learning environments to increase the students’ satisfaction and lesson performance.. ACKNOWLEDGES The authors would like to thank authority of Bilkent High School for their support and cooperation during the study.. 4815.
(8) INTER-NOISE 2016. REFERENCES 1. Lubman D, Sutherland L, editors. Good classroom acoustics is a good investment. International congress on acoustics ICA; 2001; Rome, Italy 2. Karabiber Z, Vallet M. Classroom acoustics policies–An overview. Acta Acustica (Stuttgart). 2003;89(12). 3. Hagen M, Huber L, Kahlert J, editors. Acoustic school design. Forum Acusticum; 2002; Sevilla, Spain. 4. Liu F, Kang J. A grounded theory approach to the subjective understanding of urban soundscape in Sheffield. Cities. 2016;50:28-39. 5. Brown AL, Kang J, Gjestland T. Towards standardization in soundscape preference assessment. Applied Acoustics. 2011;72(6):387-92. 6. Kang J. Numerical modelling of the sound fields in urban streets with diffusely reflecting boundaries. Journal of Sound and Vibration. 2002;258:793–813. 7. Kang J. Urban sound environment. London; New York: Taylor & Francis; 2007. 8. Kang J, Yang W. Acoustic comfort evaluation in urban open public spaces. Applied Acoustics. 2005;66: 211–29. 9. Kang J, Zhang M. Subjective evaluation of urban environment: A case study in Beijing. International Journal of Environment and Pollution. 2009;39:187–99. 10. ISO 12913-1:2014(E) Acoustics - Soundscape - Part 1: Definition and conceptual framework. Switzerland2014. 11. Strauss A, Corbin J. Basics of qualitative research. Newbury Park: Sage; 1998. 12. Acun V. Investigating. the effect of indoor soundscaping towards employees' mood and perception in open. plan offices. Ankara: İhsan Doğramacı Bilkent University; 2015. 13. Egan MD. Architectural acoustics: McGraw-Hill Custom Publishing 1988. 14. Acousticator.. Speech. Transmission. Index. 2012. [cited. 2015. 13. August].. Available. from:. https://en.wikipedia.org/wiki/Speech_transmission_index#/media/File:STI_CIS_Scale.png. 15. Truax B. Acoustic Communication. Norwood, New Jersey, USA: Alex Publishing Corporation; 1984. 16. Mackrill J, Cain R, Jennings P. Experiencing the hospital ward soundscape: Towards a model. Journal of Environmental Psychology. 2013;36:1-8.. 4816.
(9)
Şekil

+2
Benzer Belgeler
Amaç: Çal›flman›n amac›, üç boyutlu ultrasonografi taraf›n- dan ölçülen plasental volüm ve plasental ortalama gri de¤e- rinde fetal cinsiyetin etkisini
SCROL strategy: SCROL as a reading comprehension strategy help students and readers to understand the texts by teaching them how to use headings and
Riemann dönüşüm teorisinde, geometrik teoremleri ilgilendiren S sınıfının fonksiyonlarından ünivalent fonksiyonlar bir sınır noktasından daha çok rastgele seçilen
nirim. Her akşam geç saatte uyurum. Terli terli su içerim. Bol bol çikolata yerim. Kışın ince kıyaf etler giyerim. Meyveleri yıkamadan yerim. Bol bol şeker
Eski başbakanlardan Necmettin Erbakan’a atfedilen “İmam Hatip Liseleri bizim arka bahçemizdir.” sözünden mülhem ve sık kullanılan arka bahçe tabiri, oy
Dönemin Mısır Valisi Mehmet Ali Paşa 7 ’nın kâtibinin şehit edilişi nedeniyle şikâyet ve üzüntüsünü dile getiren şair, olaya şöyle bir tarih
In patients who used adhesive on the second-week, a significant difference in satisfaction was observed bet- ween the first and second week (p < 0.01).. Conclusion: The use
mayan inançlar [maladaptive beliefs] (Mitchell ve Krumboltz, 1987), akılcı olmayan beklentiler [irrational expectations] (Liptak, 1989; Nevo, 1987), işlevsel
