Assessment of Information Redundancy in
ECG
Signals
B
Acar,
L OzCakir, H
Koymen
Bilkent University, Department
of
Electrical and Electronics Engineering, Ankara, Turkey
Abstract
I n
this p a p e r , the morphological information redun-d a n c y in, standard
12
leadECG
channels i s studied. Sturlyis
based O I L decomposingth.e
ECG
c h a n n d s intoorthogonut1 chmnnels by an, SVD based algorith,m and then reronstruciiny them,. Them
7
of 8 in,dependendyrecoi-ded ECG chan.nels are decomposed and the missing
chan,nPl i s recon,ntrircted froin these orthogonal chan- nels. Thus t h e unique morphological information con- tent of each
ECG
channel i s assessed through the lossos cliiiical information in the reconstructed signal. A coinpai-ison of the cliiiical parameters measured f r o m t h e reconstructed and original
ECG
is reported.1.
Introduction
Several modeling techniques were reported in the lit,erat>ure th a t models tlie ECG by fitting Ga.u ciirves
[I],
by using wavelets[a]
arid by calculating the Fourier Series coefficients [ 3 ] . Tai [4] used a Markovsystem to eiiha.rice subband coding of ECG where he coiisidered iiitersairiple redundancy in estimating next
coming sample values from the previous ones. In these
approaches redundancy in E C G is evaluated from a
codiiig point of view. Lux et.al.
[5]
emphasizes tlie im- portance of Lisiiig a small number of optimally selected lead in ECG iriterpretatiori and hence addresses infor-illation redundancy in standard 12 lead ECG channels.
We decomposed these signals into orthogonal com-
ponents hy an online SVD based algorithm [ 6 ] , for noise elimination in exercise ECG. T h e decomposed signals are rpconstriicted and compared with the original sig- nal i n t,ernis of iiieasured morphological parameters,
1'-wave, R-wave, T-wave amplitudcs, R-wavc duration
a n d j-point, cleva.tion.
2.
Method
50 exercise ECG records of lengths between 6 : 2 0 t o 2O:OO minutes are analyzed. D a t a was sampled at 500
samples/second and at 1 2 bits resolution. All t>hese
d a t a are recorded tlririiig str t>ests performed under Bruce protocol.
The first, 30 seconds of each record is used for traiii- ing the SVD algorjthrn and the rest is used for the anal- ysis. All d a t a is divided into 20 second periods, which are called a segment. Thus we have 30 segments for a 10 minute data,. Two different reconst,ructcd d a t a sets
are produced: (i) 8 ECG clianiiels are decomposed by
a SVD based algorithm and reconstructed using only 3
orthogonal channels which contain the ECG informa-
tion [ 6 ] . This set will be referred to as SD. (ii) 7 out
of 8 c,lia.nnels are decomposed intjo its orthogonal com- ponents and then the missing channel is reconstructed by the reconstruction coefficients of t,he previous seg- ment obta.ined for 8Dl a.nalysis. T h e decomposition is done with 8 ECG cliaiinels uiitil tlie end of the previous
segment and channel exclusion is done only during the
current segment. Thi:: process is repeated for each seg-
ment of each record. This set will be referred l,o a.s 7D. The segments wilh h g l i iioise, in which the SVD a.1-
gorithrri excluded Ilie iioisy cliaiiiiel automatically, are also exclucled froiri (,lie aiialy . An a.vera,ge lieat, is calcula.ted for each of the rest of the segments. Clini-
cal parameter nieasurement,s a.re made on t,liese average beats for each segment included i n the a.iialysis.
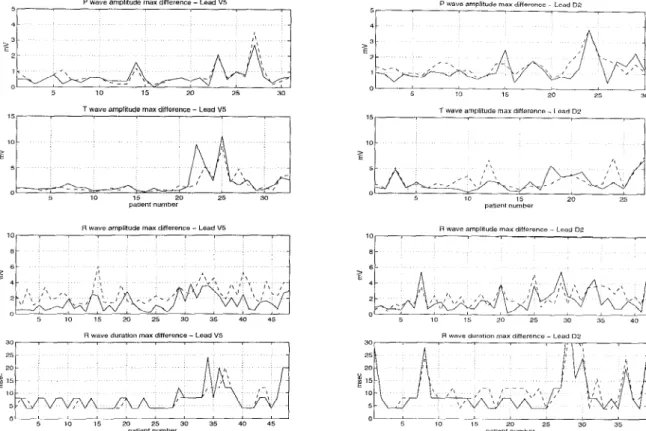
In this paller, Lhe coiriparisoii of R.- wave, P-wave,
T-wave amplitudes, FL-wave duration arid j-point el-
evation measurements iriade on t,liree setts of d a t a are
presented. T h e comparison of wave amplitudes and du-
ration is made for precordial lead V5 and limb lcad DII.
These measurements on avera.ge bea.ts for ca.ch scgmeiit
is performed using the IBM-Mt.Sinai hospital program.
J-point clevatioii comparison is presented for all chan- nels, but on the other liand for n single segment.
3.
Discussion
J-point eleva.tion is measured on the average heats ure 1 shows measurem,eiit,s done on input,, 8D and 71)
signals. Both of the ineasuremeiits from 8D arid 7D
signals a.pproxima.te t,he mcasureiiieritjs from input sig-
of t h e first, segment of' each record for all channels. Fig-
I-oolnt elevations of dZ lead
I-point elevatiOnS of v l lead 0 5 0 -0 5 -1 5 2 5 10 15 20 25 30 35 40 -2 5 patient number
i-point elevations of v 3 lead
l-poml elevations of v5 lead
1 4 1 2 1 0 8 0 6 > U 4 0 2 0 -0 2 I 5 10 15 20 25 30 35 40 0 4 patient number 16 1 4 1 2 1 0 8 > 0 6 0 4 0 2 0 5 10 15 2 0 25 30 35 40 - 0 2 L ' patient number
pa mint elevations of v2 lead
0 -0 2 -0 4 -0 6 -1 -1 2 -1 4 - 1 6
1
5 1 0 15 20 25 30 35 40 -1 8 patient number pallent numberI-polnt elevations 01 "6 lead
I
0 4
0 2
5 10 15 20 25 30 35 40
patbent number
Figure 1: J-point Eleva.tion (-:Input
,
--:SD
... :7D)P Wavo amplllUde max differoncc Lcod De P wave amplitude max dlflerence - Lead V5
5 10 15 20 25 30 5 10 15 20 25 30
T wave amplitude max difference - Lsad V5
15 1 0 > 0 5 10 15 20 25 30 patlenr number
R wave amplitude max diflerence - Lead V5
10, , I 8 6 4 2 0 3 5 10 15 20 25 30 35 40 45
R wave duration max dillerence - Lead V5
5 I 0 15 20 25 30 35 40 45 patient number 10 5 5 15 20 25 patient number patient number > 6 4 2 0 5 10 15 20 25 30 35 40 25 20
E
15 10 5 I 5 10 15 20 25 30 35 patient numberFigure 2: Max. absolute difference in measured clinical paramet,ers (-:Inp8D
,
- - : I n p 7 D )i d s well. Since t,he d a t a is recorded during stress tests, t>he input signals are also noisy. Reconstructed signals, however, are less noisy due t o noise elimination during reconstruction [6]. It can be conjectured t h a t lhe rel- ative difference between the iriput channel and recon- structed channels are partly caused by Lhis l x t . Table
1 shows the mean absolute difference between llie in- p u t , 8D and
7D
signals. T h e difference in 7D signals is son1ewha.t higher than the differencein
8D signals. Ascan be observed in Figure 1, j-point level is very well approxii-na.tec1 in reconstructed signals for this patient da.ta set.
The IBM-Mt,.Sinai Hospital program is developed t,o analyze rest, ECG. T h e measurement part, of the
program occa.sionally fails to detect the complexes and
hence we encountered measurement problems when the
linked medians composed of median beats of every seg-
iiieiit, is processed by the program. We had to exclude t,he records with such detection errors. As a result, we used different, set,s of d a t a in the analysis of different pa.ramet3ers. T h e r ~ c o r d s with noise and artifacts are iiiaiiit,aiiiecl i n the d a t a set. T h e analysis program made some measurement errors i n such records.
Figure 2 shows the maximum absolute differences
in D9 and 17.5 among all segments for each record an-
Lead Input-813 (mV) Inpiit-7D (inV)
0.04 0.11
V3 0.05 0.18
v4 0.05 0.06
Table 1: Mean a b s o l u k difference in j-point clevntion
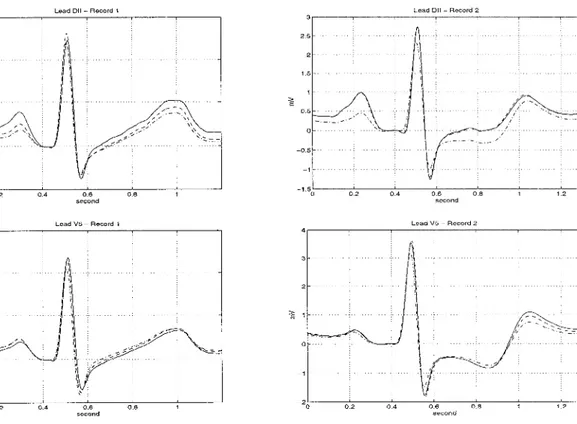
alyzed. The large differences are mainly clue to mea- surement errors, such its p t i e n t 27 in V.5 P-wa.ve am- plitude. The average beats of this patient are given in Figure
3
- Record 1, where a very good reconstructionis observed. T h e avera,ge beats obtained from input, 8D
and 7D signals, in two typical records, are shown. 8D
signals are almost the m m e as input signals. However,
roneous. It is observed that the highest diff'erences oc-
cur a t P-wave and T-wave. DII, in 7D signal, has much
higher deviation from the input signal whei1 compared
measureiiients froin 7c1 signals a r e s o n x e w h a t inore er-
Lead DII - Record 1
Lead V5 ~ Record 1 Lead V 5 ~ Record 2
4 I
Figure 3 : -:Input - -:8D -.-:7D
with other derivations. T h e relatively large differences in R-wa1.e amplitude, observed in Figure 2 , is due t o the large values of that parameter.
4.
Conclusion
In this study, we first showed t h a t the morphological inforiiia,tioii is preserved during the decomposition and reconstruction process given in [ 6 ] . This shows t h a t the
relevant information in ECG can be represented in a 3
diixieiisiona.1 space without significant loss of informa- t,ion.
Then we showed t8he information redundancy in stan-
dard 12 lead E C G channels. Each one of the 8
ECG
channels is reconstructed from the information present in other 7 cha.nnels and it is observed t h a t the clini- cal inforination can be regained when compared to the original channel.
Due t,o t,he detection and measurement problems mentioned a.bove, further assessment of these and other clinical pa.ra.nieters inust be done with a n improved
detection and measurement tool suitable for exercise ECG data..
5.
References
[l] Suppappola S., Sun Y., Chiarainida S.A., “Gaussian
Pulse Decomposition - An Intuitive Model of Electro-
cardiogram Wave-Forms,” A n n a l s Of Biomedical E n -
gineering, vol. 25, Iss 2,pp. 252-260
,
1997.[2] Hilton M.L., “Wavelet and Wavelet Pa.cket Compres-
sion of Electrocardiograms,” I E E E Trans. O n Biomed-
ical Eng. , vol. 44, Iss 5,pp. 394-402
,
1997.[3] Alnashash H.A.M., “A Dynamic Fourier Series for the
Compression of ECG Using F F T and Adapt,ive Co-
efficient Estimation,” Medical Engineering 63 Physics,
[4] Tai S.C., “Improving the Performa.nce of Elect-rocar-
diogram Subba.nd Coder by Ext,ensive Ma.rkov Sys-
tem,” Medical 63 Bzologiccrl Erigin.eerin,g 63 Comprcting,
vol. 33, Iss 3,pp. 471-475 , 1995.
[SI Lux R.L., Macleod
R.S.,
Fuller Id., Green L.S., Korn- reich F., “Estimating E C G Distributions from SmallNumbers of Leads,” Journal of Electrocordiology, vol.
28, Iss S,pp. 92-98 , 1995.
[6] Acar B., Koymen H., “Online Exercise ECG Signal
Orthogonalization” Proceedings of Computers I n Car-
diology’96, pp. 237-240 , 1996. vol. 17, ISS 3,pp. 197-203 , 1995.
Address for correspondence: Bilkent University
Eng. Fac. EE Dept.
06533 Ankara Turkey tel/fax: ++90-312.2664307
e-mail: buraka~ee.bilkent,.edu.tr