YIELD OF WHEAT IS INCREASED THROUGH IMPROVING THE
CHEMICAL PROPERTIES, NUTRIENT AVAILABILITY AND
WATER PRODUCTIVITY OF SALT AFFECTED SOILS IN THE
NORTH DELTA OF EGYPT
SOROUR,S.GH.1–A IAD,M.A.2–A HMED,A.A.1–H ENASH,M.I.A.1–M ETWALY,E.M.1– ALHARBY,H.3–B AMAGOOS,A.3–H OSSAIN,A.4–B ARUTCULAR,C.5–S ANEOKA,H.6–E L SABAGH,A.1* 1Agronomy Department, Faculty of Agriculture, Kafrelsheikh University, 33516 Kafrelsheikh, Egypt
2
Soils, Water and Environment Research Institute, Agriculture Research Center, 33717 Kafr Elsheikh, Egypt
3
Department of Biological Sciences, Faculty of Science, King Abdulaziz University, 21589 Jeddah, Saudi Arabia
4
Bangladesh Wheat and Maize Research Institute, Nashipur, Dinajpur-5200, Bangladesh 5
Department of Field Crops, Faculty of Agriculture, Cukurova University, Turkey 6Laboratory of Plant Nutritional Physiology, Graduate School of Biosphere Science, Hiroshima
University, Japan *Corresponding author
e-mail: [email protected] (Received 18th Feb 2019; accepted 1st May 2019)
Abstract. The lysimeter experiment was carried out twice in consecutive two years (2014-15 and
2015-16) at Sakha Agricultural Research Station, Kafrelsheikh, Egypt to study the effect of three irrigation levels water (i.e., 100, 110 and 120% field capacity (FC), two rates of gypsum (G) (i.e., 50 and 100% G) and three sources of nitrogen (90 kg nitrogen (N), 10 t compost (C) and 7.5 t C + 45 kg N (CN) fed-1
(fed = 4200 m2)) on grain yield of wheat, water relations and soil chemical properties. Water consumptive
use (WCU) was markedly increased due to the increase of the level of irrigation, rate of gypsum (G) and CN source (7.5 t C + 45 kg N fed-1). Irrigation with water amount equal to 120% FC recorded the highest
values of WCU 1433 and 1570 m3fed-1 in both seasons. Water productivity (kg grain m-3 water) for either
water application (WA) in both seasons or WCU in the second season was decreased by increasing level of irrigation from 100 to 120% FC in the second season, while the inverse was true for WCU in the first season. The highest mean values of water productivity for WCU 1.816 and 1.791 kg m-3 were obtained
with the irrigation level of 120% FC in the first season and 100% FC in the second season, respectively. Gypsum rate and N source have an effect on the productivity of irrigation water (WP) for WA and WCU, where the highest mean values for both the two irrigations efficiency were recorded under 100% G requirements and CN (7.5 t C + 45 kg N fed-1). The interaction of 110% FC × 100% G × 7.5 t C + 45 kg
N fed-1 produced the highest values of WP for WA (1.245 and 1.374 kg grain m-3 WA) in both seasons.
Grain yield fedd.-1 was increased significantly with the irrigation level from 100 to 120% FC in both
seasons, G rate and CN source. Grain yield (GY) did not differ significantly due to the levels of irrigation water between 120 and 110% FC in both years. Application of 100% G and 7.5 t C + 45 kg N fed-1 at any
irrigation level were among those treatments having high GY, being insignificant. The mean values of electrical conductivity (acidity; ECe) and soil sodicity (SARe) were affected by irrigation treatments, G rates and nitrogen sources. A stronger reduction in soil ECe and SARe were recorded under the irrigation level of 120%FC, 100% G and 10 t compost in both seasons. While the soils ECe and SARe were increased by application of chemical N fertilizer alone or with compost. Therefore, it can be concluded that irrigation with water amount equal to 110 or 120% FC, 100% G requirements and 7.5 t C and 45 kg N fed-1 was the best treatment for getting high GY, improving the soil chemical properties, nutrients
Keywords: irrigation, lysimeter, soil salinity, soil sodicity, gypsum
Abbreviations: C: compost; CN: carbon & nitrogen; ECe: electrical conductivity (soil salinity); FC: field
capacity; fed.: feddan (fed = 4200 m2); G: Gypsum; GY: grain yield K: potassium; N: nitrogen; OM:
organic matter; P: phosphorus; SARe: sodium adsorption ratio (soil sodicity); t: ton; WA: water applied; WCU: water consumptive use
Introduction
Wheat (Triticum aestivum, L.) is a vital cereal across the globe and it is the most widely grown food cereal crop and its demand is increasing with the increasing population (Hossain et al., 2018; Jahan et al., 2019). It is considered a strategic crop and has played a major role on the national economy and it is one of the widely adapted cereals, grown in different environments (Barutcular et al., 2017; Yildirim et al., 2018). In Egypt, it is also the main food crop, as the current production of wheat does not meet the consumption demand. Recently US' Foreign Agricultural Service (FAS) in Cairo estimated that the wheat production in Egypt reaches 8.45 million metric tons (MMT) in the year in 2018-19, which was 4.3% higher than 2017-18 (Egypt Today, 2018; IndexMundi, 2018). Although in the year 2017, 60.2% of Egypt’s total wheat consumption was imported. Concerning wheat consumption, FAS Cairo forecasts Egypt’s total wheat consumption in the marketing year (MY) 2018-19 was 20 MMT, which was 1.5% more than the MY 2017-18 (Egypt Today, 2018; IndexMundi, 2018). Therefore, it is confirmed that the demand for wheat in Egypt is increasing day by day, but domestic production could not meet the current demand. As a result, to meet the food security of increasing population, the government of Egypt has taken several initiatives such as increase the area of production, development of high yield potential and stress resistance wheat cultivars, and also to find out improved management practices for reduction the imported percentage to be less than 50% (McGill et al., 2015; IndexMundi, 2018).
Wheat production depends on several factors including environmental condition, cultivars and management factors, such as irrigation and soil fertility. Among the management approaches, irrigation and fertilization and their interaction are considered the most important factors for increasing wheat production (Shaaban, 2006). For example, application of one irrigation increases the yield of wheat by more than 40%, whereas two to three irrigations with proper water and fertilizer management practices increase wheat yield by 50-100% (Hossain et al., 2006). However, to assist the efficient water use, plant-soil-water positive and negative interaction should be well understood under various environmental conditions, particularly in arid and semi-arid regions, where irrigation water is limit due to lack of rainfall (Musick et al., 1994; Wiedenfeld, 2000; Halitigil et al., 2000).
On the other hand, as Egypt is situated under the arid and semi-arid region of the Mediterranean environment, heat, drought and salinity are the major abiotic stress which decreases the productivity of wheat (Al-Naggar et al., 2015a, b; Abdelaal et al., 2018). Among the abiotic stresses, salinity is the most important one that adversely affects the productivity and quality of wheat through altering the physiological and biochemical activity of plants (Otu et al., 2018; Yassin et al., 2019) by accelerating osmotic stress and ion cytotoxicity in plants’ cell (Chen and Jiang, 2010; Islam et al., 2011). It is anticipated that the consequence of soil salinity may be increased in future due to the scarcity of annual rainfall, rising of sea water, irrigation with saline water,
excessive use of fertilizers and absence of a good drainage system, particularly in the Mediterranean environment (El-Hendawy et al., 2005).
Therefore, to improve or reclaim the sodic soil for sustainable crop production, it is
important for replacing the most of the Na+ by the most favourable Ca++ followed by
removal/leaching of salts derived by the reaction of the amendment from sodic soil. While many chemical compounds such as amendments are known in this respect of effective salts reclamation. For example, amendments directly or indirectly supply
soluble Ca++ and improve the soil productivity by escaping Na+ from saline soils. Sodic
soil reclamation by using amendment will largely depend on the nature of the soil,
effectiveness and cost considerations. Among the amendments, gypsum (CaSO4-2H2O)
is a typical soil amendment, which replaces Na+ ions by the calcium (Ca++) ions (Hanay
et al., 2004).
However, the presence of organic matter (OM) through the management of crop residues, using different types of organic manures in the soil is a fundamental option for maintaining soil fertility and productivity. It improves the physical properties, biological activity, water holding capacity and soil’s aeration for better seed germination and seedling stand establishment (Edwards and Hailu, 2011). Considering the above important issues for the sustainability of crops production, the research was aimed to study the effect of different requirements of irrigation water, soil amendments and nitrogen fertilization on wheat yield, water relations and some soil chemical properties.
Materials and methods
Location and duration of the study
The lysimeter study was established during the wheat grown season of 2014-15 and 2015-16 at Sakha Agricultural Research Station, Kafr ElSheikh-Egypt. The location lies in 134 km north Cairo, Egypt under North Delta-Egypt. The location is situated at 31°07’N latitude and 30°57’E longitude. The study aimed to study the effect of irrigation water level, soil amendments and nitrogen fertilizer sources on wheat yield, water relations and some soil chemical properties.
Physical and chemical properties of lysimeters’ soil
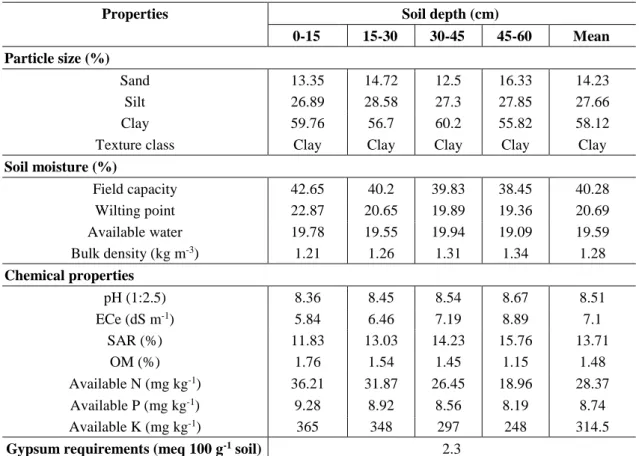
Soils in the North Delta of Egypt are characterized by saline and sodic. For determination of soils’ chemical and physical soil properties, soil samples were taken from each lysimeter at the depth of 0-15, 15-30, 30-45 and 45-60 cm before sowing and after harvesting in both seasons (Table 1). Soil reaction (pH) was determined according to Cottenie et al. (1982), electrical conductivity (ECe) according to Page (1982) and sodium adsorption ratio (SAR) was calculated. Soil OM status was estimated though Walkally Black method according to Hesse (1971). Available N and K were determined according to Jackson (1967). Phosphorus (P) availability was observed according to Olsen et al. (1954), by following sodium bicarbonate method. Mechanical soil analysis was determined according to the international pipette method (Piper, 1950). Gypsum requirement was calculated according to Schoonover method (1952). Soil bulk density was measured by using the core sampling technique as described by Campbell (1994). The chemical composition of compost used in the study is amiable in Table 2. The
lysimeters were fertilized with 15.5 kg P2O5 feddan-1 in the form of calcium
superphosphate (15.5% P2O5) during soil preparation.
Table 1. Physical and chemical properties of the lysimeters’ soil recorded before sowing during the 2014-15 season
Properties Soil depth (cm)
0-15 15-30 30-45 45-60 Mean Particle size (%)
Sand 13.35 14.72 12.5 16.33 14.23 Silt 26.89 28.58 27.3 27.85 27.66 Clay 59.76 56.7 60.2 55.82 58.12 Texture class Clay Clay Clay Clay Clay
Soil moisture (%) Field capacity 42.65 40.2 39.83 38.45 40.28 Wilting point 22.87 20.65 19.89 19.36 20.69 Available water 19.78 19.55 19.94 19.09 19.59 Bulk density (kg m-3) 1.21 1.26 1.31 1.34 1.28 Chemical properties pH (1:2.5) 8.36 8.45 8.54 8.67 8.51 ECe (dS m-1) 5.84 6.46 7.19 8.89 7.1 SAR (%) 11.83 13.03 14.23 15.76 13.71 OM (%) 1.76 1.54 1.45 1.15 1.48 Available N (mg kg-1) 36.21 31.87 26.45 18.96 28.37 Available P (mg kg-1) 9.28 8.92 8.56 8.19 8.74 Available K (mg kg-1) 365 348 297 248 314.5
Gypsum requirements (meq 100 g-1 soil) 2.3
Table 2. The chemical composition of compost used in the experiment
EC dS/m pH 1:5 Total N % C % C/N ratio OM % Total P% Total K% Fe ppm Zn ppm Mn ppm Moisture % 3.76 8.23 1.79 29.78 16.64 51.34 1.68 1.28 142 51 132 26.80
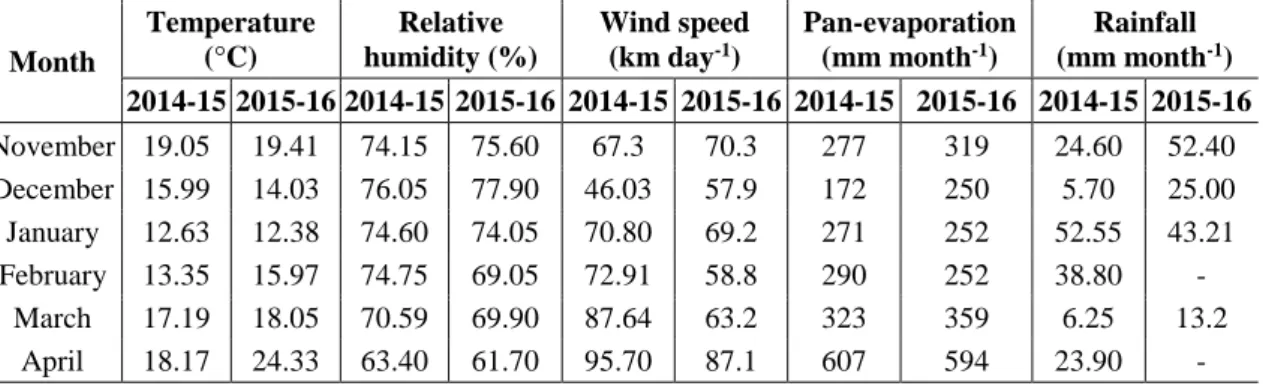
Meteorological information during growing seasons
The meteorological data on mean monthly temperature, relative humidity, wind speed and pan evaporation as well as rainfall in both seasons (2014-15 and 2015-16) from Sakha Station were recorded and presented in Table 3.
Experimental treatments and design
Treatments of the present study were arranged in a split-split plot design and repeated four times in both seasons. Where main plots were arranged in levels of irrigation, sub-plots were in rates of gypsum (G) and sub-sub-plots were in sources of nitrogen. Irrigation was done five times at all irrigation treatments: first irrigation was done at each of sowing, the second was tillering, third at jointing, fourth at heading and final one (fifth irrigation) were done at milking stages. Irrigation treatments were started
after the sowing irrigation. Amounts of applied irrigation water were equal to 100, 110 and 120% of field capacity (FC) in the root zone (0-60 cm depth) of the plants. The second and third irrigation were increased 10 and 20% than FC as leaching requirement.
Gypsum (G) requirements were used in two rates, i.e., 2.21 and 4.42 t fed-1 (for
maintaining 50 and 100% G requirements). Nitrogen (N) sources were 90 kg N (N), 10 t
compost (C) and 7.5 t C + 45 kg N (CN) fed-1.
Table 3. Mean monthly of temperature, relative humidity, wind speed and pan evaporation as well as rainfall quantity in both seasons
Month Temperature (°C) Relative humidity (%) Wind speed (km day-1) Pan-evaporation (mm month-1) Rainfall (mm month-1) 2014-15 2015-16 2014-15 2015-16 2014-15 2015-16 2014-15 2015-16 2014-15 2015-16 November 19.05 19.41 74.15 75.60 67.3 70.3 277 319 24.60 52.40 December 15.99 14.03 76.05 77.90 46.03 57.9 172 250 5.70 25.00 January 12.63 12.38 74.60 74.05 70.80 69.2 271 252 52.55 43.21 February 13.35 15.97 74.75 69.05 72.91 58.8 290 252 38.80 - March 17.19 18.05 70.59 69.90 87.64 63.2 323 359 6.25 13.2 April 18.17 24.33 63.40 61.70 95.70 87.1 607 594 23.90 -
Experimental procedure and data collection
Seeds of wheat variety ‘Sids 13’ was seeded by hand in rows 12.5 cm a part at the
rate of 50 kg seeds fed-1, sown on 18 and 23 November in both years (2014 and 2015
seasons), respectively. While each lysimeter was included 8 rows. Phosphorus (P) and potassium (K) fertilizers were added according to the recommended doses of North Delta area of Egypt. For the source of N, fertilizer urea (46% N) was applied in two equal splits, before sowing irrigation and at the tillering stage. G and C were added before planting. The different agricultural practices were done as recommended. At harvest (158 and 154 days after sowing), the central of 6 rows were harvested and threshed to determine grain and straw yield. The weight of GY was adjusted to 14.5% moisture content.
Water measurements
Amount of irrigation water applied (WA) was measured by a portable pump equipped with a water meter for each lysimeter. Amount of irrigation water applied (WA) was determined according to Phocaides (2001) as follows:
DS BD 100 θ -FC WA = 1 (Eq.1)
where, WA: water applied (cm3); FC: soil moisture percentage at field capacity; Ө1: soil
moisture percentage before irrigation; BD: bulk density (g cm-3) and DS: soil layer
(cm).
Water consumptive use by growing plants was calculated based on soil moisture depletion (SMD) according to Israelsen and Hansen (1962):
(Eq.2)
where, Cu: water consumptive use (m3/fed.) in the effective root zone; Ө2: soil moisture
percentage after irrigation; Ө1: soil moisture percentage before next irrigation; Dbi: soil
bulk density (g cm-3); Di: soil layer depth (cm) and i: number of soil layer (1-4).
Soil moisture (%) was determined by drying the soil samples at 105 °C to constant weight and the moisture content was calculated according to Singh (1980).
Water productivity (WP) was calculated as the ratio of GY with the amount of irrigation water applied (PIW) and water consumptive use (PW) according to Ali et al. (2007) as follows: ) feddan / (m water Applied feddan) (kg/ Yield PIW = 3 (Eq.3) ) feddan / (m use ve consumpiti water feddan) (kg/ Yield PW = 3 (Eq.4) Statistical analysis
Data in the present study were arranged and all statistical analysis was subjected to analysis according to Gomez and Gomez (1984) by using “MSTATC” computer software package. Treatment means were compared by Duncan’s Multiple Range Test at 5% level of significance (Duncan, 1955).
Results and discussion
Seasonal water applied
Applied seasonal water (WA) consisted of two sources such as irrigation water delivered to lysimeter and effective rainfall. In both seasons, the total amounts of the
effective rainfall were recorded 446 and 393 m3 fed-1, respectively (Table 3). At the same
irrigation treatment, lysimeters of all combinations between gypsum rates and nitrogen sources were received an equal amount of irrigation during the growing season.
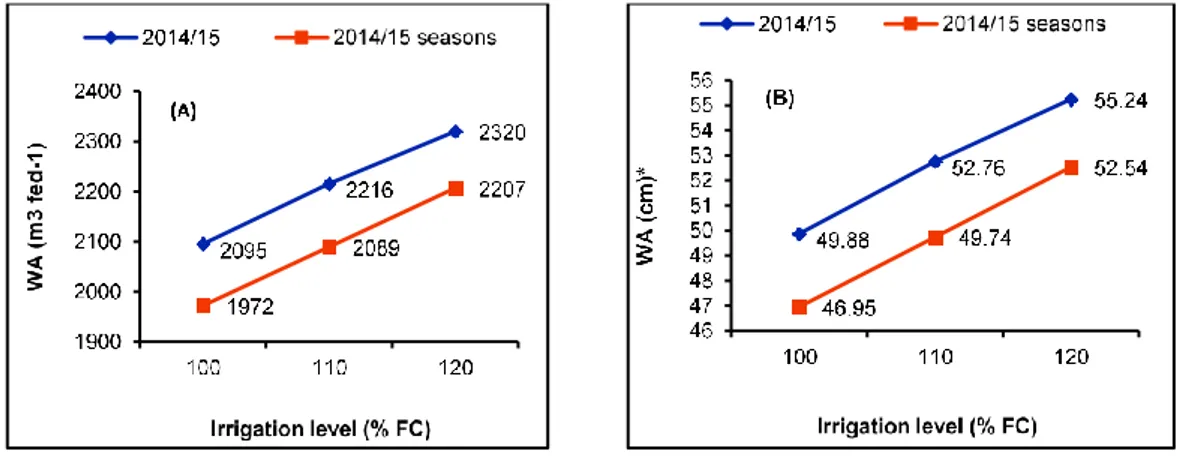
Figure 1 shows that the amounts of WA from sowing to harvesting of wheat were gradually increased by increasing the level of irrigation from 100 to 120% FC in both seasons. Wheat plants irrigated with the water amounts equal to 120% FC recorded the
highest values of WA 2320 and 2207 m3 fed-1 (55.24 and 52.54 cm) in the two seasons,
while the 100% FC recorded the lowest levels of WA i.e., 2095 and 1972 m3 fed-1 (49.88
and 46.95 cm) in both growing seasons, respectively. Such increased in the amount of WA by increasing irrigation level may be attributed to a considerable increase in vegetative growth and leaf area, which resulted in greater transpiration and in turn water requirement. These findings are in close harmony with the findings of Hossain et al. (2006), Sarker et al. (2007), Inamullah et al. (2011) and El-Agrodi et al. (2016).
Seasonal water consumptive use
Data in Table 4 show that the amount of water lost as evapotranspiration (seasonal water consumptive use, WCU) was increased by increasing irrigation level in the two
seasons. WCU was markedly increased by an increasing the amount of irrigation water from 100 to 120% FC in both seasons. The irrigation level of 120% FC recorded the highest values of WCU followed by 110 and 100% FC. As the soil moisture level increased the water consumptive use was increased due to more improved growth and perhaps luxury consumptive of water. Also, this may be due to an increase in leaching water by increasing the amount of water applied than field capacity.
** Fed=feddan= 4200 m2= 0.42 h
* 1 cm water = 42 m3
fed-1
Figure 1. WA in m3 fed-1 (A) and in cm (B) as affected by irrigation level in both seasons
Incorporation of gypsum in the soil at the rate of 4.42 t fed-1(100% of requirements)
resulted in the greater WCU than the rate of 2.21 t fed-1 (50% of requirements) in both
seasons. This may be due to more water applied for leaching the exchangeable sodium. Source of N had a substantial effect on WCU in both seasons. Whereas, application
of 7.5 t C + 45 kg N fed-1 (CN) exceeded the application of 90 kg N (N) or 10 t compost
fed-1 (C) alone in WCU in both seasons. Nitrogen sources were arranged in descending
order CN > N > C in this trait in both seasons. While, the application of C and chemical N fertilizer (urea), enhanced the availability of the nutrients in the soil solution. The available nutrients might have helped in enhancing leaf area, which thereby resulted in
higher transpiration and more water consumptive.
The interaction between irrigation levels and gypsum rate exerted a substantial effect on WCU. Data show that WCU was increased by increasing each of irrigation level and G rate alone or together in both seasons.
The highest values of WCU 1454 and 1587 m3 fed-1 were recorded by the irrigation
level of 120% FC along with 100% G requirements, while the lowest ones 1349 and
1391 m3 fed-1 were recorded by the irrigation level of 100% FC along with 50% G
requirements in both seasons. The integration between chemical nitrogen (45 kg N fed
-1) and C fertilizer (7.5 t compost fed-1) along with the irrigation level of 120% FC
consumed greater water than the irrigation level of 100% FC and 10 t C fed-1 in both
seasons (Table 4). The second order of interaction (irrigation level × G rate × nitrogen source) had a markedly effect on WCU (Table 4).
Increasing irrigation level and G rate increased WCU at the same nitrogen source.
However, application of both compost and chemical N (7.5 t C + 45 kg N fed-1),
resulted in a markedly increased in WCU, as compared with application 90 kg N or 10 t
received 120% FC WA, 100% G and 7.5 t C + 45 kg N fed-1 recorded the highest values
of WCU (1491 and 1603 m3 fed-1), while those received 100% FC WA, 50% G and
7.5 t C fed-1 recorded the lowest ones (1344 and 1394 m3 fed-1) in both seasons. Results
demonstrated that water consumptive use increased as soil moisture content was highly maintained by increasing amount of water applied due to increasing leaching requirements. Also, the higher frequent irrigation provides a chance for more water consumption, ultimately resulted in increasing plant transpiration and evaporation from the soil surface. These results are in great harmony with those obtained by Ali et al. (2007).
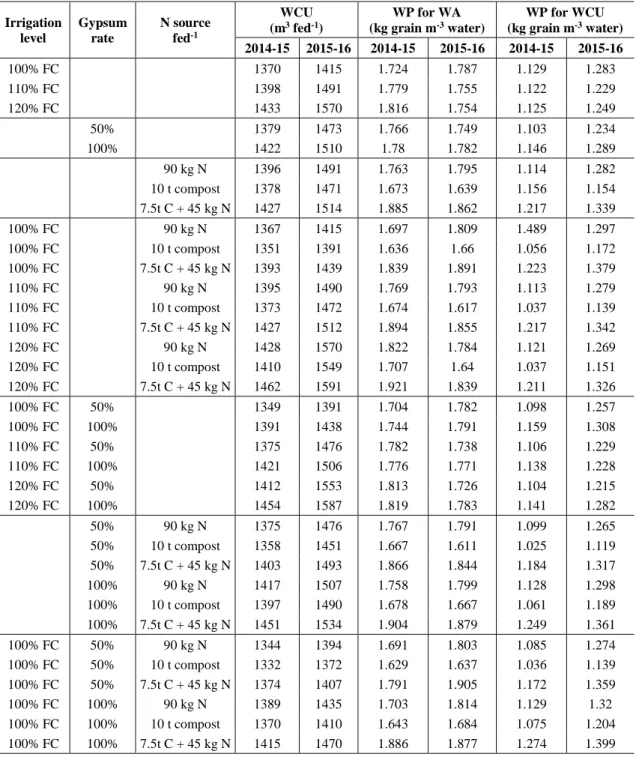
Table 4. Water consumptive use (WCU), WP for WA and WCU and GY of wheat as affected by levels of irrigation, the rate of gypsum and nitrogen source in both seasons
Irrigation level Gypsum rate N source fed-1 WCU (m3 fed-1) WP for WA (kg grain m-3 water) WP for WCU (kg grain m-3 water) 2014-15 2015-16 2014-15 2015-16 2014-15 2015-16 100% FC 1370 1415 1.724 1.787 1.129 1.283 110% FC 1398 1491 1.779 1.755 1.122 1.229 120% FC 1433 1570 1.816 1.754 1.125 1.249 50% 1379 1473 1.766 1.749 1.103 1.234 100% 1422 1510 1.78 1.782 1.146 1.289 90 kg N 1396 1491 1.763 1.795 1.114 1.282 10 t compost 1378 1471 1.673 1.639 1.156 1.154 7.5t C + 45 kg N 1427 1514 1.885 1.862 1.217 1.339 100% FC 90 kg N 1367 1415 1.697 1.809 1.489 1.297 100% FC 10 t compost 1351 1391 1.636 1.66 1.056 1.172 100% FC 7.5t C + 45 kg N 1393 1439 1.839 1.891 1.223 1.379 110% FC 90 kg N 1395 1490 1.769 1.793 1.113 1.279 110% FC 10 t compost 1373 1472 1.674 1.617 1.037 1.139 110% FC 7.5t C + 45 kg N 1427 1512 1.894 1.855 1.217 1.342 120% FC 90 kg N 1428 1570 1.822 1.784 1.121 1.269 120% FC 10 t compost 1410 1549 1.707 1.64 1.037 1.151 120% FC 7.5t C + 45 kg N 1462 1591 1.921 1.839 1.211 1.326 100% FC 50% 1349 1391 1.704 1.782 1.098 1.257 100% FC 100% 1391 1438 1.744 1.791 1.159 1.308 110% FC 50% 1375 1476 1.782 1.738 1.106 1.229 110% FC 100% 1421 1506 1.776 1.771 1.138 1.228 120% FC 50% 1412 1553 1.813 1.726 1.104 1.215 120% FC 100% 1454 1587 1.819 1.783 1.141 1.282 50% 90 kg N 1375 1476 1.767 1.791 1.099 1.265 50% 10 t compost 1358 1451 1.667 1.611 1.025 1.119 50% 7.5t C + 45 kg N 1403 1493 1.866 1.844 1.184 1.317 100% 90 kg N 1417 1507 1.758 1.799 1.128 1.298 100% 10 t compost 1397 1490 1.678 1.667 1.061 1.189 100% 7.5t C + 45 kg N 1451 1534 1.904 1.879 1.249 1.361 100% FC 50% 90 kg N 1344 1394 1.691 1.803 1.085 1.274 100% FC 50% 10 t compost 1332 1372 1.629 1.637 1.036 1.139 100% FC 50% 7.5t C + 45 kg N 1374 1407 1.791 1.905 1.172 1.359 100% FC 100% 90 kg N 1389 1435 1.703 1.814 1.129 1.32 100% FC 100% 10 t compost 1370 1410 1.643 1.684 1.075 1.204 100% FC 100% 7.5t C + 45 kg N 1415 1470 1.886 1.877 1.274 1.399
110% FC 50% 90 kg N 1369 1476 1.798 1.791 1.111 1.265 110% FC 50% 10 t compost 1351 1460 1.672 1.59 1.019 1.112 110% FC 50% 7.5t C + 45 kg N 1406 1492 1.876 1.834 1.189 1.309 110% FC 100% 90 kg N 1420 1504 1.739 1.795 1.115 1.292 110% FC 100% 10 t compost 1395 1483 1.676 1.643 1.055 1.167 110% FC 100% 7.5t C + 45 kg N 1448 1531 1.912 1.875 1.245 1.374 120% FC 50% 90 kg N 1412 1557 1.811 1.778 1.102 1.255 120% FC 50% 10 t compost 1392 1522 1.7 1.606 1.019 1.107 120% FC 50% 7.5t C + 45 kg N 1433 1579 1.93 1.793 1.192 1.283 120% FC 100% 90 kg N 1443 1582 1.832 1.79 1.139 1.283 120% FC 100% 10 t compost 1427 1576 1.714 1.674 1.054 1.195 120% FC 100% 7.5t C + 45 kg N 1491 1602 1.912 1.886 1.229 1.369
Generally, WCU values were greater in the second season than in the first season (Table 4). This may be due to increase temperature and decrease relative humidity at the most growing months in the second seasons, which increased evaporation and transpiration and in turn more water consumptive.
Water productivity
GY per unit of applied irrigation water (WA) or water consumptive use (WCU) in kg
grain m-3 water were used to determine water productivity. Data in Table 4 show that
WP (kg grain m-3 water) for either WA in both seasons or WCU in the second season
was decreased by increasing irrigation level from 100 to 120% FC. The inverse was true in WP for WCU in the first season. The WP for WA and WCU was increased by increasing the gypsum (G) rate in both seasons. Application of 7.5 t C along with 45 kg
N fed-1 recorded the highest values of WP for WA and WCU followed by 90 kg N and
10 t compost fed-1 alone in the two seasons. Incorporation of 100% G requirements and
integration of compost with chemical nitrogen resulted in an increase in WP for WA and WCU through increasing GY in both seasons.
The first and second order of interaction had a substantial effect on WP for WA and WCU in both seasons. The relative ranking of the interaction among irrigation level, G rate and nitrogen source in was WP for WA and WCU inconsistent in both seasons. The
interaction of 110% FC × 100% G × 7.5 t compost + 45 kg N fed-1 produced the highest
values of WP for WA (1.245 and 1.374 kg grain m-3 WA), while the interaction of
110% FC × 50% G × 10 t compost fed-1 produced the lowest values (1.019 and 1.112 kg
grain m-3 WA) in the two seasons. The interaction of 120% FC × 100% G × 7.5 t
compost + 45 kg N fed-1 produced the highest values of WP for WCU (1.922 and
1.886 kg grain m-3 WCU) in both seasons. However, the lowest value of WP for WCU
was 1.629 kg grain m-3 WCU recorded from the interaction of 100% FC × 50% G × 10 t
compost fed-1 in the first seasons, while the interaction of 110% FC × 50% G × 10 t
compost fed-1 recorded the lowest value 1.590 kg grain m-3 WCU in the second season.
Results of the present study could be attributed to the great differences between GY of wheat as well as differences between water applied and water consumed also confirmed by the findings of Ali et al. (2007), Liu et al. (2013), Ali (2016) and El-Shawy et al. (2017).
Grain yield
Grain yield fed-1 was significantly increased by increasing the level of irrigation from
100 to 120% FC in both seasons (Table 5). While no significant difference was recorded for GY due to the levels of irrigation water of 120 and 110% FC in both seasons. This may be due to the increase in growth and yield components. In this connection, adequate water not only allowed the wheat plant to increase photosynthetic rate but also give extra time to translocate the carbohydrates in grains, which enhanced grain size and ultimately causes higher GY. This trend in agreement with Ali et al. (2007), Liu et
al. (2013); Ali (2016) and Abdrabbo et al. (2016) and Rashwan et al. (2016). The high
rate of G (100%) out yielded the low rate (50%) in GY in both seasons. This trend could enhance with Abdel-Fattah (2012), and Hafez et al. (2015). The combination of compost and chemical nitrogen resulted in a significant increase in GY compared with each of the two sources alone in both seasons. Application of organic (compost) and chemical N fertilizer to wheat enhanced the availability of nutrients in the soil solution. The available nutrients might have helped in the stimulation of various physiological processes including cell division and cell elongation of internodes resulting in more tillers formation, leaf numbers and photosynthetic area (leaf area), which resulted in more photosynthetic production and consequently increased dry matter accumulation and GY. Similar results were reported by Ayadi et al. (2012), Yousef et al. (2014), Mehasen et al., 2015), Abd El-Lattief (2016) and Gharib et al. (2016).
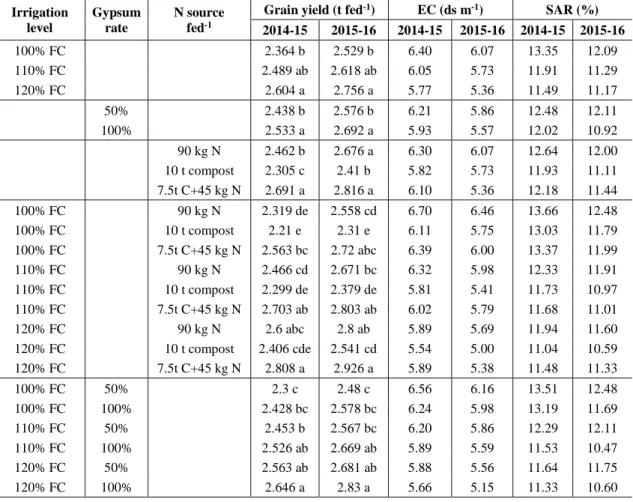
Table 5. Grain yield, soil salinity (EC) and sodium adsorption ratio (SAR) after wheat harvest as affected by irrigation level, gypsum rate and nitrogen source in both seasons
Irrigation level Gypsum rate N source fed-1
Grain yield (t fed-1) EC (ds m-1) SAR (%)
2014-15 2015-16 2014-15 2015-16 2014-15 2015-16 100% FC 2.364 b 2.529 b 6.40 6.07 13.35 12.09 110% FC 2.489 ab 2.618 ab 6.05 5.73 11.91 11.29 120% FC 2.604 a 2.756 a 5.77 5.36 11.49 11.17 50% 2.438 b 2.576 b 6.21 5.86 12.48 12.11 100% 2.533 a 2.692 a 5.93 5.57 12.02 10.92 90 kg N 2.462 b 2.676 a 6.30 6.07 12.64 12.00 10 t compost 2.305 c 2.41 b 5.82 5.73 11.93 11.11 7.5t C+45 kg N 2.691 a 2.816 a 6.10 5.36 12.18 11.44 100% FC 90 kg N 2.319 de 2.558 cd 6.70 6.46 13.66 12.48 100% FC 10 t compost 2.21 e 2.31 e 6.11 5.75 13.03 11.79 100% FC 7.5t C+45 kg N 2.563 bc 2.72 abc 6.39 6.00 13.37 11.99 110% FC 90 kg N 2.466 cd 2.671 bc 6.32 5.98 12.33 11.91 110% FC 10 t compost 2.299 de 2.379 de 5.81 5.41 11.73 10.97 110% FC 7.5t C+45 kg N 2.703 ab 2.803 ab 6.02 5.79 11.68 11.01 120% FC 90 kg N 2.6 abc 2.8 ab 5.89 5.69 11.94 11.60 120% FC 10 t compost 2.406 cde 2.541 cd 5.54 5.00 11.04 10.59 120% FC 7.5t C+45 kg N 2.808 a 2.926 a 5.89 5.38 11.48 11.33 100% FC 50% 2.3 c 2.48 c 6.56 6.16 13.51 12.48 100% FC 100% 2.428 bc 2.578 bc 6.24 5.98 13.19 11.69 110% FC 50% 2.453 b 2.567 bc 6.20 5.86 12.29 12.11 110% FC 100% 2.526 ab 2.669 ab 5.89 5.59 11.53 10.47 120% FC 50% 2.563 ab 2.681 ab 5.88 5.56 11.64 11.75 120% FC 100% 2.646 a 2.83 a 5.66 5.15 11.33 10.60
50% 90 kg N 2.431 cd 2.641 bc 6.41 6.16 12.89 12.52 50% 10 t compost 2.265 d 2.337 d 5.99 5.86 12.24 11.73 50% 7.5t C+45 kg N 2.62 ab 2.749 ab 6.23 5.56 12.32 12.09 100% 90 kg N 2.493 bc 2.711 ab 6.19 5.98 12.40 11.47 100% 10 t compost 2.345 cd 2.483 cd 5.64 5.59 11.62 10.50 100% 7.5t C+45 kg N 2.763 a 2.883 a 5.96 5.15 12.04 10.80 100% FC 50% 90 kg N 2.273 de 2.513b-f 6.82 6.58 13.68 12.93 100% FC 50% 10 t compost 2.17 e 2.246 f 6.29 5.78 13.23 12.08 100% FC 50% 7.5t C+45 kg N 2.456 b-e 2.681a-d 6.56 6.11 13.52 12.45 100% FC 100% 90 kg N 2.365 cde 2.603b-e 6.57 6.33 13.53 12.03 100% FC 100% 10 t compost 2.251 de 2.374 def 5.92 5.72 12.83 11.52 100% FC 100% 7.5t C+45 kg N 2.669 abc 2.759abc 6.22 5.89 13.22 11.53 110% FC 50% 90 kg N 2.462 b-e 2.643b-e 6.52 6.11 12.86 12.66 110% FC 50% 10 t compost 2.259 de 2.322ef 5.96 5.49 12.21 11.77 110% FC 50% 7.5t C+45 kg N 2.637 abc 2.736abc 6.12 5.98 11.80 11.91 110% FC 100% 90 kg N 2.47 b-e 2.699 a-d 6.12 5.85 11.80 11.15 110% FC 100% 10 t compost 2.338 cde 2.437 c-f 5.65 5.32 11.24 10.16 110% FC 100% 7.5t C+45 kg N 2.769 ab 2.871 ab 5.91 5.59 11.59 10.11 120% FC 50% 90 kg N 2.557 a-d 2.769 abc 5.90 5.78 12.02 11.98 120% FC 50% 10 t compost 2.366 cde 2.444 c-f 5.73 5.22 11.28 11.36 120% FC 50% 7.5t C+45 kg N 2.765 ab 2.831 ab 6.02 5.68 11.63 11.90 120% FC 100% 90 kg N 2.643 abc 2.831 ab 5.89 5.60 11.86 11.22 120% FC 100% 10 t compost 2.446 b-e 2.638 b-e 5.34 4.78 10.80 9.82 120% FC 100% 7.5t C+45 kg N 2.851 a 3.021 a 5.75 5.07 11.33 10.76
Means of each factor in grain yield columns designated by the same latter are not significantly different at 5% level using DMRT
All the first and second order interactions had a significant effect on GY in both seasons. Increasing irrigation level and G rate along with compost and nitrogen together substantially increased GY. Application of 100% G and 7.5 t compost + 45 kg N fed-1 at any irrigation
level were among those treatments having high GY, being insignificant, in both seasons. These results go with those reported by Attia et al. (2013), Abdel-Fattah, 2012), Hafez et al. (2015) and Gharib et al. (2016).
Salinity and sodicity
Salinity (ECe) and sodicity (SARe) of the soil after harvesting as affected by irrigation level, G rate, nitrogen source and their interactions under wheat crop are shown in Table 5.
The initial value of ECe before the experiment was 7.10 dS m-1 (Table 1). Data show that the
values of salinity and sodicity were decreased after harvesting compared with those before the beginning of experiment at any studied treatment in both seasons. Increasing irrigation level, G rate and compost alone resulted in a substantially decrease salinity and sodicity of soil after harvesting. Data show that application N fertilizer alone or with compost increased these traits compared with compost alone at any combination between irrigation and G in both seasons.
The lowest values of ECe (5.34 and 4.78 dS m-1) and SARe (10.80 and 9.82%) were obtained
from the irrigation level of 120% FC, 100% G and 7.5 t compost fed-1 in both seasons.
Application of 10 t compost alone with 100% G reduced Ec greater than 16% at any irrigation level in both seasons (Figs. 2 and 3). The highest values of reduction percentage
24.8 and 32.7% were recorded by the interaction of 120% FC × 100% G × 10 t compost fed-1
properties and the present investigations have addressed the combined effect of compost and G on the sodic soils under semi-arid conditions. The effect of G application on saline-sodic soil reclamation have shown that the soil receiving G at higher rate since it removes the
greatest amount of Na+ from the soil columns and causes a substantial decrease in soil
electrical conductivity (EC) and sodium adsorption ratio (SAR) (Hamza and Andrrson, 2003; Rasouli et al., 2013).
Application of 10 t compost alone with 100% gypsum reduced SAR greater than 18% at irrigation levels of 110 and 120% FC in both seasons (Figs. 2 and 3). The highest values of reduction percentage 21.2 and 28.4% were recorded by the interaction of 120% FC × 100%
gypsum × 10 t compost fed-1 in the two seasons.
Figure 2. The percent reduction of EC after harvest based on its initial value (7.10) as affected by the interaction of irrigation level, gypsum rate and nitrogen source in both seasons
Figure 3. The percent reduction of SAR after harvest based on its initial value (13.71) as affected by the interaction of irrigation level, gypsum rate and nitrogen source in both seasons
Conclusion
In summary, it can be concluded that irrigation with water amount equal to 110 or
120% FC, 100% G requirements and 7.5 t C and 45 kg N fed-1 was the best treatment
for getting high GY, improve the soil chemical properties, nutrients availability and increase water productivity of salt-affected soil in North Delta of Egypt.
Disclaimer. We hereby declare that the manuscript contains no material which has been accepted for the
award of any degree or diploma in any university and that, to the best of our knowledge and belief, the review contains no copy of any material previously published or written by another person except where due reference is made in the text.
REFERENCES
[1] Abd El-Lattief, E. A. (2014): Effect of integrated use of farmyard manure (FYM) and chemical fertilizers (NPK) on productivity of bread wheat under arid conditions. – International Journal of Advanced Research in Engineering and Applied Sciences 3(12): 22-27.
[2] Abdel-Fattah, M. K. (2012): Role of gypsum and compost in reclaiming saline sodic soils. – IOSR Journal of Agriculture and Veterinary Science 1(3): 30-38.
[3] Abdelaal, A. A. K., Omara, I. R., Hafez, M. Y., Samar, M. E., EL Sabagh, A. (2018): Anatomical, biochemical and physiological changes in some Egyptian wheat cultivars inoculated with Puccinia graminis F. sp. Tritici. – Fresenius Environmental Bulletin 27(1): 296-305.
[4] Abdrabbo, M. A. A., Hashem, F. A., Abou-Hadid, A. F. (2016): Irrigation requirements for some bread wheat cultivars. – Journal of Agricultural Science and Research 3(1): 23-40.
[5] Ali, F. T. (2016): The effect of different deficit irrigation strategies on yield, quality, and water-use efficiencies of wheat under semi-arid conditions. – Agricultural Water Management 167: 1-10.
[6] Ali, M. H., Hoque, M. R., Hassan, A. A., Khair, A. (2007): Effect of deficit irrigation on yield water productivity and economic returns of wheat. – Agricultural Water Management 92(3): 151-161.
[7] Al-Naggar, A. M. M., Sabry, S. R. S., Atta, M. M. M., El-Aleem, O. M. A. (2015a): Effects of salinity on performance, heritability, selection gain and correlations in wheat (Triticum aestivum L.) doubled haploids. – Scientia Agriculturae 10(2): 70-83.
[8] Al-Naggar, A. M. M., Sabry, S. R. S., Atta, M. M. M., El-Aleem, O. M. A. (2015b): Field screening of wheat (Triticum aestivum L.) genotypes for salinity tolerance at three locations in Egypt. – Journal of Agriculture and Ecology Research International 4(3): 88-104.
[9] Attia, A. N. E., Seadh, S. E., Sharshar, M. S. E., Genedy, M. S. (2013): Comparative studies on number of irrigations, planting methods and nitrogen levels for wheat in north Delta soils. – Journal of Plant Production, Mansoura University 4(7): 1139-1148.
[10] Ayadi, S., Karmous, C., Hammami, Z., Tamani, N., Trifa, Y., Esposito, S., Rezgui, S. (2012): Genetic variability of nitrogen use efficiency components in Tunisian improved genotypes and landraces of durum wheat. – Agriculture Science Research Journal 2(11): 591-601.
[11] Barutcular, C., EL Sabagh, A., Koç, M., Ratnasekera, D. (2017): Relationships between grain yield and physiological traits of durum wheat varieties under drought and high temperature stress in Mediterranean conditions. – Fresenius Environmental Bulletin 26(6): 4282-4291.
[12] Chen, H., Jiang, J. G. (2010): Osmotic adjustment and plant adaptation to environmental changes related to drought and salinity. – Environmental Reviews 18: 309-319.
[13] Campbell, D. J. (1994): Determination and Use of Bulk Density in Relation to Soil compaction. – In: Ouwerkerk, C. van, Soane, B. D. (eds). Soil Compaction in Crop Production. Elsevier, London.
[14] Cottenie, A., Verloo, M., Velghe, G., Kiekon, L. (1982): Biological and Analytical Aspects of Soil Pollution. – Lab. of Analytical Agro. State Univ., Gent.
[16] Edwards, S., Hailu, A. (2011): How to Make Compost and Use. – In: Ching, L. L., Edwards, S., Scialabba, N. E. (eds.) Climate Change and Food Systems Resilience in Sub-Saharan Africa. FAO, Italy, pp. 379-436.
[17] Egypt Today (2018): Egypt’s wheat production to increase 4.3% YoY in 2018/19: FAS. –
Sunday May 13, 2018.
https://www.egypttoday.com/Article/3/49959/Egypt%E2%80%99s-wheat-production-to-increase-4-3-YoY-in-2018.
[18] El-Agrodi, M. W. M., Saied, M. M., Ahmed, G. L., Khalifa, T. S. H. (2016): Effect of soil moisture depletion and nitrogen levels on wheat (Triticum aestivum, L.). – Journal of Soil Science and Agricultural Engineering, Mansoura University 7(2): 169-178.
[19] El-Hendawy, S. E., Hu, Y., Yakout, G. M., Awad, A. M., Hafiz, S. E., Schmidhalter, U. (2005): Evaluating salt tolerance of wheat genotypes using multiple parameters. – European Journal of Agronomy 22: 243-253.
[20] El-Shawy, E.E., El Sabagh, A., Mansour, M., Barutcular, C. (2017): A comparative study for drought tolerance and yield stability in different genotypes of barley (Hordeum
vulgare L.). – Journal of Experimental Biology and Agricultural Sciences 5(2):151-162.
[21] Gharib, H., Hafez, E., EL Sabagh, A. (2016): Optimized potential of utilization efficiency and productivity in wheat by integrated chemical nitrogen fertilization and simulative compounds. – Cercetari Agronomice in Moldova 2(166): 5-20.
[22] Gomez, K. A., Gomez, K. A. (1984): Statistical Procedures for Agricultural Research. 1st
Ed. – John Wiley and Sons, New York.
[23] Hafez, E. M., Abou Khadrah, A., Sorour, S. Gh. R., Yousef, A. R. (2015): Comparison of agronomical and physiological nitrogen use efficiency in three cultivars of wheat as affected by different levels of N-sources. – Proc. 13th International Conf. Agron., Fac. of
Agric., Benha Univ., Egypt, 9-10 September, pp. 130-145.
[24] Halitligil, M. B., Akın, A., Bilgin, N., Deniz, Y., Öğretir, K., Altınel, B., Işık, Y. (2000): Effect of nitrogen fertilization on yield and nitrogen and water use efficiencies of winter wheat (durum and bread) varieties grown under conditions found in Central Anatolia. – Biology and Fertility of Soils 31(2): 175-182.
[25] Hamza, M. A., Anderson, W. K. (2003): Responses of soil properties and grain yields to deep ripping and gypsum application in a compacted loamy sand soil contrasted with a sandy clay loam soil in Western Australia. – Australian Journal of Agricultural Research 54: 273-282.
[26] Hanay, A., Buyuksonmez, F., Kiziloglu, F. M., Canbolat, M. Y. (2004): Reclamation of saline-sodic soils with gypsum and MSW compost. – Compost Science & Utilization 12: 175-179.
[27] Hesse, P. R. (1971): A Text Book of Soil Chemical Analysis. – John Murray Ltd., London.
[28] Hossain, M. A., Rashid, M. H., Rahman, M. S., Biswas, S. K. (2006): Interaction of irrigation levels and fertilizer doses on wheat production in Bangladesh. – Bangladesh Journal of Agricultural Engineering 17(1-2): 1-8.
[29] Hossain, M. M., Hossain, A., Alam, M. A., EL Sabagh, A., Khandakar Faisal Ibn Murad, Haque, M. M., Muriruzzaman, M., Islam, M. Z., Das, S., Barutcular, C., Kizilgeci, F. (2018): Evaluation of fifty spring wheat genotypes grown under heat stress condition in multiple environments of Bangladesh. – Fresen. Environ. Bull. 27: 5993-6004.
[30] Inamullah, A., Farhan U. K., Iftikhar, H. K. (2011): Environmental effect on wheat phenology and yields. – Sarhad Journal of Agriculture 27(3): 395-402.
[31] Index Mundi (2018): Egypt wheat production by year. –
https://www.indexmundi.com/agriculture/?country=eg&commodity=wheat&graph=prod uction.
[32] Islam, M. S., Akhter, M. M., El Sabagh, A., Liu, L. Y., Nguyen, N. T., Ueda, A., Masaoka. Y., Saneoka, H. (2011): Comparative studies on growth and physiological
responses to saline and alkaline stresses of Foxtail millet ('Setaria italica'L.) and Proso millet (Panicum miliaceum L.). – Australian Journal of Crop Science 5(10): 1269 -1277 [33] Israelsen, D. W., Hansen, V. E. (1962): Flow of Water into and through Soil Irrigation
Principles and Practices. 3rd Ed. – John Wiley and Sons Inc., New York.
[34] Jahan, M. A. H. S., Hossain, A., Jaime, A., Da Silva, T., EL Sabagh, A., Rashid, M. H., Barutçular, C. (2019): Effect of naphthaleneacetic acid on root and plant growth and yield of ten irrigated wheat genotypes. – Pakistan Journal of Botany 51(2): 451-459.
[35] Jackson, M. L. (1967): Soil Chemical Analysis. – Prentice Hall, New Delhi.
[36] Liu, X., Shao, L., Sun, H., Chen, S., Zhang, X. (2013): Responses of yield and water use efficiency to irrigation amount decided by pan evaporation for winter wheat. – Agricultural Water Management 129: 173-180.
[37] McGill, J., Prikhodko, D., Sterk, B., Talks, P. (2015): Egypt: Wheat Sector Review. – FAO Investment Centre. Country Highlights (FAO) Eng No. 21. http://www.fao.org/3/a-i4898e.pdf.
[38] Mehasen, S. A. S., Badawy, S. A., Abdullah S. S. (2015): Influence of bio and mineral nitrogen fertilizers on productivity of some bread wheat varieties. – Journal of Food Agriculture and Environment 13(2): 162-167.
[39] Musick, J. T., Jones, G. R., Stewart, B. A., Dusek, D. A. (1994): Water-yield relationships for irrigated and dry land wheat in the US southern plains. – Agronomy Journal 86: 980-986.
[40] Olsen, S. R., Cale, C. V., Watenable, F. S., Deann, L. A. (1954): Estimation of Available Phosphorus in Soil by Extraction with Sodium Bicarbonate. – US Dept. of Agric., Washington, DC.
[41] Out, H., Celiktas, V., Duzenli, S., Hossain, A., El Sabagh, A. (2018): Germination and early seedling growth of five durum wheat cultivars (Triticum durum desf.) is affected by different levels of salinity. – Fresenius Environmental Bulletin 27(11): 7746-7757. [42] Page, A. L. (ed.) (1982): Methods of Soil Analysis. Part 2: Chemical and Microbiological
Properties. 2nd Ed. – American Society of Agronomy, Inc. Soil Sci. Soc. of Am. Inc.,
Madison, WI.
[43] Phocaides, A. (2001): Handbook on Pressurized Irrigation Techniques. – Food and Agriculture Organization of the United Nations, Rome.
[44] Piper, C. S. (1950): Soil and Plant Analysis. – Inter Science Publication, New York. [45] Rashwan, E., Mousa, A., El-Sabagh, A., Barutçular, C. (2016):Yield and quality traits of
some flax cultivars as influenced by different irrigation intervals. – Journal of Agricultural Science 8 (10): 226-240.
[46] Rasouli, F., Poya, A. K., Karimian, N. (2013): Wheat yield and physicohemical properties of a sodic soil from semi-arid area of Iran as affected by applied gypsum. – Geoderma 193-194: 246-225.
[47] Sarker, K. K., Sarker, A. Z., Malaker, P. K., Roy, K. C., Islam, D. (2007): Comparative study on water requirement and economic return of wheat and boro rice. – Journal of Bangladesh Society for Agricultural Science and Technology 4(3&4): 45-48.
[48] Schoonover, W. R. (1952): Examination of Soils for Alkali. – University of California Extension Service, Berkeley, CA.
[49] Shaaban, S. M. (2006): Effect of organic and inorganic nitrogen fertilizer on wheat plant under water regime. – Journal of Applied Sciences Research 2: 650-656.
[50] Singh, R. A. (1980): Soil Physical Analysis. – Kalyans, New Delhi, pp. 81-82.
[51] Wiendenfeld, R. P. (2000): Water stress during different sugarcane growth periods on yield and response to N fertilization. – Agricultural Water Management 43(2): 173-182. [52] Yassin, M., Mekawy, A. M., EL Sabagh, A., Islam, M. S., Hossain, A., Barutcular, C.,
Alharby, H., Bamagoos, A., Liu, L., Ueda, A., Saneoka, H. (2019): Physiological and biochemical responses of two bread wheat (Triticum aestivum L.) genotypes grown under salinity stress. – Applied Ecology and Environmental Research 17(2): 5029-5041.
[53] Yildirim, M., Barutçular, C., Hossain, A., Koç, M., Dizlek, H., Akinci, C., Toptaş, I., Basdemir, F., Islam, M. S., EL Sabagh, A. (2018): Assessment of The Grain Quality of Wheat Genotypes Grown Under Multiple Environments Using GGE Biplot Analysis. – Fresenius Environmental Bulletin 27(7): 4830-4837.
[54] Yousaf, M., Fahad, S., Shah, A. N., Shaaban, M., Khan, M. J., Sabiel, S. A. I., Ali, S. A. I., Wang, Y., Osman, K. A. (2014): The effect of nitrogen application rates and timing of first irrigation on wheat growth and yield. – International Journal of Agricultural Innovation and Research 2(4): 645-653.