Turkish Journal of Field Crops, 2012, 17(1): 46-50
FORAGE YIELD AND QUALITY OF GELEMEN CLOVER
(Trifolium meneghinianum Clem.) LINES
Tamer YAVUZ1 Mustafa SURMEN2 Sebahattin ALBAYRAK3* Necda CANKAYA4 1Ahi Evran University, Faculty of Agriculture, Department of Field Crops, Kırşehir, TURKEY
2Iğdır University, Faculty of Agriculture, Department of Field Crops, Iğdır, TURKEY 3Süleyman Demirel University, Faculty of Agriculture, Department of Field Crops, Isparta, TURKEY
4
Black Sea Agricultural Research Institute, Samsun, TURKEY *Corresponding author: [email protected]
Received: 06.04.2012
ABSTRACT
The aim of this research was to determine the forage yields and qualities of Gelemen clover (Trifolium
meneghinianum Clem.) lines. The experiment design was randomized block design with three replications. In
the research, significant differences were determined among dry matter yields (675-1157kg/da), crude protein contents (15.69-18.56%), crude protein yields (112.16-206.97 kg/da), contents of acid detergent fiber (30.48-34.32%), neutral detergent fiber (38.36-43.33%), total digestible nutrient (57.05-62.00%), phosphorus (0.38-0.43%), potassium (1.91-2.61%), calcium (1.39-1.61%) and magnesium (0.33-0.39%) as well as relative feed values (134-158%). According to results it was decided that 1, 3, 4 and 6 numbered Gelemen clover lines were selected to test in region yield experiments.
Key words: Trifolium meneghinianum, gelemen clover, dry matter yield, crude protein
INTRODUCTION
Trifolium nigrescens Viv is an annual, non-stoloniferous clover, native to Turkey, Iraq, Iran, Armenia, Cyprus, the Caucasus region, and the Mediterranean countries of Europe and North Africa (Zohary and Heller 1984; Gillet 1985). T. nigrescens is divided taxonomically into two sub-species on the basis of ovary shape and numbers of ovules per ovary. T. nigrescens subsp. nigrescens has ovaries with (3)-4-5(-6) ovules with shallow constrictions between the seeds, while subsp. petrisavii (Clem.) Holmboe has two ovules per ovary and a deep constriction between the seeds. T. nigrescens subsp. petrisavii has been further divided into two varieties on the basis of plant size and morphology, var. petrisavii having short, slender stems and small leaves and var. meneghinianum (Clem.) having long, thick, hollow stems and large leaves (Williams et al. 2001).
In present study, Gelemen clover (Trifolium meneghinianum Clem.) seeds were collected from Black Sea Coastal Region in 2002. Then, 12 lines were obtained using half sib family selection breeding method. Yield experiment was established in 2009. The aim of the present research was to determine forage yield and quality of Gelemen clover lines.
MATERIALS AND METHODS
Gelemen clover (Trifolium meneghinianum Clem.) seeds were collected from Black Sea Coastal Region in 2002. Same year, collected seeds were sown and the plants were observed in terms of growing status. In 2003,
the plants were selected according to flowering time, status of erect or sloping and leaf size and width. In 2004, quintet groups were constituted for using half sib family selection breeding method. Total 12 groups were constituted. They were closed by cloth in flowering stage due to the cross pollination. This proceeding was applied in four years. After the Gelemen clover seeds were increased, yield experiment was established in 2009. Total 12 lines and 2 standard populations were used as experimental material.
Field studies were conducted at Black Sea Agricultural Research Institute (15 km east of Samsun, Turkey) in an area of the Çarşamba plain (elevation 4 m). The experiments were carried out during two growing seasons (2009-2010 and 2010-2011) on clay-loam soil. Soil pH was 6.9; organic matter 1.98 g kg-1;available P, 21 g kg-1; available K, 94 g kg-1. The total rainfall and mean temperature for November through June was 755 mm and 13.0 °C in 2009-2010 and 785 mm and 11.6 °C in 2010-2011. The 30-yr average values of precipitation and temperature for the same period was 562 mm and 11.8°C.
Plots were established on November in 2009 and 2010. Each plot consisted of 6 rows, each 4 m in length. The row spacing was 20 cm. The seeding rate was 1 kg/da. The plots were harvested on 28 May and 26 June of 2010 and on 21 May and 19 June of 2011 at 50% flowering stage. Harvest area was 2.4 m² each plots. Samples were collected following the harvest, dried at 70°C for 48 h and weighed. The dried samples were reassembled and ground to pass through a 1-mm screen. The crude protein content was calculated by multiplying the Kjeldahl nitrogen
Figure 1. Breeding plots of gelemen clover
concentration by 6.25 (Kacar and İnal 2008). The ADF (acid detergent fiber) and NDF (neutral detergent fiber) concentrations were measured according to Ankom Technology. The total digestible nutrient (TDN) content and the relative feed value (RFV) were estimated according to the following equations adapted from Albayrak et al. (2011):
TDN content= (-1.291 x ADF) + 101.35 RFV = (120)/NDF) x ((88.9 - (0.779 x ADF)) x
(0.775)).
The experiment was conducted in a randomized complete block design, with 3 replications. The statistical analysis of the yield and quality data was performed using the General Linear Model procedure of SAS (SAS Inst. 1998). The means were compared using the DUNCAN test at the 0.05 probability level (Steel et al., 1997).
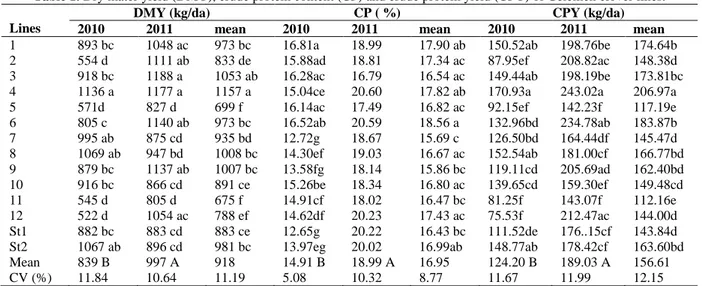
RESULTS AND DISCUSSION Dry matter yield, crude protein content and yield Year, lines and year x lines interactions on dry matter yield (DMY) content were significant (Table 1). In the first year, the highest DMY were obtained from lines 4, 8, St2 and 7 (995-1136 kg/da), in the second year, lines 3, 4, 6, 9, 2, 12 and 1 had the highest DMY (1048-1188 kg/da). Average of two years, the highest DMY were determined on line 4 (1157 kg/da) and line 3 (1053 kg/da). Albayrak et al (2006) found that Gelemen clover gave 520 kg/da dry matter yield. There were a few researches about Gelemen clover DMY. In Gelemen clover, the dry matter yield varied from 210 to 550 kg/da (Hertzch, at al. 1974). Morgner et al. (1978) obtained 400 kg/da DM yields in Gelemen clover. These Gelemen clover yields were lower than our findings.
Table 1. Dry mater yield (DMY), crude protein content (CP) and crude protein yield (CPY) of Gelemen clover lines.
Lines
DMY (kg/da) CP ( %) CPY (kg/da) 2010 2011 mean 2010 2011 mean 2010 2011 mean
1 893 bc 1048 ac 973 bc 16.81a 18.99 17.90 ab 150.52ab 198.76be 174.64b
2 554 d 1111 ab 833 de 15.88ad 18.81 17.34 ac 87.95ef 208.82ac 148.38d
3 918 bc 1188 a 1053 ab 16.28ac 16.79 16.54 ac 149.44ab 198.19be 173.81bc
4 1136 a 1177 a 1157 a 15.04ce 20.60 17.82 ab 170.93a 243.02a 206.97a
5 571d 827 d 699 f 16.14ac 17.49 16.82 ac 92.15ef 142.23f 117.19e
6 805 c 1140 ab 973 bc 16.52ab 20.59 18.56 a 132.96bd 234.78ab 183.87b 7 995 ab 875 cd 935 bd 12.72g 18.67 15.69 c 126.50bd 164.44df 145.47d 8 1069 ab 947 bd 1008 bc 14.30ef 19.03 16.67 ac 152.54ab 181.00cf 166.77bd 9 879 bc 1137 ab 1007 bc 13.58fg 18.14 15.86 bc 119.11cd 205.69ad 162.40bd 10 916 bc 866 cd 891 ce 15.26be 18.34 16.80 ac 139.65cd 159.30ef 149.48cd 11 545 d 805 d 675 f 14.91cf 18.02 16.47 bc 81.25f 143.07f 112.16e 12 522 d 1054 ac 788 ef 14.62df 20.23 17.43 ac 75.53f 212.47ac 144.00d St1 882 bc 883 cd 883 ce 12.65g 20.22 16.43 bc 111.52de 176..15cf 143.84d
St2 1067 ab 896 cd 981 bc 13.97eg 20.02 16.99ab 148.77ab 178.42cf 163.60bd
Mean 839 B 997 A 918 14.91 B 18.99 A 16.95 124.20 B 189.03 A 156.61
CV (%) 11.84 10.64 11.19 5.08 10.32 8.77 11.67 11.99 12.15
Means followed by the same letter in a column are not significantly different at p= 0.05 level.
Year, lines and year x lines interactions on crude protein content (CP) were significant (Table 1). The highest CP content was obtained from lines 1, 6, 3, 5 and 2 (15.88-16.81%) in the first year, while there were no statistically differences in Gelemen clover lines for CP content in the second year. Average of two years, Gelemen clover CP contents varied from between 15.69 and 18.56%. Some researchers indicated that Gelemen clover had 16.23-20.80% CP content (Hertzch, at al. 1974; Acar et al. 2001; Albayrak et al. 2006), findings that are similar to our results.
Year, lines and year x lines interactions on crude protein yield (CPY) were significant (Table 1). In the first year, the highest CPY were determined on lines 4, 8, 1, 3 and St2 (148.77-170.93 kg/da), in the second year, lines 4, 6, 12, 2, 9 and 1 had the highest CPY (205.69-243.02 kg/da). Average of two years, the highest CPY was obtained from on line 4 (206.97 kg/da).
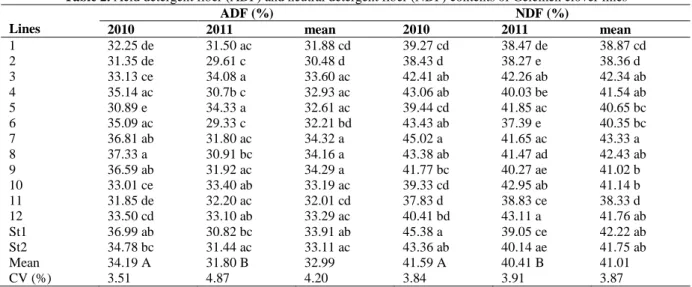
ADF, NDF contents and TDN, RFV values
Year, lines and year x lines interactions on ADF content were significant (Table 2). The lowest ADF content was obtained from lines 1, 11, 2 and 5
(30.89-32.25%) in the first year, while the lowest ADF content was determined on line 8, st1, st2, 2 and 6 (29.33-30.98%) in the second year. Average of two years, Gelemen clover ADF contents varied from between 30.48 and 34.32%.
Year, lines and year x lines interactions on NDF content were significant (Table 2). The lowest NDF content was exhibited lines 1, 2 and 11 (37.83-39.27%) in the first year, while the lowest NDF content was determined on line 1, 2 and 6 (37.40-38.47%) in the
second. Average of two years, line 1, 2 and 11 had the lowest NDF content (35.33 between 35.88%).
ADF and NDF contents were white clover (36.9-55.4%) and red clover (41.9-58.5) (Stewart et al.2008); berseem clover (22.0-32.0) (Karslı et al.1999); crimson clover (25.8-43.7) (Ladyman et al.2003). ADF and NDF contents of Gelemen clover were similar to other clovers.
Table 2. Acid detergent fiber (ADF) and neutral detergent fiber (NDF) contents of Gelemen clover lines
Lines ADF (%) NDF (%) 2010 2011 mean 2010 2011 mean 1 32.25 de 31.50 ac 31.88 cd 39.27 cd 38.47 de 38.87 cd 2 31.35 de 29.61 c 30.48 d 38.43 d 38.27 e 38.36 d 3 33.13 ce 34.08 a 33.60 ac 42.41 ab 42.26 ab 42.34 ab 4 35.14 ac 30.7b c 32.93 ac 43.06 ab 40.03 be 41.54 ab 5 30.89 e 34.33 a 32.61 ac 39.44 cd 41.85 ac 40.65 bc 6 35.09 ac 29.33 c 32.21 bd 43.43 ab 37.39 e 40.35 bc 7 36.81 ab 31.80 ac 34.32 a 45.02 a 41.65 ac 43.33 a 8 37.33 a 30.91 bc 34.16 a 43.38 ab 41.47 ad 42.43 ab 9 36.59 ab 31.92 ac 34.29 a 41.77 bc 40.27 ae 41.02 b 10 33.01 ce 33.40 ab 33.19 ac 39.33 cd 42.95 ab 41.14 b 11 31.85 de 32.20 ac 32.01 cd 37.83 d 38.83 ce 38.33 d 12 33.50 cd 33.10 ab 33.29 ac 40.41 bd 43.11 a 41.76 ab St1 36.99 ab 30.82 bc 33.91 ab 45.38 a 39.05 ce 42.22 ab St2 34.78 bc 31.44 ac 33.11 ac 43.36 ab 40.14 ae 41.75 ab Mean 34.19 A 31.80 B 32.99 41.59 A 40.41 B 41.01 CV (%) 3.51 4.87 4.20 3.84 3.91 3.87
Means followed by the same letter in a column are not significantly different at p= 0.05 level.
Year, lines and year x lines interactions on TDN content were significant (Table 3). The highest TDN contents was obtained from lines 5, 2, 1, 11, 3 and 10 (59.53-61.57%) in the first year whereas all lines had same statistical group for TDN values except line 10, 5 and 3 in the second year. Average of two years, the highest TDN content was obtained from line 2, 1, 11 and 6
(62.00 between 59.77%). The TDN refers to the nutrients that are available for livestock and are related to the ADF concentration of the forage. As ADF increases there is a decline in TDN which means that animals are not able to utilize the nutrients that are present in the forage (Aydın et al. 2010).
Table 3. Total digestible nutrient (TDN) and relative feed value (RFV) of Gelemen clover lines
Lines TDN (%) RFV (%) 2010 2011 mean 2010 2011 mean 1 61.02 ab 62.91 ac 60.20 ab 151 ab 156 ac 154 ac 2 61.09 ab 64.14 ab 62.00 a 156 a 160 ab 158 a 3 60.07 ac 59.72 c 57.97 bd 138 bd 137 f 138 ef 4 57.87 ce 64.46 ab 58.84 bd 133 cd 151 bd 142 df 5 61.57 a 59.97 c 59.25 bd 153 a 138 ef 146 ce 6 58.83 bd 65.45 a 59.77 ac 132 cd 164 a 148 bd 7 55.25 f 62.48 ac 57.05 d 124 d 143 df 134 f 8 55.86 ef 63.30 ac 57.26 d 128 d 145 cf 137 ef 9 55.94 ef 62.03 ac 57.08 d 134 cd 148 bf 141 df 10 59.53 ad 61.18 bc 58.51 bd 149 ab 136 f 143 df 11 60.14 ac 61.83 ac 60.03 ab 158 a 153 ad 156 ab 12 58.78 bd 62.55 ac 58.37 bd 146 ac 136 f 141 df St1 55.08 f 64.14 ab 57.57 cd 123 d 155 ad 139 df St2 57.47 df 63.60 ac 58.61 bd 133 cd 149 be 142 df Mean 57.21 B 60.29 A 58.75 140 B 148 A 144 CV (%) 2.25 3.18 3.05 5.60 4.42 5.01
Means followed by the same letter in a column are not significantly different at p= 0.05 level .
Uzun (2010) stated that forages with an RFV value over 151, 150-125, 124-103, 102-87, 86-75, and less than 75 are categorized as prime, premium, good, fair, poor and rejected, respectively. Based on the average of the 2 years,
the Gelemen clover lines had relative feed values ranging from 134 to 158 and, thus, may be categorized as premium (line 2, 1 and 11) and good (other lines) qualities (Table 3).
Mineral contents
P, K, Ca and Mg contents of Gelemen clover lines are given Tables 4 and 5. Year and year x lines interactions on P content were significant. Average of two years, P contents of Gelemen clover lines varied between 0.38 and 0.43%.
Year, lines and year x lines interactions on K content were significant. Mg contents of the lines varied between
2.91 and 3.60%. These results were higher than suggested values of 0.8% by Tajeda et al. (1985) and 0.65% by the NRC (1984). But high K concentration may cause Mg deficiency (Loreda et al. 1986). Acar et al. (2001) reported that gelemen clover had about 2.08% K content. These findings were similar to our results.
Table 4. Phosphorus (P) and potassium (K) content of Gelemen clover lines
Lines P (%) K (%) 2010 2011 mean 2010 2011 mean 1 0.370 a 0.473 0.421 1.57 g 2.25 1.91 d 2 0.350 bc 0.470 0.410 1.65 f 2.82 2.23 bd 3 0.370 a 0.447 0.408 2.11 c 3.11 2.61 a 4 0.340 cd 0.453 0.397 2.39 a 2.55 2.47 ac 5 0.337 de 0.457 0.397 1.69 f 2.79 2.24 bd 6 0.360 ab 0.493 0.427 2.21 b 2.85 2.53 ab 7 0.360 ab 0.503 0.432 2.22 b 2.58 2.40 ac 8 0.340 cd 0.493 0.417 2.18 bc 2.60 2.39 ac 9 0.337 de 0.460 0.398 2.37 a 2.69 2.53 ab 10 0.293 h 0.473 0.383 2.16 bc 2.48 2.32 ac 11 0.313 g 0.457 0.385 1.83 e 2.52 2.17 cd 12 0.327 ef 0.503 0.415 1.94 d 2.55 2.24 bd St1 0.320 fg 0.500 0.410 1.91 d 2.74 2.33 ac St2 0.310 g 0.497 0.403 1.81 e 2.49 2.15 cd Mean 0.337 B 0.477A 0407 2.00 B 2.64 A 2.32 CV (%) 1.77 8.12 6.80 1.49 9.77 7.63
Means followed by the same letter in a column are not significantly different at p= 0.05 level.
Table 5. Calcium (Ca) and magnesium (Mg) content of Gelemen clover
Lines Ca (%) Mg (%) 2010 2011 mean 2010 2011 mean 1 1.41 bc 1.65 1.53 ad 0.387 e 0.327 0.357 ad 2 1.39 bc 1.59 1.49 bf 0.400 cd 0.266 0.333 d 3 1.43 bc 1.44 1.44 df 0.433 ab 0.263 0.348 bd 4 1.25 de 1.58 1.42 ef 0.430 ab 0.290 0.360 ad 5 1.49 b 1.57 1.53 ad 0.410 c 0.307 0.358 ad 6 1.52 b 1.60 1.56 ac 0.440 a 0.293 0.367 ad 7 1.41 bc 1.61 1.51 ae 0.433 ab 0.330 0.382 ab 8 1.42 bc 1.59 1.51 ae 0.430 ab 0.333 0.382 ab 9 1.39 bc 1.53 1.46 cf 0.437 a 0.287 0.362 ad 10 1.66 a 1.56 1.61 a 0.423 b 0.330 0.377 ac 11 1.52 b 1.64 1.58 ab 0.407 c 0.297 0.352 bd 12 1.45 bc 1.56 1.50 ae 0.410 c 0.377 0.393 a St1 1.22 e 1.57 1.39 f 0.393 de 0.283 0.338 cd St2 1.35 cd 1.61 1.48 bf 0.400 cd 0.330 0.365 ad Mean 1.42 B 1.58 A 1.50 0.417 A 0.308 B 0.363 CV (%) 4.99 5.49 5.28 1.38 12.82 7.79
Means followed by the same letter in a column are not significantly different at p= 0.05 level.
Year, lines and year x lines interactions on Ca content were significant. Ca contents of the lines varied between 1.39 and 1.61%. The highest Ca content was determined on lines 10, 11, 6, 5, 1, 7, 8 and 12 (1.50-1.61%). Acar et al. (2001) reported that Gelemen clover had about 2.72% Ca content. Tajeda et al. (1985) reported that forage crops should contain at least 0.3% of Ca for ruminants. Our findings were higher than 0.3% values.
Year, lines and year x lines interactions on Mg content were significant. Mg contents of the lines varied between 0.33 and 0.39%. The least Mg content was determined on lines 11, 3 St1 and 2 (0.33-0.35%). Acar et al. (2001) reported that Gelemen clover had about 0.34% Mg content. This result was consistent with our results. Mg concentrations for forage crops were recommended as 0.2% for ruminants by Tajeda et al. (1985) and 1.0% for beef cattle by NRC (1984).
CONCLUSION
Twelve Gelemen clover lines and two standard populations were evaluated for forage yield and quality parameters in Black Sea Coastal Area. There were no improved Gelemen clover cultivars in Turkey. On the other hand Gelemen clover was commonly used by locality farmers in Middle Black Sea Coastal Region. According to present study results, Gelemen clover had higher or similar forage yield and quality parameters than other clovers (white clover, red clover, berseem clover and crimson clover etc.). End of this research, some Gelemen clover lines will be taken region yield trials. Thus, registered cultivars will be obtained at Gelemen clover.
LITERATURE CITED
Acar, Z., Ayan, İ and C. Gülser. 2001. Some morphological and nutritional properties of legumes under natural conditions. Pakistan Journal of Biological Sciences. 4: 1312-1315. Albayrak, S., Töngel, Ö and T. Yavuz. 2006. The effects of
inoculation and nitrogen fertilization on forage yield and protein content of some annual clovers (Trifolium Ssp.). Turkish Journal of Field Crops, 11 (1) 6-13.
Albayrak S., Türk, M., and O. Yüksel. 2011. Effect of row spacing and seeding rate on hungarian vetch yield and quality. Turkish Journal of Field Crops. 16(1): 53-58. Aydın, N, Mut Z, Mut H, and I. Ayan. 2010. Effect of autumn
and spring sowing dates on hay yield and quality of oat (Avena sativa L.) genotypes. Journal of Animal and Veterinary Advances 9(10):1539-1545.
Gillet, J. M. 1985: Taxonomy and morphology. In: Taylor, N. L.
ed. Clover science and technology. Madison, American
Society of Agronomy, Inc., Crop Science Society of America, Inc., Soil Science Society of America, Inc. Pp. 7– 69.
Hertzch, W., Kjellqvist, E and G. Ziegenbein. 1974. Aegean clover (Trifolium meneghinianum Clem.) a promising forage species. Zeitschrift fur Pflanzenzuchtung. 71(1): 60-68.
Kacar, B and A. İnal. 2008. Bitki Analizleri. Nobel Yayınları, No: 1241, Ankara.
Karslı, M.A., Russell, J.R and M.J. Hersom. 1999. Evaluation of berseem clover in diets of ruminants consuming corn crop residues. Journal of Animal Science. 77: 2873-2882. Ladyman, K.P., Kerleyl, M.S., Kallenbachl, R.L., Garrett, H.E.,
Van Sambee, J.W. and N.E. Navarrete-Tindall. 2003. Quality and Quantity Evaluations of Shade Grown Forages. AFTA 2003 Conf. Proceedings. 175-181.
Loreda, C., Ardilla, G.A and V.J. Alvarez. 1986. Variation in mineral concentrations in grasses in the cattle farming area of the coribbean. Herbage abstract. 56:928.
Morgner, F., Harten, A.M and A.C. Zeven. 1978. Aegean clover (Trifolium meneghinianum Clem.) a legume for intercropping. Broadening the genetic base of crops. Proceedings of the conference, Wageningen, Netherlands, 3-7 July 193-78. 153-154.
NRC, 1984. Nutrient requirements of domestic animals. . Nutrient requirements of beef cattle. Washington: NAS-NRC. 6th revised edition.
SAS Institute (1998) INC SAS/STAT users’ guide release 7.0, Cary, NC, USA.
Steel, R.G.D., J.A Torrie and D.A. Dickey, 1997. Principles and Procedures of Statistics. A. Biometrical Approach 3rd Edi. Mc Graw Hill Book.INC.N.Y.
Stewart, C.B., Beck, P.A and P.K. Capp. 2008. Establishment and Survival of Red,White, and Berseem Clover on a Sandy Soil. Arkansas Animal Science Department Report.
Tajeda, R., Mcdowell, R., Martin, F.G and J.H. Conrad. 1985. Mineral element analyses of various tropical forages in Guatemala and their relationship to soil concentration. Nutrient Rep. International. 32: 313-324.
Uzun, F. 2010. Changes in hay yield and quality of bulbous barley at different phenological stages. Turk J Agric For 34: 1-9.
Williams, W.W., Ansari, H.A., Ellison, N.W and S.W. Hussain. 2001. Evidence of Three Subspecies in Trifolium nigrescens Viv. Annals of Botany 87: 683-691.
Zohary M and D. Heller. 1984. The genus Trifolium. Jerusalem: The Israel Academy of Sciences and Humanities.