JHEP12(2019)060
Published for SISSA by SpringerReceived: August 9, 2019 Revised: October 17, 2019 Accepted: November 17, 2019 Published: December 9, 2019
Search for bottom-squark pair production with the
ATLAS detector in final states containing Higgs
bosons, b-jets and missing transverse momentum
The ATLAS collaboration
E-mail:
[email protected]
Abstract: The result of a search for the pair production of the lightest supersymmetric
partner of the bottom quark (˜b
1) using 139 fb
−1of proton-proton data collected at
√
s =
13 TeV by the ATLAS detector is reported. In the supersymmetric scenarios considered
both of the bottom-squarks decay into a b-quark and the second-lightest neutralino, ˜b
1→
b + ˜
χ
02
. Each ˜
χ
02is assumed to subsequently decay with 100% branching ratio into a Higgs
boson (h) like the one in the Standard Model and the lightest neutralino: ˜
χ
02
→ h + ˜
χ
01.
The ˜
χ
01
is assumed to be the lightest supersymmetric particle (LSP) and is stable. Two
signal mass configurations are targeted: the first has a constant LSP mass of 60 GeV;
and the second has a constant mass difference between the ˜
χ
02
and ˜
χ
01of 130 GeV. The
final states considered contain no charged leptons, three or more b-jets, and large missing
transverse momentum. No significant excess of events over the Standard Model background
expectation is observed in any of the signal regions considered. Limits at the 95% confidence
level are placed in the supersymmetric models considered, and bottom-squarks with mass
up to 1.5 TeV are excluded.
Keywords: Hadron-Hadron scattering (experiments), Supersymmetry
JHEP12(2019)060
Contents
1
Introduction
1
2
ATLAS detector
3
3
Data and simulated event samples
4
4
Event reconstruction
5
5
Analysis strategy
7
5.1
The SRA selections
9
5.2
The SRB selections
10
5.3
The SRC selections
11
6
Background estimation
12
6.1
A-type CR and VR definitions
14
6.2
B-type CR and VR definitions
14
6.3
C-type CR and VR definitions
15
6.4
Summary of CR and VR results
16
7
Systematic uncertainties
19
8
Results and interpretation
20
9
Conclusion
26
The ATLAS collaboration
33
1
Introduction
Supersymmetry (SUSY) [
1
–
6
] provides an extension to the Standard Model (SM) that
solves the hierarchy problem [
7
–
10
] by introducing partners of the known bosons and
fermions. In R-parity-conserving models [
11
], SUSY particles are produced in pairs and
the lightest supersymmetric particle (LSP) is stable and provides a candidate for dark
matter [
12
,
13
]. The superpartners of the SM bosons (the wino, bino and higgsinos) mix
to form the neutralinos ( ˜
χ
01,2,3,4
) and charginos ( ˜
χ
±
1,2
) physical states. For a large selection
of models, the LSP is the lightest neutralino ( ˜
χ
01
). Naturalness considerations suggest that
the supersymmetric partners of the third-generation quarks are light [
14
,
15
]. If this is
assumed, the lightest bottom-squark (˜b
1) and lightest top-squark (˜
t
1) mass eigenstates
11The scalar partners of the left-handed and right-handed chiral components of the bottom quark (˜b L,R) or
JHEP12(2019)060
˜b
˜b
˜
χ
02˜
χ
02p
p
b
˜
χ
01h
b
˜
χ
01h
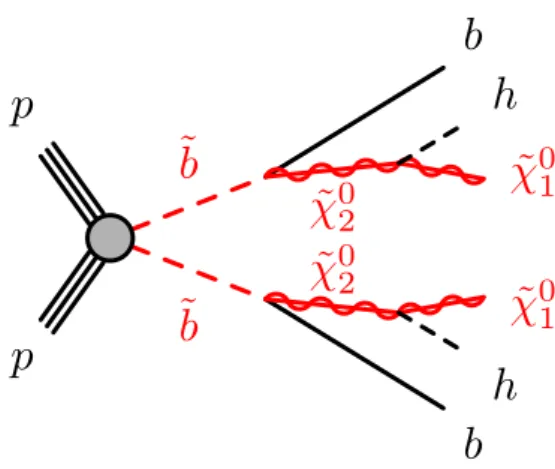
Figure 1. Graphical representation of the SUSY signal targeted by this analysis. Bottom squarks are produced in pairs and subsequently decay into b ˜χ0
2 with B = 100%. The two ˜χ02particles decay
into h ˜χ0
1 also with B = 100%.
could be significantly lighter than the other squarks and the gluinos. As a consequence,
˜b
1and ˜
t
1could be pair-produced with relatively large cross-sections at the Large Hadron
Collider (LHC). Depending on the mass hierarchy considered, it is possible that the ˜b
1and
˜
t
1could decay into final states with Higgs bosons, h, like the one in the SM, and this allows
the Higgs boson to be used as a probe for new physics.
This article presents a search for the pair production of bottom squarks decaying into
the LSP via a complex decay chain containing the second-lightest neutralino ( ˜
χ
02
) and
the Higgs boson: ˜b
1→ b + ˜
χ
02and subsequently ˜
χ
02→ h + ˜
χ
01. Such a decay hierarchy
is predicted in minimal supersymmetric extensions to the SM (MSSM) [
16
,
17
], with h
assumed to be the lightest of the neutral bosons introduced in the MSSM. The bottom
squark decaying through a next-to-lightest neutralino is one of the possible modes within
the MSSM. Dedicated searches for direct decays into the lightest neutralino (˜b
1→ b ˜
χ
01) or
a chargino (˜b
1→ t ˜
χ
±1) have been reported by the ATLAS and CMS collaborations (see for
example [
18
,
19
] and [
20
–
22
]).
When the LSP is bino-like and the ˜
χ
02
is a wino-higgsino mixture, the branching ratio
(B) of ˜
χ
02
→ h + ˜
χ
01is enhanced relative to the other possible ˜
χ
02decays. The Higgs boson
mass is taken to be 125 GeV, and the decay into a pair of bottom quarks is assumed to be
the same as in the SM (B = 58% [
23
,
24
]), although it could be enhanced or reduced in
the MSSM.
This search is interpreted within simplified model scenarios [
25
,
26
] and figure
1
illus-trates the targeted model. In the first set of models, already considered by the ATLAS
Collaboration using 8 TeV data [
27
], the mass of the ˜
χ
01
is fixed at 60 GeV. The
bottom-squark and ˜
χ
02
masses vary in the ranges 250–1600 GeV and 200–1500 GeV, respectively.
The assumption about the ˜
χ
01
mass is motivated by dark-matter relic density measurements
and might be favoured in Higgs-pole annihilation scenarios [
28
] where m
χ˜01
' m
h/2. The
previous search performed by ATLAS using 8 TeV data excluded bottom-squark masses up
to 750 GeV in this scenario [
27
].
JHEP12(2019)060
The second set of SUSY models assumes a fixed mass difference between the ˜
χ
02
and
˜
χ
01
, sufficient to produce an on-shell Higgs boson. The mass difference, ∆m( ˜
χ
02, ˜
χ
01), is set
to 130 GeV, whilst bottom-squark and ˜
χ
01
masses vary in the ranges 400–1500 GeV and
1–800 GeV, respectively. A similar scenario is considered by the CMS Collaboration in
ref. [
29
], where the h → γγ decay mode is exploited to exclude bottom-squark masses up
to 530 GeV; no prior ATLAS searches have targeted these models.
The final states are characterised by a unique signature, which contains many jets, of
which up to six can be identified as originating from the fragmentation of b-quarks (referred
to as b-jets), missing transverse momentum (p
missT
, the magnitude thereof referred to as
E
missT
), and no charged leptons (referred to as leptons). New selections and dedicated
procedures aiming to maximise the efficiency of reconstructing the Higgs boson candidates
decaying into a b-quark pair are employed in this article. Section
2
presents a brief overview
of the ATLAS detector, with section
3
describing the data and simulated samples used in
the analysis. The event reconstruction methods are explained in section
4
. An overview
of the analysis strategy is presented in section
5
, with the background estimation strategy
discussed in section
6
. The systematic uncertainties considered in the analysis are described
in section
7
. Section
8
presents the results and interpretation thereof, with the conclusions
presented in section
9
.
2
ATLAS detector
The ATLAS detector [
30
] is a multipurpose particle physics detector with a
forward-backward symmetric cylindrical geometry and nearly 4π coverage in solid angle.
2The
inner tracking detector consists of pixel and silicon microstrip detectors covering the
pseu-dorapidity region |η| < 2.5, surrounded by a transition radiation tracker which enhances
electron identification in the region |η| < 2.0. Between Run 1 and Run 2, a new inner pixel
layer, the insertable B-layer [
31
,
32
], was added at a mean sensor radius of 3.3 cm. The
inner detector is surrounded by a thin superconducting solenoid providing an axial 2 T
magnetic field and by a fine-granularity lead/liquid-argon (LAr) electromagnetic
calorime-ter covering |η| < 3.2. A steel/scintillator-tile calorimecalorime-ter provides hadronic coverage in the
central pseudorapidity range (|η| < 1.7). The endcap and forward regions (1.5 < |η| < 4.9)
of the hadronic calorimeter are made of LAr active layers with either copper or tungsten as
the absorber material. An extensive muon spectrometer with an air-core toroidal magnet
system surrounds the calorimeters. Three layers of high-precision tracking chambers
pro-vide coverage in the range |η| < 2.7, while dedicated fast chambers allow triggering in the
2
ATLAS uses a right-handed coordinate system with its origin at the nominal interaction point in the centre of the detector. The positive x-axis is defined by the direction from the interaction point to the centre of the LHC ring, with the positive y-axis pointing upwards, while the beam direction defines the z-axis. Cylindrical coordinates (r, φ) are used in the transverse plane, φ being the azimuthal angle around the z-axis. The component of momentum in the transverse plane is denoted by pT. The pseudorapidity η is
defined in terms of the polar angle θ by η = − ln tan(θ/2). Rapidity is defined as y = 0.5 ln[(E +pz)/(E −pz)]
where E denotes the energy, and pz is the component of the momentum along the beam direction. The
JHEP12(2019)060
region |η| < 2.4. The ATLAS trigger system consists of a hardware-based level-1 trigger
followed by a software-based high-level trigger [
33
].
3
Data and simulated event samples
The data analysed in this study correspond to a total of 139 fb
−1of proton-proton (pp)
collision data collected by the ATLAS detector with a centre-of-mass energy of 13 TeV and
a 25 ns proton bunch crossing interval in the period between 2015 and 2018. All detector
subsystems were required to be operational during data taking. The average number of
interactions per bunch crossing (pile-up) increased from hµi = 20 (2015–2016 dataset) to
hµi = 37 (2018 dataset), with a highest hµi = 38 (2017 dataset). The uncertainty in
the combined 2015–2018 integrated luminosity is 1.7 % [
34
], obtained using the LUCID-2
detector [
35
] for the primary luminosity measurements.
Events are required to pass an E
missT
trigger [
36
] which is fully efficient for events with
reconstructed E
missT
> 250 GeV. Additional single-lepton triggers requiring electrons or
muons are used to estimate the SM backgrounds, with an offline selection of p
T(`) > 27 GeV
used to ensure the trigger is fully efficient (` = e, µ).
Dedicated Monte Carlo (MC) simulated samples are used to model SM processes and
estimate the expected signal yields. All samples were produced using the ATLAS simulation
infrastructure [
37
] and GEANT4 [
38
], or a faster simulation based on a parameterisation
of the calorimeter response and GEANT4 for the other detector systems [
37
].
The SUSY signal samples were generated with MadGraph5 aMC@NLO v2.6.2 [
39
]
at leading order (LO) and interfaced to PYTHIA v8.230 [
40
] for the modelling of the
parton showering (PS), hadronisation and the underlying event with the A14 [
41
] set of
tuned parameters (tune). The matrix element (ME) calculation was performed at tree
level and includes the emission of up to two additional partons. The ME-PS matching
was done using the CKKW-L [
42
] prescription, with a matching scale set to one quarter
of the bottom-squark mass. The NNPDF2.3 LO [
43
] parton distribution function (PDF)
set was used. Signal cross-sections were calculated to approximate next-to-next-to-leading
order in the strong coupling constant, adding the resummation of soft gluon emission
at next-to-next-to-leading-logarithm (approximate NNLO+NNLL) [
44
–
47
] accuracy. The
nominal cross-section and its uncertainty were derived using the PDF4LHC15 mc PDF set,
following the recommendations of ref. [
48
]. For ˜b
1masses between 400 GeV and 1.5 TeV,
the cross-sections range from 2.1 pb to 0.26 fb, with uncertainties from 6% to 17%.
The SM backgrounds considered in this analysis are: t¯
t pair production;
single-top-quark production; Z + jets; W + jets; t¯
t production with an electroweak (ttV ) or Higgs
(ttH) boson; and diboson production. The samples were simulated using different MC
generator programs depending on the process. Pair production of top quarks, t¯
t, was
generated using POWHEG-BOX v2 [
49
–
52
] interfaced with PYTHIA v8.230 and the A14
tune with the NNPDF2.3 LO PDF set for the ME calculations. The h
dampparameter in
POWHEG-BOX, which controls the p
Tof the first additional emission beyond the Born
level and thus regulates the p
Tof the recoil emission against the t¯
t system, was set to 1.5
JHEP12(2019)060
The generation of single top quarks in the W t-channel, s-channel and t-channel production
modes was performed by POWHEG-BOX v2 [
50
–
52
,
54
] similarly to the t¯
t samples. For all
processes involving top quarks, top-quark spin correlations were preserved. All events with
at least one leptonically decaying W boson were retained; fully hadronic t¯
t and
single-top events do not contain sufficient E
missT
to contribute significantly to the background.
The production of t¯
t pairs in association with electroweak vector bosons (W, Z) or Higgs
bosons was modelled by samples generated at NLO using MadGraph5 aMC@NLO v2.2.3
and showered with PYTHIA v8.212. Events containing W or Z bosons with associated jets,
including jets from the fragmentation of heavy-flavour quarks, were simulated using the
SHERPA v2.2.1 [
55
] generator. Matrix elements were calculated for up to two additional
partons at NLO and four partons at LO using the Comix [
56
] and OpenLoops [
57
] ME
generators and were merged with the SHERPA PS [
58
] using the ME+PS@NLO
prescrip-tion [
59
]. The NNPDF3.0 NNLO [
43
] PDF set was used in conjunction with a dedicated
PS tune developed by the SHERPA authors. Diboson processes were also simulated using
the SHERPA generator using the NNPDF3.0 NNLO PDF set. They were calculated for
up to one (ZZ) or zero (W W, W Z) additional partons at NLO and up to three additional
partons at LO. Other potential sources of backgrounds, such as the production of three or
four top quarks or three gauge bosons, are found to be negligible. Finally, contributions
from multijet background are estimated from data using a jet smearing procedure described
in ref. [
60
] and are found to be negligible in all regions.
All background processes are normalised to the best available theoretical calculation for
their respective cross-sections. The NLO t¯
t inclusive production cross-section is corrected
to the theory prediction at NNLO in QCD including the resummation of NNLL soft-gluon
terms calculated using Top++2.0 [
61
–
67
]. Samples of single-top events are normalised to
the NLO cross-sections reported in refs. [
68
–
70
].
For all samples, except those generated using SHERPA, the EvtGen v1.2.0 [
71
]
pro-gram was used to simulate the properties of the bottom- and charm-hadron decays. All
simulated events include a modelling of contributions from pile-up by overlaying
minimum-bias pp interactions from the same (in-time pile-up) and nearby (out-of-time pile-up) bunch
crossings simulated in PYTHIA v8.186 and EvtGen v1.2.0 with the A3 [
72
] tune and the
NNPDF2.3 LO set [
43
].
4
Event reconstruction
This search is based upon a selection of events with many b-jets, large missing transverse
momentum and no charged leptons (electrons and muons) in the final state. All events are
required to have a reconstructed primary vertex which is consistent with the beamspot
enve-lope and consists of at least two associated tracks in the inner detector with p
T> 500 MeV.
If more than one vertex passing the above requirements is found, the one with the largest
sum of the squares of transverse momenta of associated tracks [
73
] is chosen.
Jet candidates are reconstructed from three-dimensional clusters of energy in the
calorimeter [
74
] with the anti-k
tjet algorithm [
75
,
76
] using a radius parameter of 0.4. The
JHEP12(2019)060
is used to calibrate the reconstructed jets. A set of quality criteria is applied to
iden-tify jets which arise from non-collision sources or detector noise [
78
] and any event which
contains a jet failing to satisfy these criteria is removed. Additional jets that arise from
pile-up interactions are rejected by applying additional track-based selections to jets with
p
T< 120 GeV and |η| < 2.4 [
79
], and the jet momentum is corrected by subtracting the
expected average energy contribution from pile-up using the jet area method [
80
]. Jets are
classified as either ‘baseline’ or ‘signal’; baseline jets are required to have p
T> 20 GeV and
|η| < 4.8 whilst signal jets are selected after resolving overlaps with electrons and muons,
as described below, and must pass tighter requirements of p
T> 30 GeV and |η| < 2.8.
Signal jets are identified as b-jets if they are within |η| < 2.5 and are tagged by a
mul-tivariate algorithm which uses a selection of inputs including information about the impact
parameters of inner-detector tracks, the presence of displaced secondary vertices and the
reconstructed flight paths of b- and c-hadrons inside the jet [
81
]. The b-tagging algorithm
used has an efficiency of 77%, determined in a sample of simulated t¯
t events. It was chosen
as part of the optimisation procedure and the corresponding misidentification rate is 20%
for c-jets and 0.9% for light-flavour jets. To compensate for differences between data and
MC simulation in the b-tagging efficiencies and mis-tag rates, correction factors are derived
from data and applied to the samples of simulated events; details are found in ref. [
81
].
Electron candidates are reconstructed from energy clusters in the electromagnetic
calorimeter matched to a track in the inner detector and are required to satisfy a set
of ‘loose’ quality criteria [
82
]. They are also required to lie within the fiducial volume
|η| < 2.47 and have p
T> 4.5 GeV. Muon candidates are reconstructed by matching tracks
in the inner detector with tracks in the muon spectrometer. Muon candidates which have
a transverse (longitudinal) impact parameter relative to the primary vertex larger than
0.2 mm (1 mm) are rejected to suppress muons from cosmic rays. Muon candidates are
also required to satisfy ‘medium’ quality criteria [
83
] and have |η| < 2.5 and p
T> 4 GeV.
Electron (muon) candidates are matched to the primary vertex by requiring the transverse
impact parameter (d
0) to satisfy |d
0|/σ(d
0) < 5 (3), and the longitudinal impact parameter
(z
0) to satisfy |z
0sin θ| < 0.5 mm. Lepton candidates remaining after resolving overlaps
with baseline jets are called ‘baseline’ leptons. In the control regions where tighter lepton
identification is required, ‘signal’ leptons are chosen from the baseline set with p
T> 20 GeV
and are required to be isolated from other activity in the detector using a criterion designed
to accept at least 95% of leptons from Z boson decays; details are found in ref. [
84
]. In
the dilepton control region where the single-lepton triggers are used, the leading lepton
is required to have p
T> 27 GeV; which ensures full efficiency of the single-lepton
trig-gers. Signal electrons are further required to satisfy ‘tight’ quality criteria [
82
]. The MC
events are corrected to account for differences in the lepton trigger, reconstruction and
identification efficiencies between data and MC simulation.
Possible reconstruction ambiguities between baseline electrons, muons and jets are
resolved by firstly removing electron candidates which share an inner detector track
with a muon candidate.
Jet candidates are then removed if they are within ∆R =
p(∆y)
2+ (∆φ)
2= 0.2 of an electron candidate; next, electron candidates are discarded
JHEP12(2019)060
any remaining jet, except for the case where the number of tracks associated with the jet
is less than three, where the muon is kept and the jet is discarded.
Identified τ leptons decaying hadronically are not considered but the following τ -veto
procedure is applied to reject events which contain τ -like objects. Candidates (τ
cand)
are identified as jets which have |η| < 2.5 and less than five inner detector tracks of
p
T> 500 MeV. If an event contains a tau candidate with a small azimuthal distance to
the p
missT
(∆φ(E
Tmiss, τ
cand) < π/3), then the event is vetoed.
The missing transverse momentum p
missT
is defined as the negative vector sum of the
p
Tof all selected and calibrated physics objects (electrons, muons, photons [
82
] and jets)
in the event, with an extra term added to account for soft energy in the event which is not
associated with any of the selected objects [
85
]. This soft term is calculated from
inner-detector tracks with p
Tabove 500 MeV matched to the PV, thus ensuring it is robust
against pile-up contamination [
86
,
87
].
5
Analysis strategy
Three sets of non-orthogonal signal regions (SRs) are defined to target different mass
hi-erarchies of the SUSY particles involved. These definitions exploit various discriminating
observables and algorithms developed to explicitly reconstruct Higgs boson candidates in
the decay chain. Events with charged leptons are vetoed in all SRs. Events with one or
two charged leptons are used to define control regions (CRs) to aid in the estimation of
the main SM backgrounds. Additionally, events with zero charged leptons are utilised to
define validation regions (VRs) to ensure the background estimation method, described in
section
6
, is robust. The optimisation procedure for the event selection aims to maximise
the yield of bottom-squark pair production events while reducing SM background
contri-butions. It is performed for the two simplified model scenarios introduced in section
1
.
Since the h → bb decay mode is considered, the final state contains a large jet multiplicity,
with many of these jets originating from b-quarks, and large E
missT
from the neutralinos.
The event selection criteria are defined on the basis of kinematic requirements for the
objects described in the previous section and the event variables described below. For these
definitions, signal jets are used and are ordered according to decreasing p
T.
• N
jets: the number of signal jets.
• N
b-jets: the number of b-jets.
• min ∆φ(jet
1−4, p
missT
): the minimum azimuthal distance between the four highest-p
Tjets and the p
missT
. This is a powerful discriminating variable against multijet
back-ground events containing a large amount of E
missT
due to mismeasured jets. Typically,
multijet background events exhibit low values of this variable and studies using
data-driven multijet estimates indicate that a selection of min ∆φ(jet
1−4, p
missT
) > 0.4 is
JHEP12(2019)060
• ∆φ(j
1, p
missT): the azimuthal distance between the highest-p
Tjet and the p
missT. This
variable is used to select events where the p
missT
is expected to be recoiling against
the leading jet.
• m
eff: the effective mass [
88
] of an event is defined as the scalar sum of the p
Tof all
signal jets and the E
miss T, i.e.:
m
eff=
X
i≤Njets
(p
jetT)
i+ E
Tmiss.
• S: referred to as the “object-based E
missT
-significance” [
89
] is defined as follows:
S =
s
|p
miss T|
2σ
2 L(1 − ρ
2LT)
.
The total momentum resolution of all jets and leptons, at a given p
Tand |η|, is
determined from parameterised Monte Carlo simulation which well reproduces the
resolution measured in data. σ
Lis the total momentum resolution after being rotated
into the longitudinal (parallel to the p
missT
) plane. The quantity ρ
LTis a correlation
factor between the longitudinal and transverse momentum resolution (again with
respect to the p
missT
) of each jet or lepton. The significance S is used to discriminate
events where the E
missT
arises from invisible particles in the final state from events
where the E
missT
arises from poorly measured particles (and jets). Additionally, it is
useful in discriminating between signal events with large E
missT
and Z + jets events
with medium-to-low E
missT
.
Additional selections on the p
Tof the leading jet and of the leading b-jet are also applied
as detailed in the following subsections. In all signal regions, events containing baseline
leptons with p
T> 10 GeV are vetoed, as well as events containing τ -lepton candidates that
align with the p
missT
within ∆φ = π/3 . Only events with E
Tmiss> 250 GeV are retained to
ensure full efficiency of the trigger.
The event kinematics targeted by the three SRs are depicted in figure
2
. The first signal
region is SRA, designed to target the ‘bulk’ region of both signal models, with
moderate-to high-mass splitting between the ˜b
1and ˜
χ
02. In these scenarios all of the b-jets, from both
the bottom-squark and Higgs boson decays, are at a relatively high p
Tand can be resolved
in the detector. The b-jets from the Higgs boson can be isolated by removing the ones
most likely from the bottom-squark decays and checking the angular separation between
the remaining b-jets.
The second region, SRB, is designed to target the phase space of the ∆m( ˜
χ
02
, ˜
χ
01) =
130 GeV scenario with a small mass splitting between the ˜b
1and ˜
χ
02, referred to as the
“compressed” region. An initial-state radiation (ISR)-like selection is used where the small
mass splitting between the bottom squark and neutralino leads to relatively soft b-jets from
the bottom squark decay, which are difficult to reconstruct. In this scenario it is possible to
reconstruct both Higgs bosons using angular separation methods. Finally, SRC is designed
JHEP12(2019)060
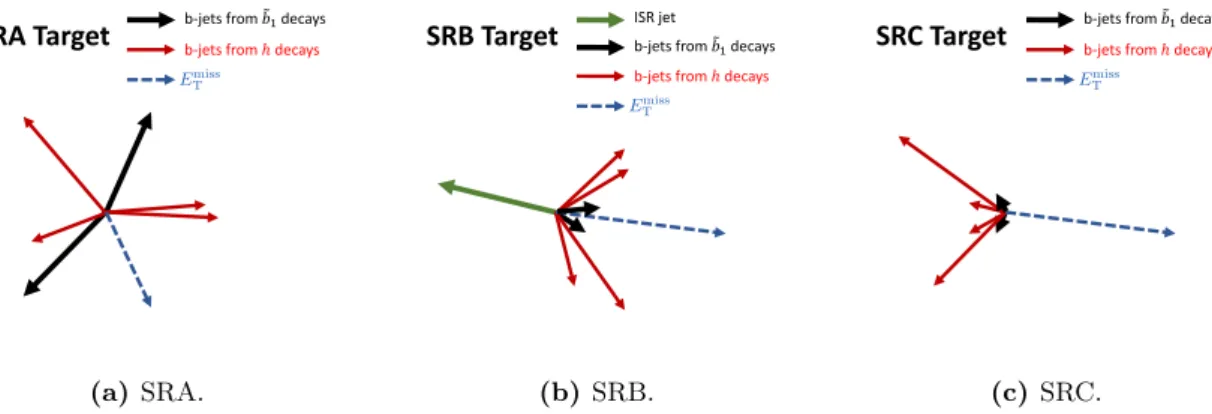
Emiss T (a) SRA. Emiss T (b) SRB. Emiss T (c) SRC.Figure 2. The different event kinematics, in the transverse plane, targeted by the three SRs: (a) kinematics in the bulk region, with high-pT b-jets arising from the bottom-squark decay; (b)
kinematics in the compressed region of the ∆m( ˜χ0
2, ˜χ01) = 130 GeV scenario with soft b-jets from
the bottom squark; (c) kinematics in the compressed region of the m( ˜χ0
1) = 60 GeV scenario which
also contains soft b-jets from the bottom squark.
to target the “compressed” region of the m( ˜
χ
01
) = 60 GeV signal scenario, where the mass
splitting between the ˜b
1and ˜
χ
02is small. The b-jets from the bottom squark decay are very
soft and as such a lower b-jet multiplicity is used in this region, when compared to the
A- and B-type selections. Additionally, the visible system (b-jets from the bottom squark
decay and Higgs boson decay) is produced back-to-back with the reconstructed p
missT
.
5.1
The SRA selections
To exploit the kinematic properties of the signal over a large range of ˜b
1, ˜
χ
02
and ˜
χ
01masses, incremental thresholds are imposed on the main discriminating variable, m
eff,
resulting in three mutually exclusive regions, 1.0 < m
eff< 1.5 TeV, 1.5 < m
eff< 2.0 TeV
and m
eff> 2.0 TeV. These are labelled as SRA-L, -M and -H, respectively, to maximise
coverage across the ˜b
1mass range. The selection criteria for the three SRAs are summarised
in table
1
.
At least four b-tagged jets are required. To discriminate against multijet background,
events where the p
missT
is aligned with a jet in the transverse plane are rejected by requiring
min ∆φ(jet
1−4, p
missT
) > 0.4. As a large E
Tmissis expected from the neutralinos which escape
the detector, a selection of E
missT
> 350 GeV is used. Additionally, the leading b-jet (b
1)
is expected to have a large p
T, hence a selection of p
T(b
1) > 200 GeV is employed. At
least one of the two Higgs boson candidates in the event is identified using a reconstruction
algorithm referred to as max-min, which is a two-step procedure to remove the high-p
Tb-jets from the bottom squark decay and then use the remaining b-jets to reconstruct a
Higgs boson in the decay chain. The procedure is implemented as follows: first, pairs
of b-jets are formed by iterating through all of the b-jets in the event, and the pair with
the largest separation in ∆R is designated as arising from the bottom-squark decay and
removed from the subsequent step; second, the pair with the smallest ∆R is identified as a
JHEP12(2019)060
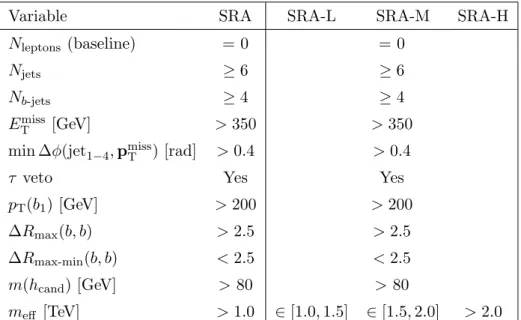
Variable
SRA
SRA-L
SRA-M
SRA-H
N
leptons(baseline)
= 0
= 0
N
jets≥ 6
≥ 6
N
b-jets≥ 4
≥ 4
E
missT
[GeV]
> 350
> 350
min ∆φ(jet
1−4, p
missT
) [rad]
> 0.4
> 0.4
τ veto
Yes
Yes
p
T(b
1) [GeV]
> 200
> 200
∆R
max(b, b)
> 2.5
> 2.5
∆R
max-min(b, b)
< 2.5
< 2.5
m(h
cand) [GeV]
> 80
> 80
m
eff[TeV]
> 1.0
∈ [1.0, 1.5]
∈ [1.5, 2.0]
> 2.0
Table 1. Definitions for the SRA, alongside the three varying meff intervals used. The letter
appended to the SRA label corresponds to the low (-L), medium (-M) or high (-H) meff selection.
This selection is sensitive to the bulk regions of both signal scenarios. The jets and b-jets are ordered by pT.
possible Higgs boson candidate and its invariant mass calculated. The following ∆R and
mass quantities are defined:
• ∆R
max(b, b): the distance in η–φ between the two b-jets with the maximal angular
separation which are most likely to originate from the initial decay of the ˜b
1;
• ∆R
max-min(b, b): the distance in η–φ between the two b-jets with the minimum
angu-lar separation which are most likely to originate from the same Higgs boson decay,
selected out of the remaining b-jets;
• m(h
cand): the invariant mass of the b-jet pair identified as a Higgs candidate by the
max-min
algorithm. A lower bound on m(h
cand) is used; in the majority of events the
distribution peaks around the Higgs boson mass, but in scenarios where the incorrect
combination of b-jets is chosen the signal can extend to higher masses.
When applied to signal, the max-min algorithm correctly selects a h → bb pairing in
20%–40% of cases for a single Higgs boson decay, depending upon the model. For a signal
model corresponding to m(˜b
1, ˜
χ
02, ˜
χ
01) = (1100, 330, 200) GeV, about 3% of the simulated
signal events are retained by the SRA selections.
5.2
The SRB selections
The SRB region targets small mass-splitting between the ˜b
1and ˜
χ
02
(of order 5–20 GeV),
in the case of the ∆m( ˜
χ
02
, ˜
χ
01) = 130 GeV scenarios. The presence of an ISR jet boosting
JHEP12(2019)060
Variable
SRB
N
leptons(baseline)
= 0
N
jets≥ 5
N
b-jets≥ 4
E
miss T[GeV]
> 350
min ∆φ(jet
1−4, p
missT
) [rad]
> 0.4
τ veto
Yes
m(h
cand1, h
cand2)
avg[GeV]
∈ [75, 175]
Leading jet not b-tagged
Yes
p
T(j
1) [GeV]
> 350
|∆φ(j
1, E
Tmiss)| [rad]
> 2.8
m
eff[TeV]
> 1
Table 2. Definitions for SRB, targeting the compressed region of the ∆m( ˜χ02, ˜χ01) = 130 GeV
scenario. The jets and b-jets are ordered by pT.
suppress SM background contributions, events are selected where the highest-p
Tjet is not
b-tagged and has p
T> 350 GeV; this jet is presumed to arise from ISR in the scenario
under consideration. Additional selections of E
missT
> 350 GeV and ∆φ(j
1, E
Tmiss) > 2.8
are applied. An m
effselection of > 1 TeV is also applied. The soft p
Tspectrum predicted
for b-jets from ˜b
1decays can cause the b-jets to be difficult to reconstruct, hence a different
algorithm, aiming to reconstruct both Higgs boson candidates, is employed.
Differently from the scenarios targeted by SRA, pairs of b-jets with the largest ∆R are
found to be more likely to arise from the decay of the same Higgs boson candidate. Two
pairs at a time are identified following an iterative procedure, such that at first the pair
of b-jets leading to the highest ∆R, ∆R
bb1, is defined, followed by the second highest ∆R,
∆R
bb2, built considering only the remaining b-jets. The average mass of the two candidates
m(h
cand1, h
cand2)
avgis calculated and a requirement is placed on the average mass,
cor-responding to a window around the Higgs boson mass: [75, 175] GeV. For a signal model
corresponding to m(˜b
1, ˜
χ
02, ˜
χ
01) = (700, 680, 550) GeV, about 0.1% of the simulated signal
events are retained by the SRB selections. The efficiency of correctly selecting the b-jets
using this algorithm is in the range 15%–30%. The SRB requirements are listed in table
2
.
5.3
The SRC selections
When considering the scenario with a constant ˜
χ
01
mass of 60 GeV, the ∆R-based Higgs
boson reconstruction algorithms are ineffective in the compressed region of phase space with
a small mass splitting between the ˜b
1and ˜
χ
02. In the inclusive SRC, the main discriminating
quantity is S; a selection of S > 22 is employed. Events are also required to have at least
three b-jets. Four non-overlapping regions (SRC22, SRC24, SRC26 and SRC28) are defined
as subsets of the inclusive SRC region, with incremental thresholds placed on S as detailed
JHEP12(2019)060
Variable
SRC
SRC22
SRC24
SRC26
SRC28
N
leptons(baseline)
= 0
= 0
N
jets≥ 4
≥ 4
N
b-jets≥ 3
≥ 3
E
miss T[GeV]
> 250
> 250
min ∆φ(jet
1−4, p
missT
) [rad]
> 0.4
> 0.4
S
> 22
∈ [22, 24]
∈ [24, 26]
∈ [26, 28]
> 28
Table 3. Definitions for SRC, alongside the four varying S intervals used. The letter appended to the SRC label corresponds to the lower bound on the S interval. SRC targets small mass splittings between the ˜b1 and ˜χ02, in the m( ˜χ01) = 60 GeV signal scenario. The jets and b-jets are ordered
by pT.
in table
3
, to ensure full coverage of the target models as a function of bottom-squark and
neutralino mass. For a signal model corresponding to m(˜b
1, ˜
χ
02, ˜
χ
01) = (1200, 1150, 60) GeV,
about 11% of the simulated signal events are retained by the SRC selections. The S variable
is effective in rejecting the SM background arising from associated production of a Z boson
decaying into neutrinos and b-jets.
6
Background estimation
There are two main SM backgrounds which are expected to contribute to the yields for
the SRs introduced in the previous section. For SRAs and SRB, the main background
is top-quark production which, according to MC estimates, contributes between 70% and
85% of the total background, depending upon the region considered, and is dominated by
top-quark pairs produced in association with two b-quarks arising from gluon splitting. In
the SRCs, the main backgrounds arise from Z + jets (up to 50% of the total) and from
top-quark-related processes (up to 20% of the total).
The main SM backgrounds in each SR are determined separately with a profile
likeli-hood fit to the event yields in the associated CRs [
90
]. This is commonly referred to as a
background-only fit which constrains and adjusts the normalisation of the background
pro-cesses. The background-only fit uses the observed event yield and the expected number of
MC events in the associated CRs, which are described by Poisson statistics, as a constraint
to adjust the normalisation of the background processes assuming that no signal is present.
The normalisation factor is referred to as the µ factor. The CRs are designed to be
enriched in specific background contributions relevant to the analysis, whilst minimising
the potential signal contamination, and they are orthogonal to the SRs.
When performing the fit for SRA, a multi-bin approach is used, with a single CR
divided into three bins of m
eff. Such an approach allows the calculation and use of a single
normalisation parameter (applied to the main t¯
t background across all bins of m
eff), and
JHEP12(2019)060
SRA,
SRB
𝑁(ℓ) 𝑁(𝑏) ≥ 4 3 1 0VRA0
ℓ,
VRB0
ℓ
CRA
𝟏ℓ,
CRB
𝟏ℓ
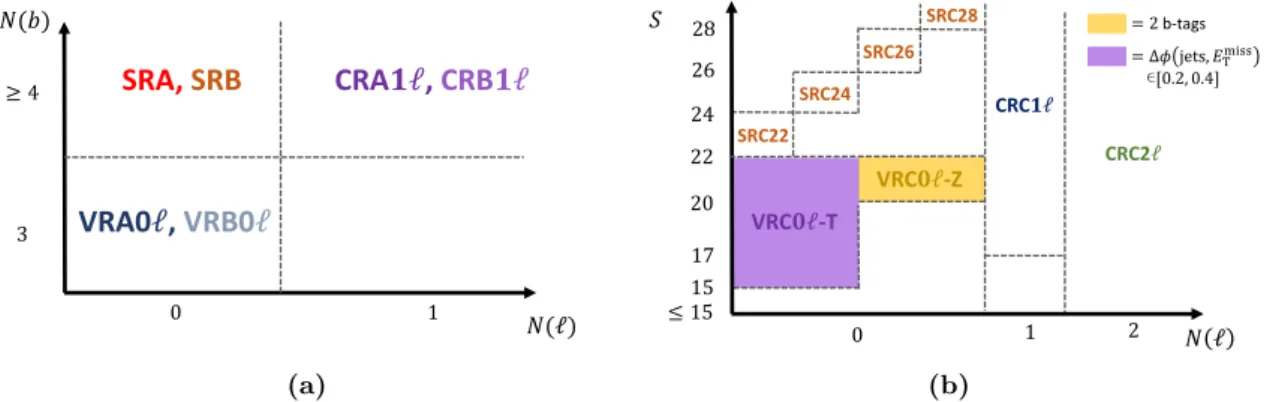
(a) SRC22 VRC𝟎ℓ-T 𝑁 ℓ 𝑆 26 15 0 17 28 SRC24 SRC26 SRC28 ≤ 15 = 2 b-tags 1 2 24 22 CRC2ℓ CRC𝟏ℓ = Δ𝜙 jets, 𝐸 ∊[0.2, 0.4] 20 VRC𝟎ℓ-Z (b)Figure 3. Schematic diagrams of the fit strategies for (a) the A-, B- and (b) C-type regions. Generally the CRs require a different lepton multiplicity than the SRs. The validation regions are defined with a lower b-jet multiplicity requirement, except in the case of the VRC0`-T region, which instead inverts the SR min ∆φ(jet1−4, pmissT ) selection.
The systematic uncertainties, described in section
7
, are included in the fit as nuisance
parameters. They are constrained by Gaussian distributions with widths corresponding
to the sizes of the uncertainties and are treated as correlated, when appropriate, between
the various regions. The product of the various probability density functions and the
Gaussian distributions forms the likelihood function, which the fit maximises by adjusting
the background normalisation and the nuisance parameters. This approach reduces the
influence of systematic uncertainties on the backgrounds with dedicated CRs, as these are
absorbed by the normalisation parameter.
Finally, the reliability of the MC extrapolation of the SM background estimates outside
of the CRs is evaluated in dedicated VRs, orthogonal to CRs and SRs.
The fit strategies for the A- and B-type regions are very similar and are represented
schematically in figure
3a
. They rely on CRs with a single-lepton requirement, as the
t¯
t background in the SR is dominated by semileptonic t¯
t decays where the lepton is not
identified. The main background in both regions is t¯
t pair production in association with
heavy-flavour jets. The fit strategy for the C-type regions is presented in figure
3b
. The
strategy is different because the main background in these regions is Z+jets, closely followed
by the top-quark backgrounds. In order to define CRs enhanced in t¯
t and Z+jets, additional
variables are used:
• m
T: the event transverse mass m
Tis defined as m
T=
q
2p
T(`)E
Tmiss(1 − cos(∆φ)),
where ∆φ is the difference in azimuthal angle between the lepton and the p
missT
. This
is used in the one-lepton CRs to reject multi-jet events which can be misidentified as
containing a prompt lepton.
• m
``: the invariant mass of the two leptons in the event. Since the two-lepton CR is
used to constrain the Z+jets background, the m
``variable is required to be within
JHEP12(2019)060
• ˜
E
missT
: the ‘lepton corrected’ E
missT. For the two-lepton CR the transverse momentum
vectors of the leptons are subtracted from the E
missT
calculation in order to mimic the
neutrinos from Z → νν decays (used exclusively in the two-lepton CR).
When designing the CRs and VRs, the potential signal contamination is checked in
each region to ensure that the contribution from the signal process being targeted is small
in the regions. The signal contamination in the CRs and VRs is found to be negligible, at
the level of < 1% of the total SM expectation, depending upon the signal mass hierarchy
of the models considered in this search.
6.1
A-type CR and VR definitions
A single, t¯
t-dominated CR (CRA1`) is defined for the A-type regions and is split into the
same three identical m
effselections as the SRAs. The CR is defined similarly to the SR
selection (as documented in table
1
); however, exactly one signal lepton (either e or µ) with
p
T> 20 GeV is required in the final state. Furthermore, the selections used to isolate the
Higgs boson in the SRAs, namely the ∆R
max(b, b), ∆R
max-min(b, b) and m(h
cand) selections,
are not applied in order to increase the number of events in the CR. The leading b-jet p
Tselection is lowered to > 100 GeV to further increase the number of events in the region,
and a selection on the transverse mass of m
T> 20 GeV is applied to suppress misidentified
leptons. Such selections result in pure t¯
t CRs, with t¯
t contributing more than 80% of the
total SM contribution in each of the CRs. The fraction of top-quark pairs produced in
association with b-quarks is equivalent between CRs and SRs, and accounts for about 70%
of the total t¯
t background. Figure
4a
presents the distribution of m(h
cand) in CRA1`, and
shows that this variable is well modelled.
A zero-lepton validation region (VRA0`) is also defined, and split according to the
same m
effthresholds as the SRAs and CRAs. This VR is used to validate the modelling of
the t¯
t background when extrapolating from the one-lepton CRs to zero-lepton regions. The
selections are based upon the SR selections but the VRs are orthogonal due to the b-jet
multiplicity selection, which requires exactly three b-jets. Additionally, the ∆R
max(b, b),
∆R
max-min(b, b) and m(h
cand) selections are not applied in this region. A selection of S
< 22 is applied to ensure this region is orthogonal to the SRC regions.
6.2
B-type CR and VR definitions
For the B-type t¯
t CR (CRB1`), a similar method of using a one-lepton region enriched in t¯
t
is implemented. The SR selections (as documented in table
2
) are applied, and additionally
exactly one signal lepton with p
T> 20 GeV is required. The m(h
cand1, h
cand2)
avgselection
is dropped to increase the number of events in the region, and the |∆φ(j
1, E
Tmiss)| selection
is loosened to > 2.2. Similarly to the A-type CR, a selection of m
T> 20 GeV is applied
to suppress misidentified leptons. These selections result in a pure CR with 80% of the
total expected SM background consisting of t¯
t. Figure
4b
presents the m(h
cand1, h
cand2)
avgdistribution in this region; it is shown to be well modelled.
The associated VR (VRB0`) is defined in a similar manner to the A-type VR, with
selections similar to those of the SRB region, but an exclusive b-jet multiplicity selection
JHEP12(2019)060
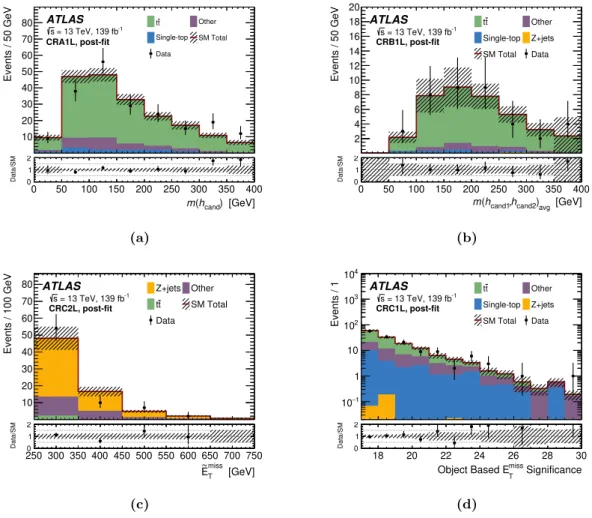
0 50 100 150 200 250 300 350 400 ) [GeV] cand h ( m 0 1 2 Data/SM 10 20 30 40 50 60 70 80 Events / 50 GeV t t Other Single-top SM Total Data ATLAS -1 = 13 TeV, 139 fb s CRA1L, post-fit (a) 0 50 100 150 200 250 300 350 400 [GeV] avg ) cand2 h , cand1 h ( m 0 1 2 Data/SM 2 4 6 8 10 12 14 16 18 20 Events / 50 GeV t t Other Single-top Z+jets SM Total Data ATLAS -1 = 13 TeV, 139 fb s CRB1L, post-fit (b) 250 300 350 400 450 500 550 600 650 700 750 [GeV] miss T E ~ 0 1 2 Data/SM 10 20 30 40 50 60 70 80 Events / 100 GeV Z+jets Other t t SM Total Data ATLAS -1 = 13 TeV, 139 fb s CRC2L, post-fit (c) 18 20 22 24 26 28 30 Significance miss T Object Based E 0 1 2 Data/SM 1 − 10 1 10 2 10 3 10 4 10 Events / 1 t t Other Single-top Z+jets SM Total Data ATLAS -1 = 13 TeV, 139 fb s CRC1L, post-fit (d)Figure 4. Distributions of (a) m(hcand) in CRA1`, (b) m(hcand1, hcand2)avg in CRB1`, (c) ˜EmissT
in CRC2`, and (d) S in CRC1` after the background-only fit; ratios of data to SM predictions are reported in the bottom panels. All uncertainties as defined in section 7 are included in the uncertainty bands of the top and bottom panels in each plot. The backgrounds which contribute only a small amount (diboson, W +jets and t¯t +W/Z/h) are grouped and labelled as ‘Other’. Overflow events which do not fall into the axis range are placed into the rightmost bin.
of exactly three b-jets. Additionally, the selections used to reconstruct the Higgs bosons
in the event are dropped to enhance the number of events in the region. A selection of S
< 22 is also applied to ensure this region is orthogonal to the C-type SRs.
6.3
C-type CR and VR definitions
Two CRs are defined for the C-type SRs, one to constrain the Z+jets background (CRC2`)
and one to constrain the backgrounds associated with top quarks, t¯
t and single top
(CRC1`). A single normalisation parameter is used to constrain both the t¯
t and single-top
backgrounds, while the Z+jets background is constrained with an additional normalisation
parameter. These CRs are based upon the SR shown in table
3
, but are orthogonal due to
the different lepton multiplicities required.
JHEP12(2019)060
The CRC2` requires two same-flavour (SF) opposite-sign (OS) leptons, with invariant
mass in the Z-mass window. The leading two leptons are required to have p
T> 27 GeV
and p
T> 20 GeV respectively. To imitate the E
Tmissselection in the SR, a selection of
˜
E
missT
> 250 GeV is utilised. For this region the selections on S are dropped to enhance
the number of events in the region. Figure
4c
shows the ˜
E
missT
distribution in this region.
The CRC1` region used to constrain the top-quark-related backgrounds requires one signal
lepton with p
T> 20 GeV. A selection of S > 17 is applied. Similarly to the A- and B-type
CRs, a selection of m
T> 20 GeV is applied to remove the multi-jet contribution with fake
or non-prompt leptons. Figure
4d
presents the S distribution in this region.
Two zero-lepton VRs are defined to validate the extrapolation from CR to SR based on
the SR selections. A VR with zero leptons and two b-jets (VRC0`-Z) with S ∈ [20, 22] and
E
missT
∈ [250, 600] GeV ensures a region orthogonal to the SR, but with a large contribution
from the Z+jets process. A second VR is used to validate the modelling of the t¯
t and
single-top backgrounds (VRC0`-T); a selection of zero leptons, S ∈ [15, 22] and an inverted
selection on the min ∆φ(jet
1−4, p
missT
) ∈ [0.2, 0.4] is applied to ensure orthogonality.
6.4
Summary of CR and VR results
A full overview of the control and validation regions used in the analysis can be found in
table
4
. The control region pre-fit yields and fitted normalisation factors µ
bkgfor the A-,
B-and C-type regions are presented in figure
5a
. All µ values are consistent with unity, within
2σ of the normalisation uncertainty, suggesting the modelling of the key SM background
processes is already good before performing the fit. Figure
5b
presents the observed yields,
post-fit background estimates and significance [
91
] for the A-, B- and C-type validation
regions. The background-only fit estimates are in good agreement with the data in these
regions, and the post-fit expectation is within 1σ of the central value for all regions.
JHEP12(2019)060
CRA1l-L CRA1l-M CRA1l-H CRB1l CRC1l CRC2l
0.8 1 1.2 bkg µ 1 10 2 10 3 10 4 10 Events t t Z+jets SM Total Other Single-top Data ATLAS -1 = 13 TeV, 139 fb s CRs, pre-fit (a)
VRA0l-L VRA0l-M VRA0l-H VRB0l VRC0l-T VRC0l-Z
2 − 0 2 Significance 1 10 2 10 3 10 4 10 5 10 Events t t Other SM Total Z+jets Single-top Data ATLAS -1 = 13 TeV, 139 fb s VRs, post-fit (b)
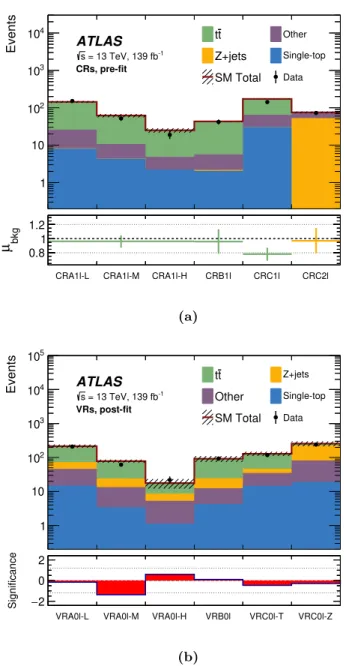
Figure 5. (a) Control region event pre-fit event yields compared with SM MC predictions (top) and post-fit µ scale factors (bottom) for the A-, B- and C-type regions. The uncertainty in the µ factors and the total expected yield include statistical and systematic uncertainties as introduced in section7. For the A-type regions, since the fit is performed in the meff intervals, the normalisation
is applied to all bins equally. (b) Results of the background-only fit extrapolated to VRs for the A-, B- and C-type regions. The normalisation of the backgrounds is obtained from the fit to the CRs. The upper panel shows the observed number of events and the predicted background yields. Statistical and systematic uncertainties as introduced in section 7 are included in the uncertainty band. The lower panel shows the significance in each VR. The significance calculation is performed as described in ref. [91]. The minor backgrounds (diboson, W +jets and t¯t +W/Z/h) are grouped and labelled as ‘Other’.
JHEP12(2019)060
Con
trol
Re
gion
s
V
alidation
Regions
V
ariable
Units
CRA1
`
CRB1
`
CR
C1
`
CR
C2
`
VRA0
`
VRB0
`
VR
C0
`-T
VR
C0
`-Z
E
miss TT
rigger
3
3
3
—
3
3
3
3
Lepton
T
rigger
—
—
—
3
—
—
—
—
E
miss T[Ge
V]
>
250
>
300
>
250
<
70
>
350
>
350
>
250
∈
[250
,600]
min[∆
φ
(jet
1 − 4,E
miss T)]
[rad]
—
—
—
>
0
.2
>
0
.4
>
0
.4
∈
[0
.2
,0
.4]
>
1.
2
N
leptons(baseline)
=
1
=
1
=
1
=
2
=
0
=
0
=
0
=
0
N
leptons(signal)
=
1
=
1
=
1
=
2(SF
OS
)
—
—
—
—
p
T(`
1)
[Ge
V]
>
20
>
20
>
20
>
27
—
—
—
—
p
T(`
2)
[Ge
V]
—
—
—
>
20
—
—
—
—
m
T[Ge
V]
>
20
>
20
>
20
—
—
—
—
—
m
``[Ge
V]
—
—
—
∈
[86
,106]
—
—
—
—
τ
veto
—
3
—
—
3
3
—
—
N
jets≥
6
≥
4
≥
4
≥
4
≥
6
≥
4
≥
4
≥
4
N
b -jets≥
4
≥
4
≥
3
≥
3
=
3
=
3
≥
3
=
2
p
T(b
1)
[Ge
V]
>
100
—
—
—
>
100
—
—
—
p
T(j
1)
[Ge
V]
—
>
350
—
—
—
>
350
—
—
Leading
jet
not
b-tagged
—
3
—
—
—
3
—
—
|∆
φ
(j
1,E
miss T)|
[rad]
—
>
2
.2
—
—
—
>
2
.8
—
—
˜ E
miss T[Ge
V]
—
—
—
>
250
—
—
—
—
S
—
—
>
17
—
<
22
<
22
∈
[15
,22]
∈
[20
,22]
m
eff[T
eV]
>
1
.0
>
1
.0
—
—
>
1
.0
>
1
.0
—
—
T able 4. Summary of all con trol and validation region defin itions used in the analysis.JHEP12(2019)060
7
Systematic uncertainties
Several sources of experimental and theoretical systematic uncertainty on the signal and
background estimates are considered in this analysis. Their impact is reduced by fitting the
event yields and normalising the dominant backgrounds in the CRs defined with kinematic
selections resembling those of the corresponding SRs (see section
6
). Uncertainties due
to the numbers of events in the CRs are also introduced in the fit for each region. The
magnitude of the contributions arising from detector, theoretical modelling and statistical
uncertainties are summarized in table
5
.
Dominant detector-related systematic uncertainties arise from the b-tagging efficiency
and mis-tagging rates, and from the jet energy scale and resolution. In SRA and SRB,
the contributions of these uncertainties are almost equivalent. In SRC, the b-tagging
un-certainty is dominant. The systematic unun-certainty on the b-tagging efficiency ranges from
4.5% for b-jets with p
T∈ [35, 40] GeV up to 7.5% for b-jets with high p
T(> 100 GeV). The
b-tagging uncertainty is estimated by varying the η-, p
T- and flavour-dependent scale factors
applied to each jet in the simulation within a range that reflects the systematic uncertainty
in the measured tagging efficiency and mis-tag rates in data [
81
]. The uncertainties in the
jet energy scale and resolution are based on their respective measurements in data [
77
,
92
].
The uncertainties associated with lepton reconstruction and energy measurements have
a negligible impact on the final results; however, the lepton, photon and jet-related
uncer-tainties are propagated to the calculation of the E
missT
, and additional uncertainties due to
the energy scale and resolution of the soft term are included in the E
missT
.
The systematic uncertainties related to the modelling of the energy of jets and leptons
in the simulation are propagated to S. No additional uncertainty on the energy resolution
is applied, as the resolutions are taken to be the maximum of the parameterised data and
simulation resolutions when performing the calculation for both data and MC simulation.
Uncertainties in the modelling of the SM background processes from MC simulation
and their theoretical cross-section uncertainties are also taken into account. The dominant
uncertainties in SRA and SRB arise from theoretical and modelling uncertainties of the
t¯
t background. They are computed as the difference between the predictions from
nomi-nal samples and those from additionomi-nal samples differing in hard-scattering generator and
parameter settings, or by using internal weights assigned to the events depending on the
choice of renormalisation and factorisation scales, initial- and final-state radiation
param-eters, and PDF sets. The impact of the PS and hadronisation model is evaluated by
com-paring the nominal generator with a POWHEG sample interfaced to HERWIG 7 [
93
,
94
],
using the H7UE set of tuned parameters [
94
]. To assess the uncertainty due to the choice
of hard-scattering generator and matching scheme, an alternative generator setup using
aMC@NLO+PYTHIA8 is employed. It uses the shower starting scale, µ
q= H
T/2, where
H
Tis defined here as the scalar sum of the p
Tof all outgoing partons.
The dominant uncertainties in SRC arise from the MC modelling of the Z+jets process,
followed by the t¯
t and single-top modelling. The Z+jets (as well as W+jets) modelling
uncer-tainties are estimated by considering different merging (CKKW-L) and resummation scales
JHEP12(2019)060
Region
SRA
SRB
SRC
Total background expectation
17.1
3.3
37.9
Total background uncertainty
2.8
(16%)
0.9
(27%)
6.2
(16%)
Systematic, experimental
1.4
(8%)
0.3
(10%)
3.0
(8%)
Systematic, theoretical
2.3
(13%)
0.6
(18%)
3.2
(8%)
Statistical, MC samples
0.7
(4%)
0.4
(12%)
2.0
(5%)
Table 5. Expected background event yields and dominant systematic uncertainties on background estimates in the A-type (inclusive), B-type and C-type (inclusive) regions. Individual uncertainties can be correlated, and do not necessarily add up quadratically to the total background uncertainty. The percentages show the size of the uncertainty relative to the total expected background.
variations of factorisation and renormalisation scales in the ME. The latter have been
evalu-ated using 7 point-variations, changing the renormalisation and factorisation scales up and
down by factors 0.5 and 2, such that when one scale is up the other is down, and vice-versa.
For the SUSY signal processes, both the experimental and theoretical uncertainties in
the expected signal yield are considered. Experimental uncertainties are found to be 6–36%
across the mass plane with fixed LSP mass for A-type SRs, and 4–40% for C-type SRs.
For models where ∆m( ˜
χ
02
, ˜
χ
01) = 130 GeV is assumed, scenarios where SRB is relevant have
uncertainties of 11–37%.
In all SRs, the dominant uncertainty on the signal yields is found to be from the
b-tagging efficiency.
Theoretical uncertainties in the approximate NNLO+NNLL cross-section are
calcu-lated for each SUSY signal scenario, and are dominated by the uncertainties in the
renor-malisation and factorisation scales, followed by the uncertainty in the PDFs. These are
7–17% for bottom-squark masses in the range between 400 GeV and 1500 GeV. Additional
uncertainties in the acceptance and efficiency due to the modelling of ISR and CKKW
scale variations in SUSY signal MC samples are also taken into account, and contribute
up to ∼10%.
8
Results and interpretation
The event yields for all SRs are reported in table
6
. The SM background expectations
resulting from background-only fits are also reported showing statistical plus systematic
uncertainties. The largest background contribution in A-type and B-type SRs arises from
t¯
t production, whilst the contribution from Z → ν ¯
ν production in association with
b-quarks is largest in the C-type SRs, with sub-dominant contributions from the t¯
t and
single-top processes. Other background sources are t¯
t +W/Z, t¯
t +h, diboson and W +jets
production. The results are also summarised in figure
6
, where the significances for each of
the SRs are also presented. No significant deviations are observed between expected and
observed yields in all signal regions considered.
JHEP12(2019)060
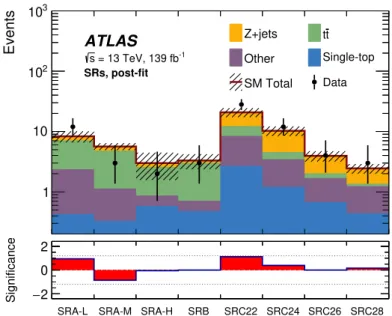
SRA-L SRA-M SRA-H SRB SRC22 SRC24 SRC26 SRC28 2 − 0 2 Significance 1 10 2 10 3 10 Events Z+jets Other SM Total t t Single-top Data ATLAS -1 = 13 TeV, 139 fb s SRs, post-fit
Figure 6. Results of the background-only fit extrapolated to all SRs. The normalisation of the backgrounds is obtained from the fit to the CRs. The upper panel shows the observed number of events and the predicted background yields. The backgrounds which contribute only a small amount (diboson, W +jets and t¯t +W/Z/h) are grouped and labelled as “Other”. All uncertainties defined in section7 are included in the uncertainty band. The lower panel shows the significance in each SR. The significance calculation is performed as described in ref. [91].
Figure
7
shows comparisons between the observed data and the post-fit SM predictions
for some relevant kinematic distributions for the inclusive SRA, SRB and SRC selections
before selection requirements are applied on the quantity shown. The expected
distribu-tions for scenarios with different bottom squark, ˜
χ
02
and ˜
χ
01masses (depending on the SR
considered) are shown for illustrative purposes.
The CL
stechnique [
95
] is used to place 95% Confidence Level (CL) upper limits
on event yields from physics beyond the SM (BSM) for each signal region. The
profile-likelihood-ratio test statistic is used to exclude the signal-plus-background hypothesis for
specific signal models. When normalised to the integrated luminosity of the data sample,
results can be interpreted as corresponding upper limits on the visible cross-section, σ
vis,
defined as the product of the BSM production cross-section, the acceptance and the
selec-tion efficiency of a BSM signal. When calculating the model-independent upper limits of
the A- and C-type regions, only the inclusive SR selection is used. Table
7
summarises the
observed (S
95obs