THE USE OF RETAIL STRUCTURED PRODUCTS AND
THEIR APPLICATIONS IN TURKEY
Z. EREN KOÇYİĞİT
108673006
İSTANBUL BİLGİ ÜNİVERSİTESİ
SOSYAL BİLİMLER ENSTİTÜSÜ
BANKACILIK ve FİNANS YÜKSEK LİSANS PROGRAMI
Prof. Dr. NURGUL CHAMBERS
2010
ii
The Use of Retail Structured Products and Their
Applications in Turkey
Yapılandırılmış Ürünlerin Kullanımı ve Türkiye’deki
Uygulamaları
Z. Eren Koçyiğit
108673006
Prof. Dr. Nurgül Chambers
: ...
Yrd. Doç. Dr. Cenktan Özyıldırım : ...
Öğr. Gör. Kenan Tata
: ...
Tezin Onaylandığı Tarih
: ...
Toplam Sayfa Sayısı
: 211
Anahtar Kelimeler (Türkçe) Anahtar Kelimeler (İng.) 1) Yapılandırılmış Ürünler 1) Structured Products 2) Anapara Korumalı Fonlar 2) Capital Protected Funds 3) Tam Teminatlı Opsiyon 3) Dual Currency Deposit
4) Tünel Mevduat 4) Range Accrual
iii Abstract
Innovation process of the financial markets resulted in introduction of new products to the retail investors in response to these investors’ different needs. First of all, derivatives were offered by the financial institutions to the retail investors as an alternative to such conventional spot products as stocks, bonds and commodities. Due to the fact that the retail investors weren’t satisfied and started to seek alternative instruments again, issuers started to introduce new instruments. These instruments are called
structured products and formed by the combination of several products that already exist in financial markets. These structured products have new-generation innovative, tailor made structures consisting of more than a single product in order to cater the special needs of the retail investors. This study will thoroughly examine the detailed use of these innovative products in the financial markets; especially in Turkish context. In addition to
looking over their usage, their main characteristics and features will be analyzed for different types of products from different markets. Throughout the study, structured products will be analyzed in either Turkish context or in rest of the world. Findings through the chapters will be compared and discussed at the end of the study.
iv Özetçe
Finansal piyasalardaki yenilikçi gelişmeler sonucu, bireysel
yatırımcıların farklı taleplerine cevap verebilecek yeni ürünler oluşmaya başlamıştır. Öncelikle finansal kurumlarca, hisse senedi, bono ve emtia gibi geleneksel yatırım ürünlerine alternatifi olması amaçlı türev ürünler bireysel yatırımcılara sunulmuştur. Bireysel yatırımcıların bu ürünlerden de yeteri kadar tatmin olmaması ve yeni arayışlara girmesi sonucu, bu yatırımcılara yönelik başka ürünler geliştirilmeye başlanmıştır. Bu ürünlere
yapılandırılmış ürünler denilmektedir ve zaten finansal piyasalarda var olan ürünlerin bir araya getirilmesiyle oluşturulmuştur. Bu ürünler birden fazla ürünün bir araya gelmesiyle oluşarak, terzi işi ve yenilikçi yapılarıyla bireysel yatırımcıların farklı taleplerini karşılamayı amaçlar. Bu çalışma, bu yenilikçi finansal ürünlerin kullanımlarını,Türkiye piyasası başta olmak üzere ayrıntılı şekilde ele alarak incelemeyi amaçlamaktadır. İlgili ürünlerin kullanımları incelenirken, farklı piyasalardaki farklı ürünlerin başlıca özellikleri de ele alınacaktır. Çalışma boyunca tüm bu incelemeler hem Türkiye piyasayı hem de yurtdışındaki piyasalar bazında yapılacaktır. İncelemeler sonucunda elde edilen bulgular ve sonuçlar çalışmanın sonunda karşılaştırılarak ele alınacaktır.
v Acknowledgements
First of all, I owe my deepest gratitude to my dissertation advisor Prof. Dr. Nurgül Chambers for giving me the opportunity to work on this subject. Without her guidance and inspiration this dissertation would not have been possible.
I also want to express gratitude to my other advisor Prof.Dr. Oral Erdoğan for the assistance he provided. I am also thankful to Okan Aybar for all of his support.
I am also indebted to all of my colleagues in Isbank Private Banking Sales Department, especially Atakan Gedik, Arda Ertem, Elif Ağır, Serhat Can and İlker Yumuşak who have been supporting me during the
completion of this dissertation.
I also thank to Isbank Treasury Department (especially Mehmet Turk) and Isbank Capital Markets Department (especially Duygu Sirikci) for the data and assistance they provided for this study.
I am also grateful to Banking and Finance Program’s Assistant Hakan Sengoz for all the assistance he provided.
Finally I would like thank all of my family especially my mother and friends for their enthusiastic supports during the completion process of this study. Special thanks go to Ipek Kiciman for her endless support and inspiration.
vi Table of Contents
1. INTRODUCTION ... 1
2. LITERATURE REVIEW ... 4
2.1. Studies About Regional Structured Products Markets ... 4
2.1.1. North American Markets ... 5
2.1.1.1. US Market ... 5 2.1.1.2. Canadian Market ... 8 2.1.2. European Markets ... 8 2.1.2.1. Swiss Market ... 8 2.1.2.2. German Market ... 10 2.1.2.3. Dutch Market ... 13
2.2. Studies About Structured Products in General ... 13
2.2.1. Studies About Anatomy of Structured Products ... 13
2.2.2. Studies About Pricing of Structured Products ... 16
2.2.3. Studies About Regulation of Structured Products ... 18
2.3. Overview of Literature Review ... 19
3. STRUCTURED PRODUCTS ... 20
3.1. Definition of Structured Products ... 20
3.2. Composition & Design of Structured Products ... 22
3.3. Types of Structured Products ... 25
3.3.1. Structured Products and Their Market ... 25
3.3.1.1. Structured Products in OTC Markets ... 25
3.3.1.2. Structured Products in Organized Markets ... 26
3.3.2. Structured Products and Their Underlying Instrument ... 26
3.3.3. Structured Products and Their Risk Level ... 28
3.3.3.1. Capital Protected Products ... 29
vii
3.3.3.3. Participation Products ... 38
3.3.3.4. Leverage Products ... 50
3.4. Pricing of Structured Products ... 57
3.4.1. Black & Scholes Option Pricing Method ... 58
3.4.2. Pricing a Structured Product with Black & Scholes Model ... 63
3.4.2.1. Pricing a Reverse Convertible (Exchangeable) ... 64
3.4.2.2. Pricing a Discount Certificate ... 65
3.4.2.3. Pricing a Outperformance Certificate ... 66
3.5. Advantages and Disadvantages (Risks) of Structured Products ... 67
3.5.1. Advantages of Structured Products ... 68
3.5.2. Disadvantages & Risks of Structured Products ... 70
4. RETAIL STRUCTURED PRODUCTS IN THE WORLD ... 74
4.1. Retail Structured Products in All Regions ... 74
4.2. Retail Structured Products in European Market ... 79
4.2.1. Terms of Retail Structured Products in European Market ... 79
4.2.2. Underlying Asset Classes of Retail Structured Products in European Market ... 80
4.2.3. Development of Retail Structured Products Issued and Sold in European Market ... 83
4.2.4. Important Countries for Retail Structured Products in Europe ... 84
4.3. Overview of Market Reviews ... 86
5. RETAIL STRUCTURED PRODUCTS IN TURKEY ... 87
5.1. Current Situation of Retail Structured Products in Turkey ... 87
5.2. Types of Retail Structured Products in Turkey ... 89
5.2.1. Structured Funds (Capital Protected/Capital Guaranteed Funds - CP/CG Funds) ... 89
5.2.1.1. Definition of CP/CG Funds ... 90
5.2.1.2. Composition and Operating Process of CP/CG Funds in Turkey ... 91
viii
5.2.1.3. Offered CP/CG Funds in Turkey ... 100
5.2.1.4. Advantages & Disadvantages of CP/CG Funds in Turkey ... 111
5.2.1.5. Taxation of CP/CG Funds in Turkey ... 113
5.2.1.6. Things to be Considered Before Investing in CP/CG Funds ... 114
5.2.2. Structured Deposits ... 114
5.2.2.1. Definition, Composition and Types of Structured Deposits ... 115
5.2.2.2. Structured Deposits in Turkey ... 117
5.2.2.3. Most Common Types of Structured Deposits in Turkey ... 118
5.2.2.4. Advantages & Disadvantages of Structured Deposits in Turkey ... 152
5.2.2.5. Taxation of Structured Deposits in Turkey ... 154
5.2.2.6. Things to be Considered Before Investing in Structured Deposits ... 154
5.3. Conditions Regarding the Development of Retail Structured Products in Turkey ... 155
5.3.1. Conditions Influencing the Development of Retail Structured in Positive Manner ... 155
5.3.2. Conditions Influencing the Development of Retail Structured in Negative Manner ... 160
6. CONCLUSION ... 166
References ... 172
Appendix A: Most Common Types of Exotic Options ... 181
Appendix B: Structured Retail Products in Regional Markets ... 188
ix List of Tables
Table 3.1: Direct Investment - Reverse Convertible Comparison ... 37
Table 4.1: Total Number of Retail Structured Products Issued Across the World from 1995 to March 2010... 75
Table 4.2: Total Volume of Retail Structured Products Sold Across the World from 1995 to March 2010... 76
Table 4.3: The Terms of Retail Structured Products in Numbers and Volumes from 2006 till March 2010 in European Market ... 79
Table 4.4: Underlying Asset Classes of Retail Structured Products in Europe between 2006 and March 2010 ... 81
Table 4.5: Retail Structured Products Issued and Sold between 2006 and March 2010 in European Market ... 83
Table 4.6: Number of Products Issued and Volume of Products Sold in European Countries btw. 1995 and 2010 March ... 85
Table 5.1: Structured Funds in Turkey between 2008 and 2010 March .. 101
Table 5.2: USD Call / TL Put DCD Example ... 123
Table 5.3: TL Call / USD Put DCD Example ... 127
Table 5.4: USD/TL Range Accrual Example ... 137
Table 5.5: USD/TL Range Accrual Example: 1st Scenario ... 138
Table 5.6: USD/TL Range Accrual Example: 2nd Scenario... 139
Table 5.7: USD/TL Double No Touch Example ... 141
Table 5.8: USD/TL Double No Touch Example: 1st Scenario ... 143
Table 5.9: USD/TL Double No Touch Example: 2nd Scenario ... 144
Table 5.10: USD/TL Wedding Cake Example ... 147
Table 5.11: USD/TL Wedding Cake Example: 1st Scenario ... 149
Table 5.12: USD/TL Wedding Cake Example: 2nd Scenario... 150
Table 5.13: USD/TL Wedding Cake Example: 3rd Scenario ... 151
x
Table 5.15: Turkish Investors’ Investment Breakdown ... 156
Table B.1: Retail Structured Products in Europe since 1995 ... 189
Table B.2: Tranche Products Issues and Volumes in European Market between 2006 and 2010 ... 189
Table B.3: Outstanding Products Issues and Volumes at Year Ends in European Market between 2006 and 2010 ... 189
Table B.4: Retail Structured Products in North America since 1995 ... 190
Table B.5: Tranche Products Issues and Volumes in North American Market between 2006 and 2010 ... 190
Table B.6: Outstanding Products Issues and Volumes at Year Ends in North American Market between 2006 and 2010 ... 190
Table B.7: Retail Structured Products in Asia & Pacific since 1995 ... 191
Table B.8: Tranche Products Issues and Volumes in Asia & Pacific Market between 2006 and 2010 ... 191
Table B.9: Outstanding Products Issues and Volumes at Year Ends in Asia & Pacific Market between 2006 and 2010 ... 191
Table B.10: Retail Structured Products in Latin America since 1995 ... 192
Table B.11: Tranche Products Issues and Volumes in Latin American Market between 2006 and 2010 ... 192
Table B.12: Outstanding Products Issues and Volumes at Year Ends inLatin American Market between 2006 and 2010 ... 192
Table C.1: Capital Protected Products ... 194
Table C.2: Yield Enhancement Products ... 195
Table C.3: Participation Products ... 197
xi List of Figures
Figure 3.1: Composition of a Basic Structured Product ... 22
Figure 3.2: Structured Products in Risk & Return Graph ... 23
Figure 3.3: Structured Products and Their Risk Levels ... 28
Figure 3.4: Composition of Capital Protected Products ... 30
Figure 3.5: A Capital Protected Product Example ... 31
Figure 3.6: A Discount Certificate Example ... 34
Figure 3.7: Payoff Graph of a Reverse Convertible... 36
Figure 3.8: Payoff Graph of an Open End Certificate ... 39
Figure 3.9: Payoff Graph of an Outperformance Certificate ... 42
Figure 3.10: Payoff Graph of a Bonus Certificate ... 44
Figure 3.11: Payoff Graph of an Outperformance Bonus Certificate ... 47
Figure 3.12: Payoff Graph of a Call Warrant... 53
Figure 3.13: Payoff Graph of a Put Warrant ... 55
Figure 4.2: Regional Allocation of Total Number of Retail Structured Products Issued Across the World from 1995 to March 2010 .. 75
Figure 4.2: Regional Allocation of Total Volume of Retail Structured Products Sold Across the World from 1995 to March 2010 ... 76
Figure 5.1: Components of Structured Funds (CP/CG Funds) ... 91
Figure 5.2: Structured Funds (CP/CG Funds) in Turkey between 2008 and 2010 March ... 108
Figure 5.3: Total Volume of Structured Funds (CP/CG Funds) Sold in Turkey between 2008 and 2010 March ... 109
Figure 5.4: Structured Funds (CP/CG Funds) Volume Development in Turkey between 2008 and 2010 March ... 110
Figure 5.5: Composition of Structured Deposits ... 115
Figure 5.6: Payoff Graph of a USD Call / TL Put DCD Example ... 126
xii Figure 5.8: Maturity & Risk Level/Premium Relationship in DCD ... 132 Figure 5.9: Strike Price & Risk Level/Premium Relationship in DCD ... 133 Figure 5.10: Contrary Bank Transaction... 134 Figure 5.11: Wedding Cake Payoff Graph ... 146 Figure 5.12: Up to 1 Month Average TL/USD/EUR Deposit
Interest Rates ... 157 Figure 5.13: Policy Interest Rates ... 161
xiii List of Abbreviations
BC: Bonus Certificates
BFI: Basic Financial Instrument
BULS: Bullish Underlying Linked Securities CP/CG: Capital Protected/Capital Guaranteed CPN: Capital Protected Notes
DC: Discount Certificates DCD: Dual Currency Deposit
DRC: Discount Reverse Convertibles ELC: Endless Leverage Certificates
ELCD: Equity-Linked Certificates of Deposit FX: Foreign Exchange
IPCD: Index Powered Certificate of Deposit IPCD: Index Powered Certificate of Deposit MICD: Market Index Certificates of Deposit OBC: Outperformance Bonus Certificates OC: Outperformance Certificates OEC: Open End Certificates OTC: Over the Counter
RES: Reverse Exchangeable Securities RC: Reverse Convertibles
RCB: Reverse Convertible Bonds SEP: Structured Equity Products
SSPA: Swiss Structured Products Association SPIN: S&P 500 Index Note
1
1. INTRODUCTION
The necessity of structured products arises in financial markets in order to meet different needs of the investors. Low interest rates throughout the world accelerated their usage which in returned courage more financial innovation and reshaped customer preferences.
Structured products are designed to meet investors’ demands in different combinations of instruments both in spot and in options markets. There exists unlimited ways to design structured products; which enables them to be defined as “tailor-made”.
The subject of structured products is comprehensive when all types of these products are considered. This study will try to focus on retail
structured products, traded by the retail investors in the market, for speculative purposes. In the study, retail structured products will be examined firstly in global context and followed by Turkish market. Since the entire study will be about retail usage of the structured products, hereafter term ‘structured products’ will be mentioned through the study to state retail structured products.
The main purpose of the study will be to explain the usage of structured
products by examining their main features and characteristics. From this perspective, study will analyze the main features of structured products including the definitions, compositions, main types, risks, advantages and the disadvantages.
Study aims to examine the usage of structured product in all financial markets, focusing in the Turkish one. In this examination, one of the most important purposes of the study will be to analyze the structured products’ current situation among other financial instruments and their future
2 development in Turkey. As a whole, study will try to make a contribution to the literature about the use of retail structured products in financial markets, especially in Turkish market.
Study will begin with a through literature review (chapter 2) on the
subject and continue by observing the main features and characteristics of structured products in chapter 3. This chapter will observe the definition, composition, main types, advantages, disadvantages and risks of structured products.
Beginning with the 4th chapter, study will start to emphasize the use of structured products in different regions such as Europe, North America, Asia & Pacific and Latin America. Within this chapter; number of products issued and volume of products sold will be determined for the European Market according to types, terms and underlying asset classes of these products. Furthermore, emphasis will be given to countries where structured products constitute a significant market share among other derivatives. Conclusions derived out of the findings will be presented at the end of the chapter.
Fifth chapter will deal with the retail structured products in Turkey by dividing them into 2 groups; structured funds and structured deposits. Firstly, current situation of Turkish market about structured products will be analyzed. Then structured funds in Turkey will be examined according to their definition, composition, advantages and disadvantages. After this examination an analysis covering 66 structured funds, introduced into market by Turkish banks between 2008 January and 2010 March will be made. After this analysis, main features, impacts and most common types of structured deposits (including Dual Currency Deposit, Range Accrual, Double No Touch and Wedding Cake); will be emphasized with simulated examples. At the end of this chapter, the conditions regarding the
3 development of retail structured products in Turkey in conjunction with pros and cons will be detailed.
At the final chapter, all the findings and outcomes that are abstracted through the whole study will be presented briefly, as an attempt to explain the use of retail structured products and their applications in Turkey. In this conclusion chapter, structured products market and its current situation, especially in Turkey, will be analyzed in order to discuss the extension of developments in the future.
4
2. LITERATURE REVIEW
In this chapter academic studies that were made in the past will be analyzed. Within the chapter these studies will be examined in 2 parts; studies made for specific markets and studies made for structured products in general.
In both parts; it can be realized that most of the academic literature deal with the pricing (valuation) of structured products. In these studies;
researches were carried out in the areas of pricing and back testing of structured products in the primary and secondary markets. In this literature review, different types of products are taken into account, like discount certificates, reverse convertibles, equity linked certificates, market index certificates, index notes and etc…
Chapter will start by examining the studies that were made about some specific markets.
2.1. Studies About Regional Structured Products Markets
In this section studies that were made about different markets will be examined. Most of the studies were made about 2 regions; North America and Europe.
From North America most of the studies were made about US and Canada. From Europe most of the studies were made about Germany, Switzerland and Holland.
Until now there is not an academic study that was made about Turkish market.
5 2.1.1. North American Markets
2.1.1.1. US Market
Although the first structured product was seen in US market back in 1987, there are not much academic studies made for this market. Also most of the studies that are exist in the literature go back to a time when these structured products first launched. (Wohlwend et al, 2003).
Chen/Kensinger (1990) investigated Market Index Certificates of Deposit (MICD) for 2 months period in 1988 and 1989 in the US market. Structured product that they deal in their study was MICD which has characteristics of paying a guaranteed minimum interest and a variable interest that is linked to the performance of the S&P 500. In their study they used a sample of 18 MICD issued in January 1988 and 25 MICD issued in January 1989 by Chase Manhattan and Murray Savings.
After they compared the implied volatility of S&P 500 option and option component of the MICDs, they found out that; there are
inconsistencies between the pricing of the same type of MICDs among issuers and there are also inconsistencies between the pricing of different types of MICDs offered by the same issuer.
Chen/Sears (1990) investigated S&P 500 Index Note (SPIN) issued by Salomon Brothers in US market. SPIN which they are investigated can be told as a similar product to the MICDs, but exchange-traded. This product is a %2 coupon bond with 4 year maturity which pays to its holder at maturity; (the principal amount + accrued interest + (((S&P 500 first level - S&P 500 last level) / (S&P 500 first level)) * Predetermined Multiplier)). In other words despite the principal and accrued interest paid by the product; this product also provides participation to its investor into the performance of S&P 500 index by a predetermined ratio. From this payoff characteristics of
6 the product it can be told that; this product is consisting of a low coupon bond plus long-term plain-vanilla call option on the S&P 500.
Chen/Sears (1990) focused on the market and theoretical prices of this product over three sub periods between September 1986 and December 1987. In their investigation they used ex-post, average implied and long term implied volatility and found out that; product was overpriced about %5 in the first sub period, in the second and third sub periods the product was underpriced. These results were commented by Chen/Sears (1990) as the market was going through a learning process in pricing this unique and new type of security.
Baubonis/Gastineau/Purcell (1993) investigated Equity-Linked Certificates of Deposit (ELCD) in US market which is a similar product to the MICD which was investigated by Chen/Kensinger (1990). However, unlike Chen/Kensinger (1990) and Chen/Sears (1990), they didn’t deal with the pricing of the structured products. They are focused on the performance of ELCD comparing with alternative investments. In their study they compared 5 year maturity ELCD performance with S&P 500 and treasury note performances. They determined the performance of ELCD as the average return of 4 guaranteed, 1 protected product in US market. They determined S&P 500 and treasury note performances from market data relating to the 5-year overlapping periods between 1948 and 1993.
Baubonis/Gastineau/Purcell (1993) found that; 5 year ELCD have a return of %8.33, 5 year investment in S&P has a return of %9.93 and 5 year investment in a treasury note has an average annual return of %5.42. After these results, they told that structured products are more profitable than riskless products and less profitable than a direct market instrument investment. However, after examining the 5-year investment in structured products, Baubonis, Gastineau and Purcell (1993) conclude that these types of products don’t involve the best investment solution for an investor
7 because an investor would almost always have been better off with either a straight equity investment or with a straight fixed-income investment.
Chen and Chen (1995) investigated the valuation of one structured product on the secondary market with no capital protection and offering investors high interest payments in exchange for a cap on the underlying stock’s growth.
Chen and Chen (1995) found that this product is overvalued at some 5 percent.
Edwards and Swidler (2005) investigated Equity-Linked Certificates of Deposit (ELCD) in US market like Baubonis/Gastineau/Purcell (1993). They also focused on the performance of ELCD comparing with alternative investments. In their study they compared the returns of the ELCD with the returns of the S&P 500 index, the 5 year treasury note and the Index
Powered Certificate of Deposit (IPCD). They calculated the return distribution of these instruments by using Monte Carlo Simulation over a period of 1981 to 2004.
Edwards and Swidler (2005) found that; investing in IPCD is better than investing in 5-year Treasury note, investing in ELCD is better than investing in IPCD for the investors. They also found that investing in ELCD do not give equity like returns, that means investing in S&P 500 index is better than investing in ELCD for the investors.
Benet, Giannetti, and Pissaris (2006) investigated
Reverse-Exchangeable Securities (RES) in US market. In their study they examined the pricing of 31 RES that are outstanding in 2003. They aimed to find the right premium in terms of coupon spread in order to obtain the fair value of product.
8 Benet, Giannetti, and Pissaris (2006) found the coupon spread ranging from 4% to 6% and tried to explain this spread in terms of credit risk. Also they argued that RES holders are less exposed to the issuer’s credit risk then the bondholders. However, at the end of their study this explanation seemed incompatible when issuer bank ABN Amro with AAA rating is analyzed because the corresponding credit spread was too low to have a significant influence on the fair values of the RES under their study.
2.1.1.2. Canadian Market
Milevsky and Kim (1997) investigated capped structured products and participating structured products in Canadian market. In their study they compared the pricing of these structured products. They explained capped structured products as the products that provide their investors to participate in any upward movement in the underlying up to a pre-specified cap,
participating structured products as the products that provide their investors to participate in any upward movement in the underlying without any pre-specified cap.
Milevsky and Kim (1997) found that for short term maturities
participating products are preferable to capped structured products, for long term maturities capped structured products are preferable to participating structured products. They also found that both type of products are unfairly priced for customers.
2.1.2. European Markets
2.1.2.1. Swiss Market
There have been three important studies conducted in the Swiss market so far. Schenk and Wasserfallen (1996), Burth, Kraus and Wohlwend (2001) and Grunbichler and Wohlwend (2005)
9 Wasserfallen/Schenk (1996) investigated 13 structured products (10 guaranteed, 3 capital protected) issued in Swiss Market between January 1991 and April 1992. In their study they examined the pricing behavior of these 13 structured products within a period of trading days spanning from 21 to 80 days. Examination of these products’ valuation based on the historical and implied volatility in their study.
Wasserfallen/Schenk (1996) found that these products tend to be overvalued in primary, undervalued in secondary markets. In other words these products are sold over their theoretical values at issue and have a tendency to be undervalued then their theoretical price in the secondary market. They told that the difference between the value at issue and
theoretical value corresponds to the gain of the issuing bank. In their study they also found that with relative errors generally below 10 %, these products are generally fairly priced.
Burth, Kraus and Wohlwend (2001) investigated
275 structured products (199 reverse convertibles and 76 discount certificates) without capital protection, issued in Swiss Market that was outstanding at August 1, 1999. In their study; structured products with concave payoff function (short position in a call option on same asset) analyzed for the first time. Their study depended on testing the price of these structured products.
Burth, Kraus and Wohlwend (2001) found such results from their examinations;
• At all conventional levels of confidence price differences of issuing institutions (15 issuers) are found approximately 1.91% significant • %84 of the total products examined are found as overpriced, %16 of
10 • Their investigations also show that these different valuations caused
by depending on the issuing institution, the product category and the management of the products.
• For the product category; mispricing can be seen in structured products without a coupon payment rather than those with a coupon. • A significant statistical bias was seen in the products price in favour
of the issuing institutions.
Grunbichler and Wohlwend (2005) investigated
192 structured products without capital protection, issued in Swiss Market. In their examination they made a comparison between EUREX options and structured products that are linked to EUREX options.
Grunbichler and Wohlwend (2005) found that in primary market structured products are overvalued about %4.25, in secondary market they are overvalued about %1.65. They also found the misevaluation of these products led to the investor’s disadvantage and a significant decline during the lifetime of these products.
2.1.2.2. German Market
Wilkens, Röder, and Erner (2003) investigated 906 structured products in German Market. In their examination they focused on mainly discount certificates and reverse convertibles that were linked to DAX and NEMAX stock indices and their pricing during a timeframe of 22 days.
Wilkens, Röder, and Erner (2003) found that according to the risk of redemption of shares that is given by the moneyless of the option and the lifetime of the product, issuers are orienting their pricing. The misevaluation of the products are increasing with the moneyless of the option and
11 pricing of structured products can mostly be interpreted because of the issuer.
Stoimenov and Wilkens (2005) investigated plain-vanilla structured products in German Market. In their examination they focused on mainly discount certificates and reverse convertibles and their pricing. In their study they also examined the structured products embedded to barrier or rainbow options where the underlying asset is DAX index or DAX stocks.
Stoimenov and Wilkens (2005) found such results from their examinations;
• In the most of the products they found out that issuing banks charge large implicit premiums in the primary market.
• Product life cycle is determined as an important parameter for secondary market pricing according to their study.
• Structured products with exotic options generate higher premiums compared to the classic products; in other words more complex products provide more premiums.
• They conclude that because of their underlying equity the structured products on average overpriced on primary and secondary markets
Baule, Entrop and Wilkens (2006) investigated exchange traded
structured products in German Market. In their examination they focused on mainly discount certificates and their pricing. They divided their study into 2 parts as; empirical and theoretical parts. In theoretical part they evaluate the pricing of discount certificates by taking the issuer’s credit risk into account. In empirical part they investigated 5 major issuers’ quoted prices of discount certificates on the DAX stocks.
Baule, Entrop and Wilkens (2006) found that because of the credit risk of the issuer is a material part of total margin, compared to earlier studies
12 (conducted for discount certificates in Germany) in their studies total
margins were found lower. According to them the reason of this decline in total margin can be explained by the rising competition among the issuer institutions.
Entrop, Scholz and Wilkens (2007) investigated exchange traded structured products in German Market. In their examination they focused on mainly open-end leverage certificates and their pricing. In their study they didn’t rely on the prices from primary and secondary markets because they thought these prices are determined by the issuers by applying already agreed price-setting formulas. In other words the issuers influence the market price by communicating with each other and determining a price setting formula and announcing this ex-ante formula continuously.
Entrop, Scholz and Wilkens (2007) found such results from their examinations;
• In the course of the product lifetimes, profits of the issuers are increasing.
• The price setting formula favours the issuers strongly. • The issuers can hedge these certificates easily.
• Funding rate spread and the volatility of the underlying can be determined as key factors leading to misevaluation, compared to them interest rates and their dynamics were found negligible.
Wilkens and Stoimenov (2007) investigated leverage structured products in German Market. In their examination they focused on mainly leverage structured products on the DAX and their pricing. They divided their study into 2 parts as; empirical and theoretical parts. In theoretical part they determined the price of leverage products from model values. In empirical part they determined the price of leverage products from issuer quotes.
13 Wilkens and Stoimenov (2007) found such results from their
examinations;
• Value of long and short certificates exceeds theoretical values. • The profit of issuers can be almost risk free if they have suitable
conditions for hedging
• If long and short leverage products are compared, short leverage products generate higher premiums and they require more risky super hedging strategy.
2.1.2.3. Dutch Market
Szymanowska, Ter Horst and Veld (2003) investigated the pricing of 75 reverse convertibles issued between January 1999 and December 2002 on the Dutch market.
Szymanowska, Ter Horst and Veld (2003) found that Dutch reverse convertibles that were examined in their study were overpriced on average about %23. This overvaluation was determined by the difference between the market value of the product and the model value relative to the model value.
2.2. Studies About Structured Products in General
2.2.1. Studies About Anatomy of Structured Products
Wolfgang Breuer and Achim Perst (2005) investigated Discount Reverse Convertibles (DRCs) and Reverse Convertible Bonds (RCBs) as important examples of structured products.
Wolfgang Breuer and Achim Perst (2005) found that DRC and RCBs benefit from low volatility estimates and medium-level return expectation
14 estimates by investors. Both expected utility theory and cumulative prospect theory come to the same qualitative conclusion for these products. Also they concluded as the demand for RCBs by individual investors can only be understood against the background of hedonic framing theory.
Carole Bernard, Phelim Boyle, and Weidong Tian (2007) investigated customer’s wishes so they focus in the design of structured products which meets these investors’ demands rather the pricing of these products. They also declared many investors want both downside protection in bear markets and upside participation in bull markets and there is a wide variety of
structured investment products that cater to such investors.
Carole Bernard, Phelim Boyle, and Weidong Tian (2007) found that optimal design of a structured product with capital protection depends on the issuer’s utility function rather than the issuer’s risk preferences.
Brian J. Henderson and Neil D. Pearson (2007) investigated Structured Equity Products (SEP). In their study they focused on type of SEPs which are medium-term notes with payoffs based on the prices of common stocks, baskets of stocks, or stock indices. They investigated equity-linked products which are linked to common stocks, equity indices, or multiple stocks or indices volume of over $50 billion from 1994 through the end of 2005.
Brian J. Henderson and Neil D. Pearson (2007) found that products linked to individual stocks mostly have concave payoff functions whereas products linked to equity indices mostly have convex payoff functions.
Daniel Bergstresser (2008) investigated structured notes. Unlike the earlier studies, he investigated issuance and performance patterns, using a broad sample based on more than 1,000,000 notes.
15 Daniel Bergstresser (2008) found that investors are looking for
performance while issuers prefer to issue notes whose underlying risks are easier to hedge. Also he found out in this market, investors were getting a negative alpha over the period since 2000 (approximately 100 basis points per month).
Carole Bernard and Phelim Boyle (2008) investigated a particular design of a structural product where the investor’s return is capped periodically and there is also a guaranteed minimum at maturity.
Also they examined which type of contract investor should choose. They discussed the puzzle of investor choice from simple or complex products through their investigations.
Carole Bernard and Phelim Boyle (2008) found that although the structured products are very costly for the retail investors because of pre-packaged solutions, these instruments are still attracting the investors. By the way they showed that some of the consumer choices made in this market are very puzzling from the perspective of standard finance theory. They couldn’t understand why the consumers select a complex contract when a simpler one would appear preferable. Because of these 2 puzzles they come face to face with the fact that the most complicated products are the most overpriced and carry the highest sales commissions.
Nicole Branger and Beate Breuer (2008) investigated the possible solutions for retail investors with different demands. In their study they determined investment certificates as a potential solution for these retail investors. (Especially for the investors who hold their portfolio for 1 year). So they analyzed different certificates and compared them with each other.
Nicole Branger and Beate Breuer (2008) found that simple discount certificates perform better than the more complicated ones with knock-in
16 knock-out features. So they concluded as retail derivatives with a more sophisticated payoff structure are less attractive for the investors.
Patrick Roger (2008) investigated Capital Protected Notes (CPNs) which are very popular structured products since the internet bubble burst in 2000. In his study he also examined the convenience of these types of products to the loss averse investors.
Patrick Roger (2008) found that CPNs are attractive for loss-averse investors. However, using a simple version of cumulative prospect theory, he showed that these products are not attractive to the investors if the investor takes either the underlying index or the risk-free instrument to invest. In other words loss-averse investors never find it optimal to invest in a CPN when their reference return depends on either the underlying or the risk-free asset.
2.2.2. Studies About Pricing of Structured Products
K.C. Chen and Lifan Wu (2007) investigated equity-linked structured notes. In their study they especially focused on the pricing of Bullish Underlying Linked Securities (BULS).
K.C. Chen and Lifan Wu (2007) found that valuation of BULS was overpriced at issue according to the model they used during the seasoning period with a mean pricing error of 2.40%. However, they found also out, this overpricing was soon corrected in the following year with a mean pricing error of −0.16%, which is statistically insignificant.
Rodrigo Hernández, Wayne Y. Lee and Pu Liu (2007) investigated Reverse Exchangeable Securities (RES). In their study they used a detailed survey of the $ 45 billion US dollar-denominated market for 7,426 issues of
17 bonds issued between May 1998 and February 2007. They developed
pricing models for four different bonds to examine the profits.
Rodrigo Hernández, Wayne Y. Lee and Pu Liu (2007) found that result of the survey suggest significant positive profits for the issuing financial institutions. They also showed that a perfect hedge can be obtained with RES and issuing of the certificates is a profitable business. In their study they examined the design, the payoff, the market, the pricing, the
profitability, and the realized returns of expired issues of the RES.
Rodrigo Hernández, Wayne Y. Lee and Pu Liu (2007) investigated OCs. In their investigations they studied €43 billion market by examining 1,507 issues of the certificates issued by banks in Europe. They also
developed pricing formulas to value the certificates and empirically examine the profits in the primary market for issuing the certificates.
Rodrigo Hernández, Wayne Y. Lee and Pu Liu (2007) found that the dividend yields and ex-dividend dates play an important role in the profitability of the certificates. As a further study they developed pricing models for two types of certificates ‘uncapped and capped certificates’ and they found out that issuance of the certificates is profitable for the issuers in their sample.
Jos van Bommel, Silvia Rossetto (2008) investigated Endless Leverage Certificates (ELC). In their study they explained ELC as structured products which are long or short positions in an underlying that are partly financed with a loan from an issuing bank.
Jos van Bommel, Silvia Rossetto (2008) found that the value of an ELC is virtually independent of the volatility of the underlying, and is at most 0.3% higher than its intrinsic value. They found that ELCs are competitively priced and traded, and on average, ELC longs and shorts are overpriced by
18 0.51% and 1.01% respectively relative to their intrinsic values. Also in their study they found desirable properties of ELCs. First, the lower bound value of the product, the intrinsic value, is easy to ascertain and compare with market prices. Second, bid-ask spreads in the secondary market are narrow. ELCs also have desirable ‘behavioral’ properties.
2.2.3. Studies About Regulation of Structured Products
Jennifer Bethel and Allen Ferrell (2006) investigated possible risks that can be involved by the usage of structured products.
Jennifer Bethel and Allen Ferrell (2006) found that first of all there is not an enough regulation for the structured products and investors are buying them at most of the times without understanding them. They suggested several possible approaches for structured products regulation such as classifying investors as accredited and no accredited investors and allow only accredited investors to invest in structured products,
restructuring the distribution of structured products (preventing large denominations, enhancing suitability requirements). They suggested these kinds of possible regulations in order to reduce the probability that investors hold inappropriate structured products. They also suggested improved disclosure (containing all explicit fees and best practices) and more accessible information such as web-based memoranda.
Thorsten Hens and Marc Oliver Rieger (2008) investigated optimal design and introduction of structured products to the investors. In their study they used data from Germany and Switzerland. They focused on the reasons why structured products look so attractive for many investors.
Thorsten Hens and Marc Oliver Rieger (2008) found that attractiveness of structured products can arise as a solution for enhancing the performance of a portfolio purposes. Also they found some behavioral factors like loss
19 aversion or probability of misestimation can increase the attractiveness of these products in the eyes of potential investors. They suggested improving the understanding of customer instead of banning structured products completely (as it is discussed in some countries).
2.3. Overview of Literature Review
Studies that were made in the past for structured products showed that most of the studies focused on pricing and performance of the structured products like Certificates of Deposits, Reverse Exchangeable Securities, Discount Certificates, Capital Protected Notes and etc… Researchers investigated these products whether in specific markets or in general.
Findings of the studies are differed from each other. However, it can be told that according to the most of the empirical studies; pricing of these products are in investors’ disadvantage when the prices in primary or secondary markets are testing according to different pricing models like Black & Scholes model. Also when the performance of the structured products are analyzed most of the studies showed that investing in risk free instrument or investing directly to the structured products’ underlying asset could be better for investors.
20
3. STRUCTURED PRODUCTS
3.1. Definition of Structured Products
Structured products are ‘tailor-made’ products which aim to provide the best solution to the investors with this ‘tailoring process’ (Kat 2001). There is not a single definition for structured products. Different definitions can be found in different sources.
• Definitions of structured products from web;
Web site (http://www.wikipedia.org/) defined structured product as ‘‘A structured product is generally a pre-packaged investment strategy based on derivatives, such as a single security, a basket of securities, options, indices, commodities, debt issuances and/or foreign currencies, and to a lesser extent, swaps.’’
Web site (http://www.hedgefund-index.com) defined structured product as ‘‘structured products are synthetic investment instruments specially created to meet specific needs that cannot be met from the standardized financial instruments available in the markets.’’
• Definitions of structured products from well-known institutions;
Definition of SSPA (Swiss Structured Products Association) is ‘‘structured products are investment products available to the public whose repayment value derives from the development of one or several underlying assets.’’
Definition of (http://www.structuredretailproducts.com ) is ‘‘structured products are investment products that generate a pre-defined return linked to one or more underlying financial prices, rates or indices.’’
21 • Definitions of structured products from books;
Structured products are defined as ‘‘structured products refer to
combinations of individual financial instruments, such as bonds, stocks and derivatives.’’ by Oesterreichische Nationalbank (Structured Products Handbook 2004)
According to Chorafas D.N (2007) ‘‘Structured products are securities that provide investors with a redemption amount, which may be with either full or partial capital protection, and a certain type of return.’’
Das (2000) defined them as ‘‘combinations of derivatives and underlying financial instruments which exhibit structures with special risk/return profiles.’’
As it can be realized from all these definitions; although there is not a single definition for structured products, there are some certain features that can be mentioned for the structured products like;
• Mostly they consist of at least 2 products; a common bond or a deposit, plus a derivative.
• The payoffs of the structured products depend on one or more underlying assets.
According to these features it can be told that;
Structured Products are tailor made financial instruments that are composed of mostly more than one product and have a performance depending on one or more underlying assets.
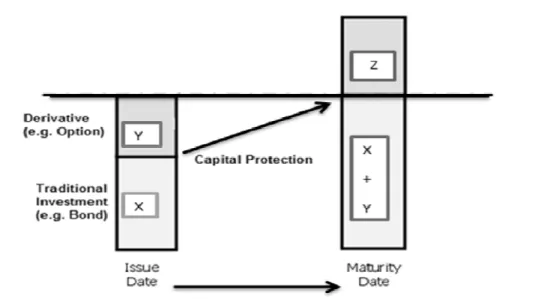
22 3.2. Composition & Design of Structured Products
Most of the structured products consist of 2 components; basic financial instrument (BFI) component and derivative component (See figure 3.1). The payoff, risk-level and general characteristics of a structured product can be determined from these 2 components.
Figure 3.1: Composition of a Basic Structured Product
In BFI component, products like bonds, notes and deposits can be located. This component generates a fixed return to the structured product in most types of structured products.
In derivative component mostly options with different kinds of underlying instruments and different strategies are located. Options in this component can be linked to different instruments like equities (stocks, indices), commodities, foreign exchanges and interest rates. They can be linked to a single type of instrument or more than one instrument as a hybrid design. Options in derivative component can be in different types like call & put, vanilla & exotic options (barrier, lookback, asian and etc… (See
Appendix A for most popular types of exotic options that are used in structured products) and these options can be in different strategies like bearish, bullish and neutral.
All the characteristics of a structured product like payoff, maturity, underlying instrument and its risk level can be determined according to;
23 • The type, maturity and payoff features of the instrument(s) that is
located in BFI component. (e.g. if it is a bond; type of this bond (government or corporate & zero or coupon) , its interest rate and maturity affects the structured products payoff & risk level) • The type, maturity and payoff features of the instrument(s) that is
located in derivative component. (e.g. if it is an option, its
underlying asset (fx, equity, interest rate, commodity or hybrid), its type (call & put, vanilla & exotic), its strategy (bearish, bullish, neutral) and its maturity affects the structured products payoff & risk level)
• The weight of these components.
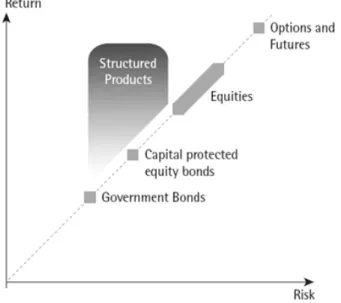
Figure 3.2 illustrates structured products on risk-return graph.
Source: BNP Paribas Equities and Derivatives Handbook
Figure 3.2: Structured Products in Risk & Return Graph
As it can be realized from that graph a typical structured product locates between bonds and options on risk-return graph. In other words structured product is more risky than government bonds and less risky then options.
24 According to the types, characteristics and ratios of structured products’ components, risk level of the structured products can move between the risk level of government bonds and options.
In order to move a structured product’s risk level between the risk level of government bonds and options, components and their weight should be re-structured.
• With the identical components of 2 different structured products; the weight of these components affects the risk level of these structured products. Greater weight of bond component moves the structured product through government bond risk level, greater weight of derivative component moves the structured product through options risk level.
• With the same weight and identical BFI components of 2 different structured products, the risk level of derivative components effect the risk level of these structured products. Riskier option component moves the structured product through options risk level, less risky option component moves the structured product through government bond risk level.
• With the same weight and identical option components of 2 different structured products, the risk level of BFI components affect the risk level of these structured products. Riskier BFI component moves the structured product through options risk level, less risky BFI
component moves the structured product through government bond risk level.
25 3.3. Types of Structured Products
Until this section we analyzed the definition and the composition of the structured products. In this section types of the structured products will be analyzed according to;
• The market that they bought & sold • Their underlying asset
• Their risk level
3.3.1. Structured Products and Their Market
Structured products are financial instruments so they should have a market to be bought or sold. According to their trading markets they can be divided into 2 categories;
3.3.1.1. Structured Products in OTC markets
These types of structured products don’t have an organized market and mostly traded between two different parties. There is not an organizer of these transactions and the parties are responsible to each other for all the liabilities that come along with the product.
For example; Dual Currency Deposit (DCD) which will be analyzed in Chapter 5, can be count as a structured product whose transaction occurs in OTC markets. In the transaction of a DCD product there are two different parties and one structured product whose specifications (maturity, strike price, underlying asset and etc…) are determined and fixed by these two parties. The possible outcomes and liabilities will be faced by these two parties only; not by another third party.
26 3.3.1.2. Structured Products in Organized Markets
These kind of structured products are bought and sold in organized markets, that is to say transactions of the products occur under the control of an authority and its set of rules and regulations.
The best examples of this category are the structured products which are traded in Scoach1. Unlike the structured products traded on OTC markets, these kinds of products bought and sold in an organized market.
3.3.2. Structured Products and Their Underlying Instrument
Another categorization of the structured products is according to their underlying instrument. Although there are unlimited strategies to compose a structured product there are some main instruments that can be considered as underlying assets when we analyze structured products.
Foreign Exchange (FX) Linked Structured Products: The payoffs of
these kinds of structured products depend on the performance of the
currency which is underlying. Products can be linked to one single currency pair or a basket of currency pairs. Most popular types of currency pairs can be formed between USD, JPY, EUR, CHF, GBP, CAD and AUD (Wystup 2006)
Commodity Linked Structured Products: The underlying assets of
these kinds of structured products are commodities. Underlying asset can be a single commodity or a basket of commodities. Some popular types of commodities are gold, silver, oil and etc…
1
Scoach is an exchange market for European Structured Products that is located in Germany and Switzerland. In Germany; European structured products are traded and more than 300.000 products are located in this market. In Switzerland Swiss structured products are traded and more than 22.000 products are located in this market. For further details see www.scoach.com.
27 Equity-Linked Structured Products: They are promoted as an
alternative to directly investing in equities since the underlying assets of these kinds of structured products are equities (Chorafas 2007). There are 2 main types of equity linked structured products: Share linked and Index linked structured products. Share linked structured products can be composed of a single share or a basket of shares. Some popular types of shares are Deutsche Bank, Allianz, Bayer and etc… Index linked structured products can be composed of a single index or a basket of indices. Some popular types of indices are DJ Eurostoxx50, DAX, FTSE100 and etc…
Interest Rate Linked Structured Products: The underlying assets of
these kinds of structured products are interest rates. Products can be linked to one single interest rate or a basket of interest rates. Some popular types of interest rates are LIBOR, EURIBOR and etc…
Hybrid-Linked Structured Products: In these kind, different types of
underlying instruments comes together in a structured product. For example if a product has currency, commodity and equity as underlying at the same time, this structured product can be evaluated as hybrid-linked structured product.
These 5 types of underlying instruments can be classified as the major types, despite them there are other types of underlying instruments such as;
• Credit Linked Structured Products: In this kind, the underlying asset is mostly a pool of debt instruments. So the performance of the structured product linked to these debt instruments. (e.g. Asset Backed Securities, Credit Default Obligations and etc…)
• Fund Linked Structured Products: In this kind the product and its payoff is linked to the performance of a fund. Most popular type is
28 hedge fund linked products. They provide their investors, easy and less costly participation to the hedge funds.
• Inflation Linked Structured Products: In this kind, the product is linked to a single inflation rate of a specific country or a zone or basket of inflation rates. Most of them target to protect investors from resurgence in inflation (Chorafas 2007).
3.3.3. Structured Products and Their Risk Level
In this section structured products will be categorized according to their risk levels. Figure 3.3 shows main types of structured products when their risk levels are considered;
Source: http://www.juliusbaer.com
Figure 3.3: Structured Products and Their Risk Levels
As can be seen from figure 3.3; there are 4 main types of structured products according to their risk levels and they can be lined up from less risky to the riskier as following:
29 1. Capital protected products
2. Yield enhancement products 3. Participation products 4. Leverage products
At this section the categorization of structured products are made according to the classification of structured products made by Swiss Structured Products Association (SSPA) and European Structured
Investment Products Association (EUSIPA). Within the following sections most popular types of products will be analyzed. (See Appendix C for all types of structured products according to SSPA and EUSIPA structured products categorization model.)
3.3.3.1. Capital Protected Products
Capital protected products are structured products which protect the initial investment at the maturity. These products can also generate a return to their investors above their initial investment. These kinds of products mostly consist of a traditional bond (the part which protects the initial investment at the maturity), plus a derivative (the part which may generate a return above initial investment – mostly option.)
In these kinds of products; return of the product above the initial investment is determined by option’s performance multiplied by
participation rate. Participation rate is determined by dividing the remaining capital after investing in traditional bond to the price of derivative that is used to structure this capital protected product.
In capital protected products; mostly issuers set the capital protection level at 100%, but they can also set it higher or lower. In Europe today’s low interest rates make it harder to provide %100 capital protection to the investors while structuring attractive products that’s why %70 - %80 capital
30 protection started to used in most of European capital protected products. (Marray 2009)
Figure 3.4 shows composition and operating process of a basic capital protected product.
Source: http://www.investopedia.com
Figure 3.4: Composition of Capital Protected Products
In Figure 3.4; Y refers to value of a derivative, X refers to value of a bond. At the maturity the value of bond will reach the initial investment which is X+Y. So the capital is protected by this way. At this example Z refers to an extra yield that is generated by the option.
At the maturity X+Y generated independent from the option’s
performance. On the contrary, Z which represents the yield above the initial investment is dependent to the option’s performance and participation rate.
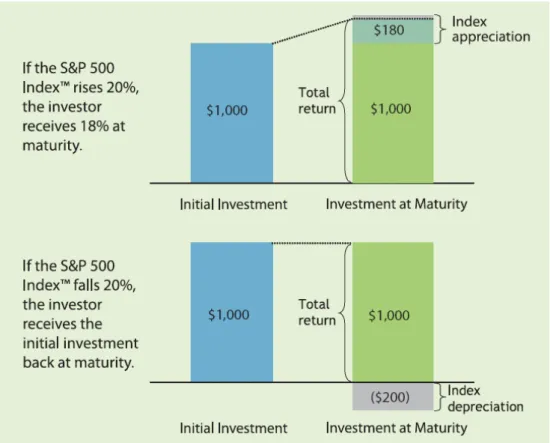
Figure 3.5 shows a numerical example of a capital protected product from JP Morgan Structured Investments Solution Catalogue (2007). In this figure return of a $1000 investment to a capital protected product linked to
31 the S&P 500 Index with a 90% participation rate is shown in 2 different scenarios.
Source: JP Morgan Structured Investments Solution Series Volume 1
Figure 3.5: A Capital Protected Product Example
In the first scenario; if the S&P 500 Index rises to %20, then the investors receives at the maturity; initial investment * S&P performance * participation rate = 1000 * 0,20 * 0,90 = $180
In the second scenario; if the S&P 500 Index falls to %20, then the investor receives at the maturity his/her initial investment which is equal to $1000. In this scenario rather than incurring a $200 loss in the initial investment, investor receives his/her principal back at the maturity.
32 Capital protected products can be considered as transition products for the structured products market. As can be seen their place on risk return graph from Figure 3.3, retail investors who didn’t invest in structured products before mostly choose these kinds of products if they want to try investing in structured products for the first time. In other words, it can be told that; capital protected products are the middle term between the phrases of being a conservative investor and sophisticated investor. Because of this reason as Roger (2008) reported in his study; most of the banks offer their customers these types of structured products by assuming that most of their customers are loss averse investors. Before investing in more risky
structured products, loss averse investors firstly chooses capital protected structured products.
3.3.3.2. Yield Enhancement Products
Yield Enhancement products are kind of structured products which are desirable to the investors when markets are stable or moving sideways. They offer returns above the traditional bonds if the underlying assets’ prices move sideways or go up (Barlocher 2009). If investors invest in these types of products their yield can be above market; however, their capital may be at risk. In these kinds of products the risk of the investor occurs when the prices of underlying assets go down. Mostly these products have a predetermined limit on the return (cap). Investors who invest in yield enhancement products mostly have following market expectations (‘SSPA Swiss Derivative Map’ 2009);
• Sideways market (flat market; prices of instruments are moving sideways) of underlying
• Falling volatility.
There are two main types of yield enhancement products; Discount Certificates and Reverse Convertibles. Reverse convertibles have coupon
33 payments which are above the coupon payments of traditional bonds;
however, discount certificates have no coupon payments, they are sold at prices below their underlying assets’ market price (Barlocher 2009).
a. Discount Certificates
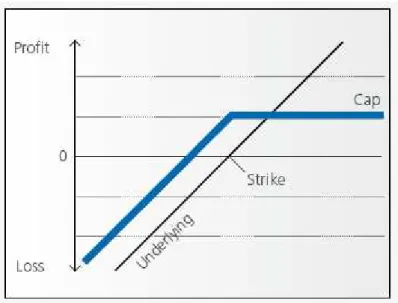
Discount Certificates (DCs) are structured products which allow investors to invest to an index, basket of securities or a certain security with a price which is lower than the market price. (That’s why they known as ‘discount’ certificates). This discount is given to the investor in exchange for a fixed maximum return which should be accepted by the investor. This fixed maximum return is known as predetermined cap.
Each DC has its own underlying security and a maximum price which is called cap strike. At the certificate’s maturity, if the price of the
underlying is lower than the cap, the investor receives physical form of the underlying (if the underlying is a share). Instead of physical delivery of the underlying, for DCs that are consisted of non-traded assets like indices, cash settlement is also possible (Wilkens, Erner and Roder 2003). On the other hand, if the price of the underlying is higher or equal to the cap, the investor receives the maximum amount which is equivalent to the cap.
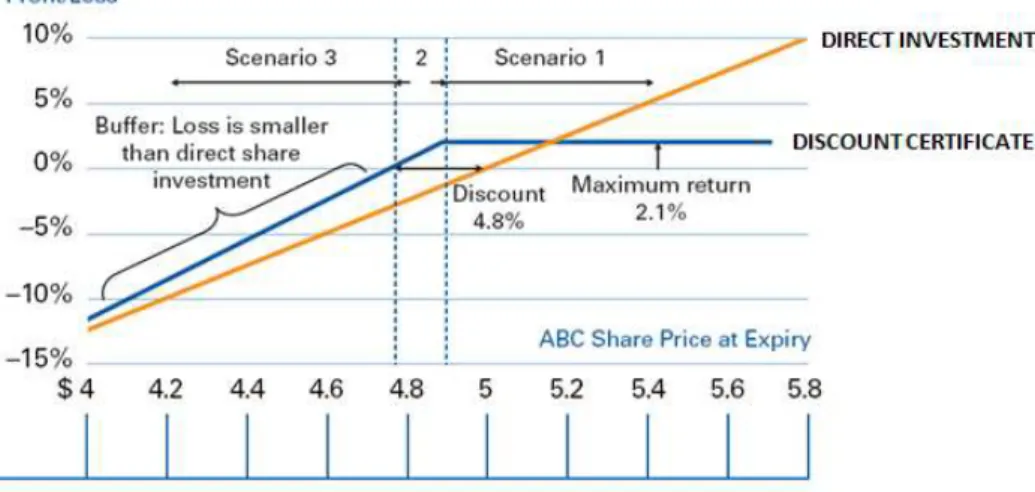
In Figure 3.6 an example from Deutsche Bank AG Discount Certificates Product Brochure (2006) can be found. In Figure 3.6 x axis shows the prices of underlying ABC share and y axis of the graph shows the payoff amount of discount certificate at different prices.
34
Source: Deutsche Bank AG Discount Certificates Product Brochure (2006)
Figure 3.6: A Discount Certificate Example
In this example it is assumed that; ABC share is trading at $5. A 1-month Discount Certificate on ABC with a cap strike at $4.86 costs $4.76. Investors may get the share at a discount of % 4.8 (of the initial share price) but in return, they have to accept a maximum payout of $4.86 which will give a maximum return of 2.1%.
Till maturity; DC’s price will be depended on the ABC share but not reflect precisely. The DC tracks upward movements to the cap strike, on the other hand when the price of the share falls, the DC price also falls.
At the maturity; such possible scenarios could occur:
• Scenario 1: The underlying share is trading at or above the cap strike. Then the DC pays the cap strike of $4.86.
• Scenario 2: The underlying share is trading below the cap strike and higher than the original invested amount. Then the investor will get one underlying share. In total investor receives a return since current price of the share is higher than the original investment amount.
35 • Scenario 3: The underlying share is trading below the cap strike and
the original invested amount. The investor will get one underlying share. The investor receives a loss in total since current price of the share is lower than the original investment amount. But this loss will always be lower than a direct investment on the underlying share.
b. Reverse Convertibles
Reverse Convertibles (RCs) are securities that are linked to an
underlying stock and pay above market coupons. In return for this coupon, there is no guarantee that investors will recover the full amount of invested capital and unlike direct investment in a stock or bond, upside potential of a RC is limited to this coupon amount. (‘JP Morgan Structured Investments Solution Series Volume III: Reverse Exchangeables’ 2007). They are also known in the market as Reverse Exchangeable Securities (RES) and described by Benet, Giannetti and Pissaris (2003) as interest-paying, non-principal-protected structured products, offering a fixed interest rate that is higher than conventional debt securities.
At maturity the price of underlying is compared to the price at the time of issue. So the investor gets coupon payment + principal investment if the price at the maturity is equal to or greater than the initial price of the underlying. If the price at the maturity is less than the price at the time of issue then the investor gets number of shares that is found by dividing the principal investment by the share price at the time of issue.
Figure 3.7 shows payoff graph of a RC. In this figure the line which is thin represents the price change of underlying asset and the line which is thick represents the payoff of a discount certificate according to the price changes of the underlying asset. x axis shows the prices of underlying asset and y axis of the graph shows the payoff amount of RC at different prices.
36
Source: SSPA Swiss Derivative Map
Figure 3.7: Payoff Graph of a Reverse Convertible
As can be seen from Figure 3.7; at the prices that are above the strike price, RC pays a fixed amount of return to the investor. In the figure this amount is shown as ‘cap’. At the prices that are below the strike price, payoff of RC will be affected 1 to 1 by the performance of underlying share. In other words if underlying share price will fall %a, the price of RC that is linked to this share will fall %a.
To explain how RCs work; following example is given:
Let’s assume; an investor purchases $1,000 of a one-year reverse convertible linked to the price of XYZ share, price of XYZ share at issuance is $10 (strike & initial price) and the coupon rate is %10
At the maturity If the price of XYZ share is $10 or greater; investor will receive $100 (cap) in interest and the return of his principal, for a total of $1,100. If the price of XYZ share is less than $10 let’s say $5, the investor receives $100 interest plus 100 shares (1,000 divided by 10) of XYZ share.
37 To compare investing in XYZ share directly and investing RC linked to XYZ, Table 3.2 is designed. In this table 4 different scenarios are
considered as the XYZ share’s price will be EUR 12, 10.8, 9 or 7 at the maturity. According to these scenarios; comparisons are made in order to show the advantages & disadvantages of investing in RC in different prices at the maturity.
Table 3.1: Direct Investment - Reverse Convertible Comparison
Price at Maturity
Direct investment in XYZ share
Reverse Exchangeable on XYZ share
Scenario 1 EUR 12 Profit of 20% Profit of 10% (coupon)
Scenario 2 EUR 10.8 Profit of 8% Profit of 10% (coupon)
Scenario 3 EUR 9 Loss of 10% Profit/loss of 0 (10% loss on share
price 10% profit from coupon)
Scenario 4 EUR 7 Loss of 30% Loss of 20% (30% loss on share 10%
profit from coupon)
As can be seen from Table 3.1;
In scenario 1; at the maturity the price of XYZ share is EUR 12, direct investment to the XYZ share will lead a 20% profit for investor while investing in RC linked to XYZ share will lead a profit of %10 that is equal to the coupon amount.
In scenario 2; at the maturity the price of XYZ share is EUR 10.8, direct investment to the XYZ share will lead a 8% profit for investor while investing in RC linked to XYZ share will lead a profit of %10 that is equal to the coupon amount.
In scenario 3; at the maturity the price of XYZ share is EUR 9, direct investment to the XYZ share will lead a 10% loss for investor while